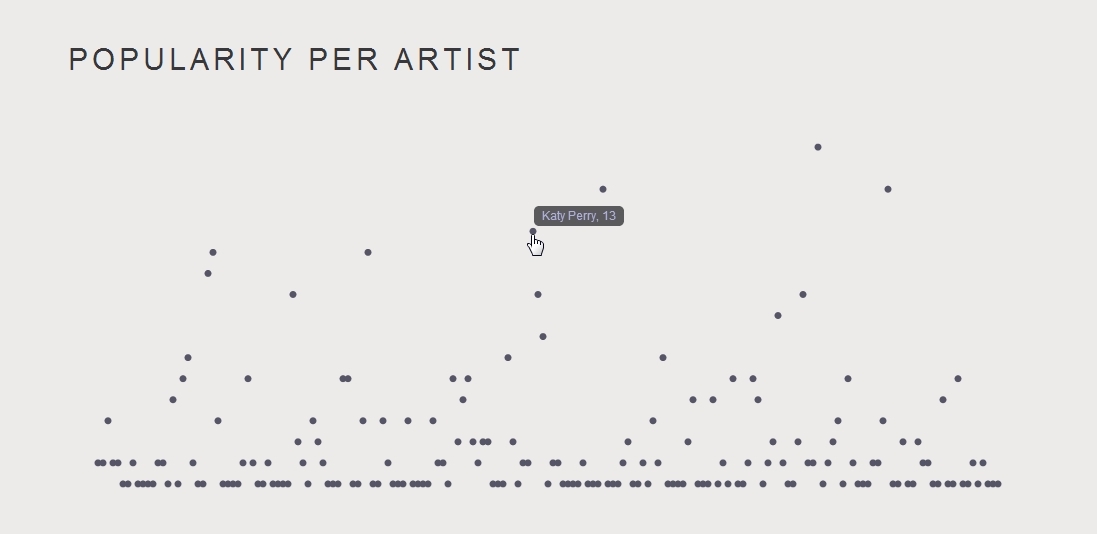
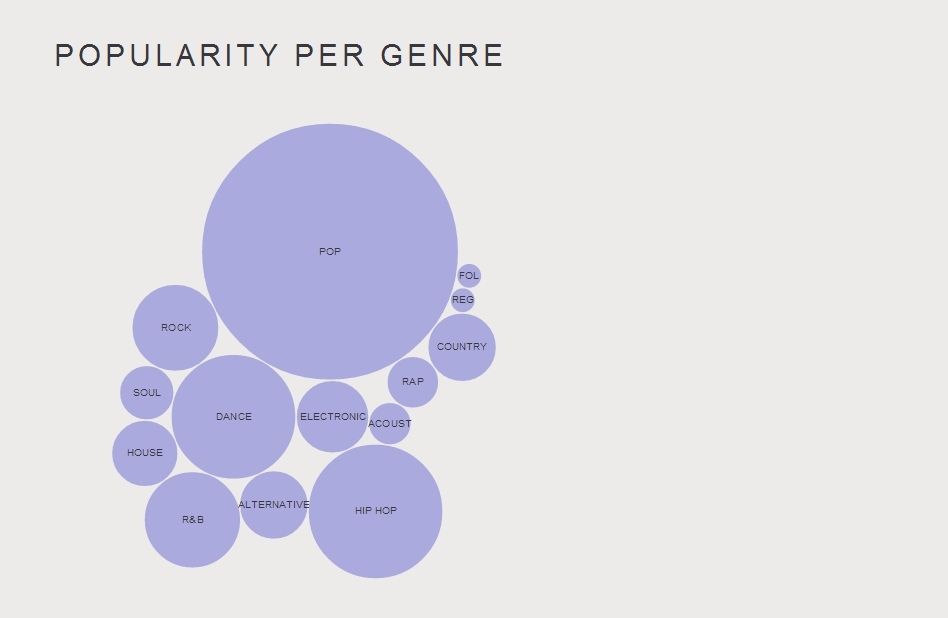
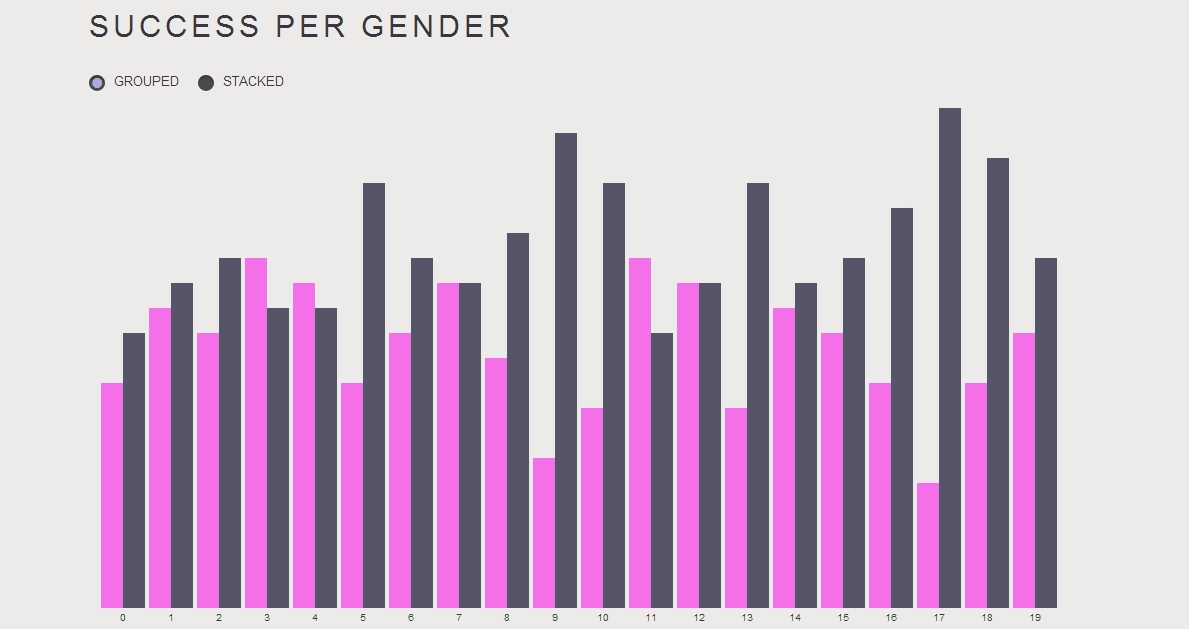
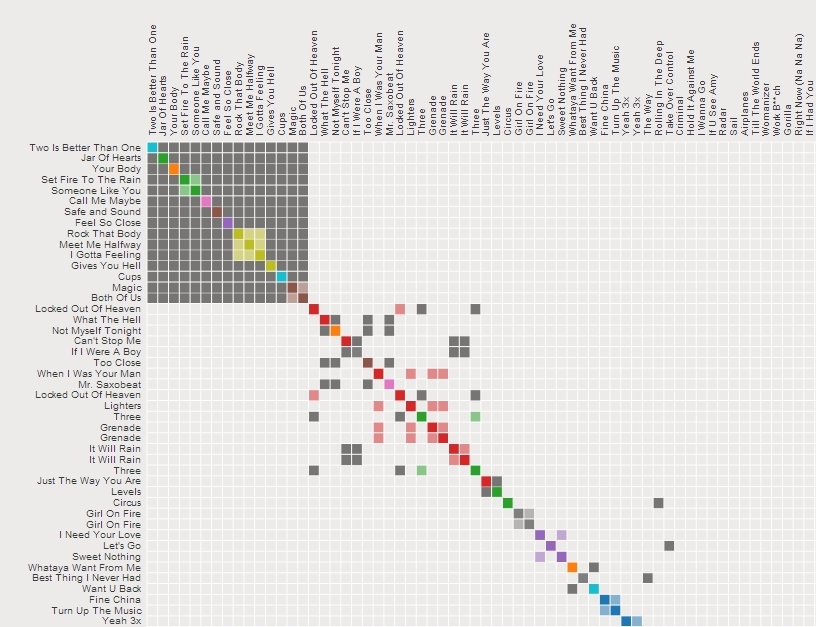
Description Using Kimono, I gathered songs that made it to the top 100 annual chart during the past 5 years. I extracted additional information – such as gender of the artist(s) and song lyrics – using multiple APIs, including last.fm and lyricsnmusic. I filtered and cleaned all this data, and pushed it to Google spreadsheets. I extracted the data using sheetsee.js and visualized it using four examples from D3.js. Some visualizations were easy to implement, such as the bubble chart, while others more challenging. This assignment was exciting, informative and an absolute delight. It made me realize how powerful Google Spreadsheets API is. I feel like there is almost no need for a back-end anymore, and this is simply wonderful.


