I wasn’t sure what data to use for the scraping assignment, so I decided to geek out instead.
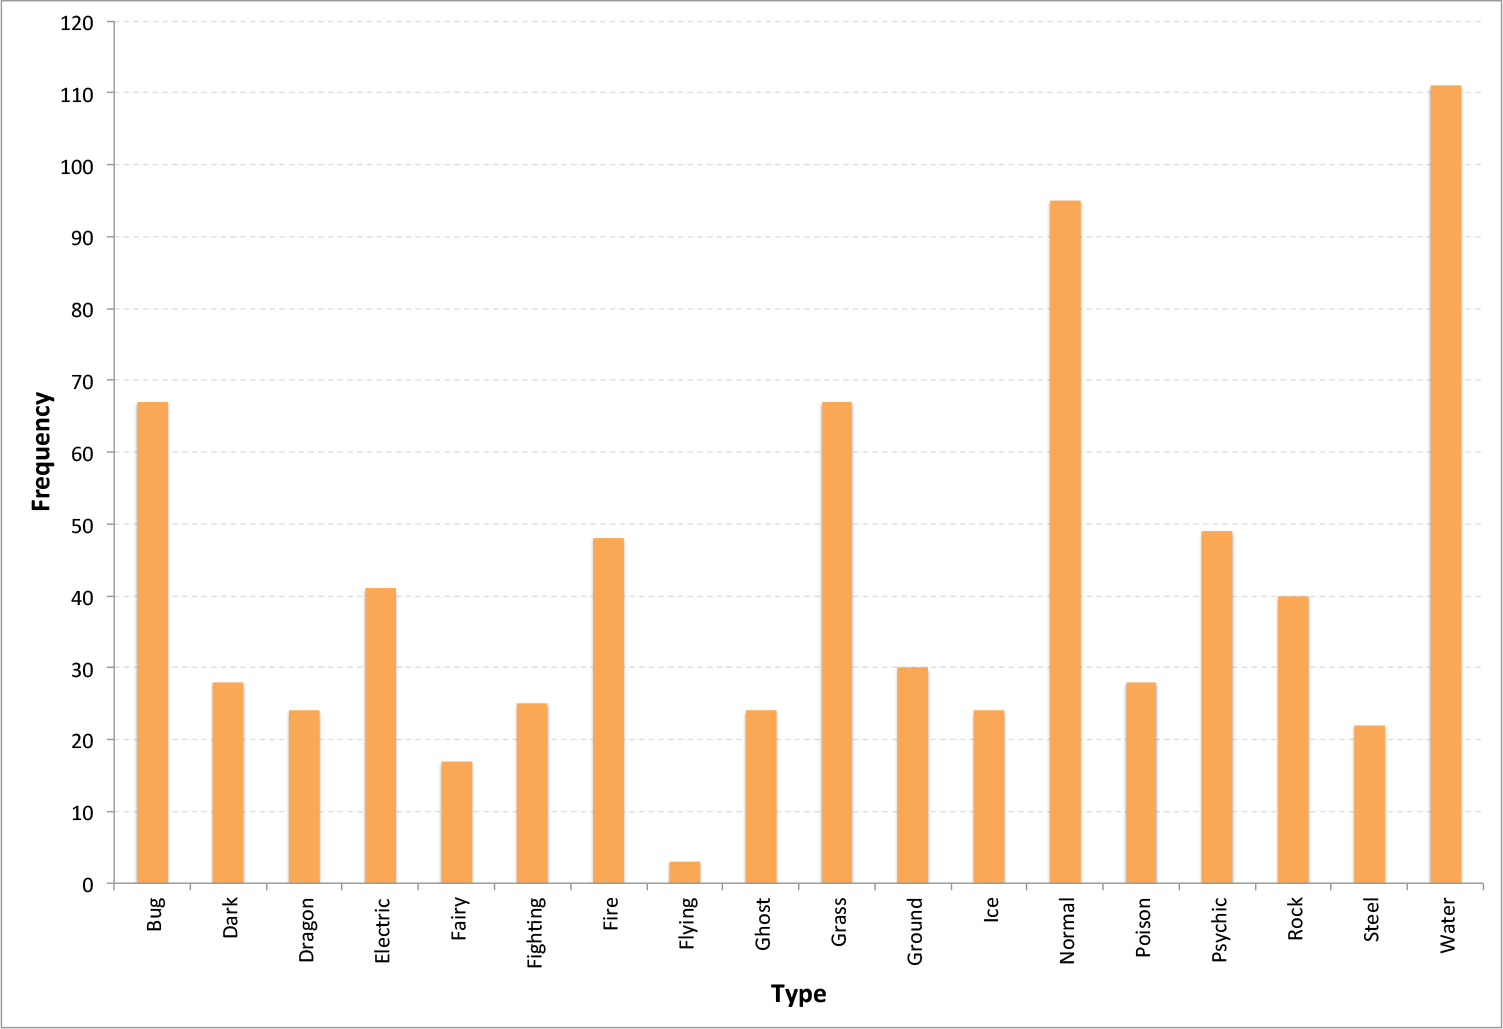
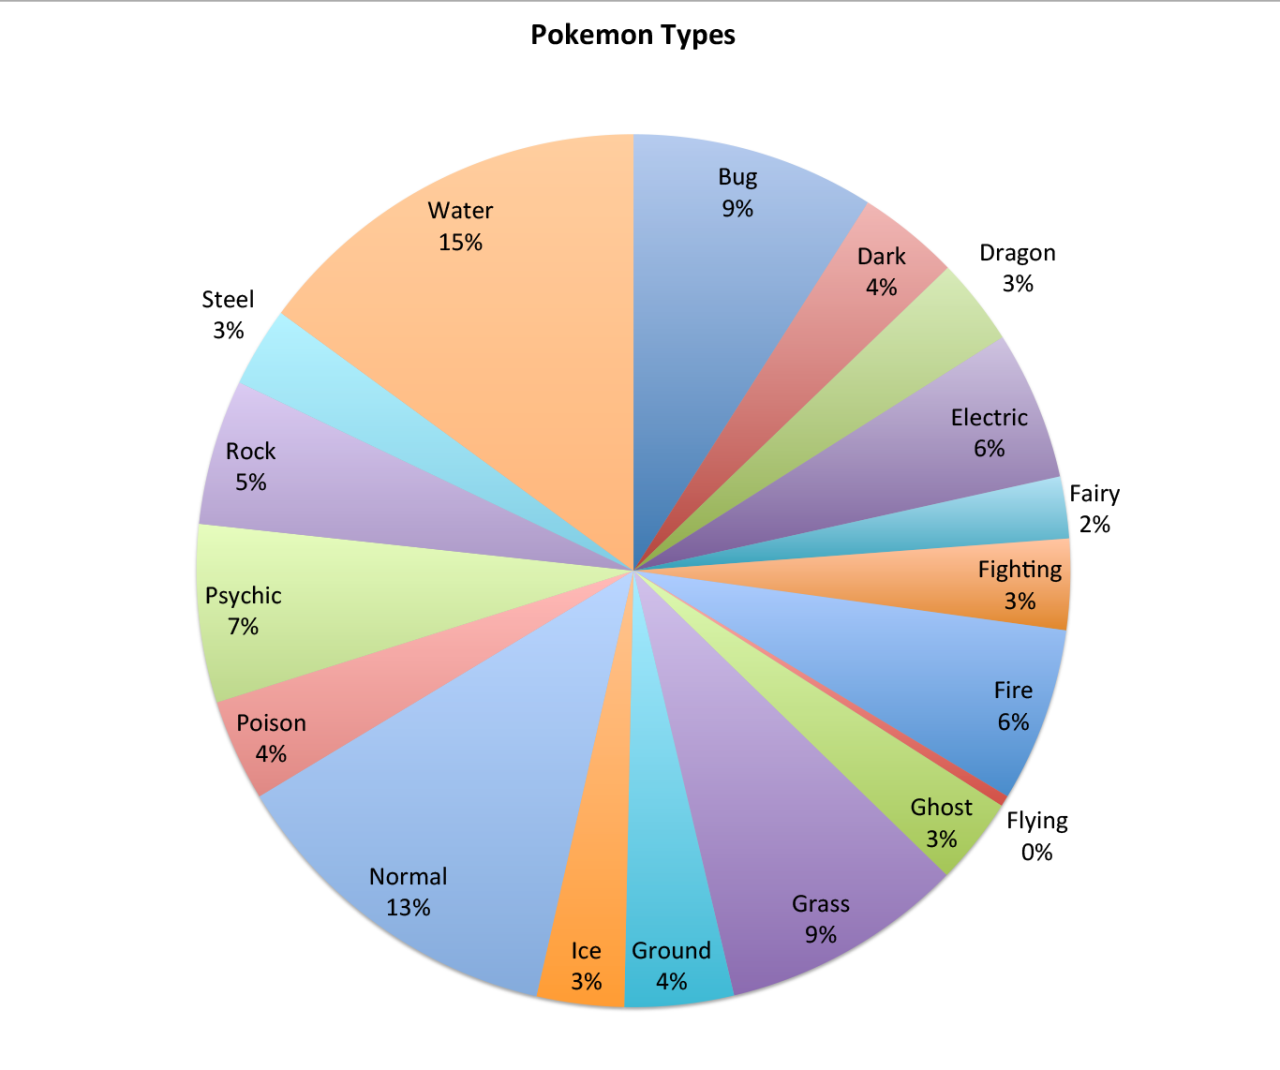
(data scraped from Bulbapedia using kimonify)
As a huge fan of the Pokemon games, I probably find statistics like these to be more useful than most other people… It is also interesting to see how Pokemon types correlate (somewhat) to the distribution of animals in the real world (e.g. Water Pokemon are the most common).
I want to also compile statistics of animals found in different geographic landscapes (volcanic areas, rainforests, deserts, etc.) and associate them with some of these Pokemon statistics somehow. Finding connections and discrepancies between the real world and virtual world is both really interesting to investigate and easy to visualize using statistical data.
After the project, I made an attempt to change the data and modify the visualization so that it could be both more interesting and interactive. My idea was to compare Pokemon types against Pokemon Egg Groups and see how types were distributed between different Egg Groups. To achieve this, I would use a Clustered Force Layout, in which the Pokemon would be ‘clustered’ by Egg Groups with the colors denoting the type. Unfortunately, I had trouble compiling the html file and ran into errors like “XMLHttpRequest cannot load file” that I was not sure how to work around… Joel suggested that I use Python’s HTTPServer, so I was able to work around that issue. Thanks!
Regardless of all the difficulties I’m having, I am still really interested in revisiting this project later (after consulting people who are more proficient at D3 than I am)–mostly out of personal curiosity for how the data would look like.
Github here.