Jon Miller – Looking Outwards 1 – mobile phone usage collage
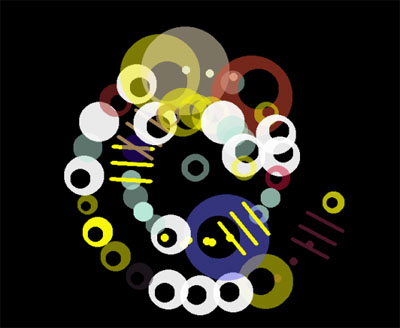
This application, which runs on mobile phones, visualizes a person’s mobile communication usage patterns. Each connection is converted into a graphic based on its duration and type, and the results are all displayed together in a colorful, unique image.
I chose this example because I think it is a good instance of data being displayed in an aesthetically appealing, yet useful way. One can, at a glance, look at one’s own recent usage, including also the relative amounts of usage to each other, which could be useful as a type of “cellphone barometer”.
Since the rules of how to display data have become more solidified as communication design and interaction design have become more explored fields, it is refreshing to see an application which chooses a unique way of displaying information. It is unlikely, but perhaps this style will replace bar graphs for certain information.
Source: link