Project 1 – Scenic
Version 1.0
The goal of this project is creating a heat map of attractive and scenic places for Google maps. Find more about this project here.
For the first step, I developed a JavaScript based web-page combining Google maps and a Processing environment. In this web-page user can navigate through maps using Google map system, while JavaScript code transfer map boundary coordinates to processing applet embedded. Processing applet use map boundary data to get number of uploaded pictures on http://www.panoramio.com/, which are tagged to be within those boundary coordinates. Applet divides map to sub-maps, based on “Precision” value which is controllable using “Precision” scroll in bottom of the web-page, and get number of pictures for each sub-map. Processing applet gets number of pictures by querying following string:
“http://www.panoramio.com/map/get_panoramas.php&order=popularity&set=full&from=0&to=0&minx=” + minX + “&miny=” + minY + “&maxx=” + maxX + “&maxy=” + maxY
in which minX,maxX,minY, and maxY are boundary coordinates. The result of above query is a JSON file containing a field called count, which specifies number of pictures within the coordinates. Using number of pictures and maximum pictures of sub-maps an array of transparency would be created. The JavaScript get this array from applet and create a heat-map for current map based on it, and display the heat-map on top of map.
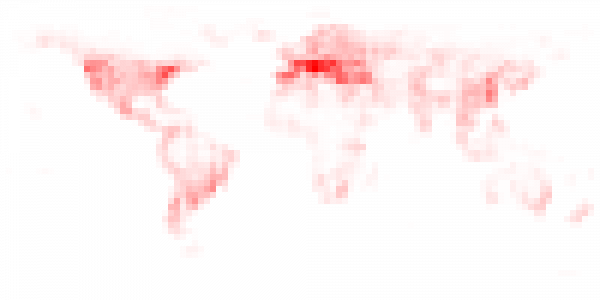
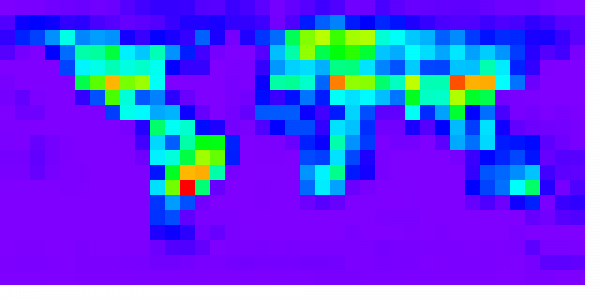
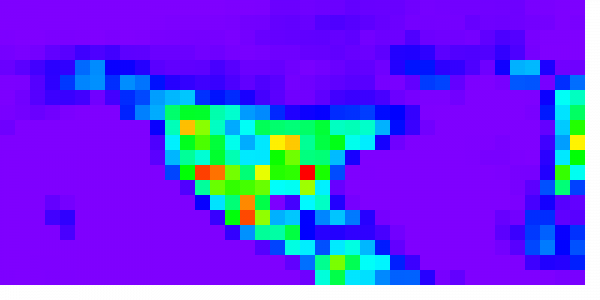
Applet is able to create two different kind of heat-map, red transparent variant map and color spectrum map. User can alternate between two modes by pressing “Mode” button. Also, user can control heat-map overall transparency by “Transparency” scroll-bar. Finally, user can remove less attractive places by adding value of “Popularity”.
Currently, there are two main problems stops the web-page from working:
1- JavaScript can not get the transparency array from the applet.
2- Generating the transparency array has O(n^2) complexity runtime, which makes it really slow in “Precision” values more than 10.
Below are some heat-maps generated by the applet:
Heat-map of Earth (Precision = 1)
Heat-map of Earth (Precision = 3)
Heat-map of Earth (Precision = 5)
Heat-map of Earth (Precision = 2)
Heat-map of North America (Precision = 2)


