# Studying my shopping sprees and walking habits
Description I gathered different types of data during the first two months that I spent in Pittsburgh. These include how much I spend every day, how many steps I walk, which places I visit, what songs I listen to and who I interact with.
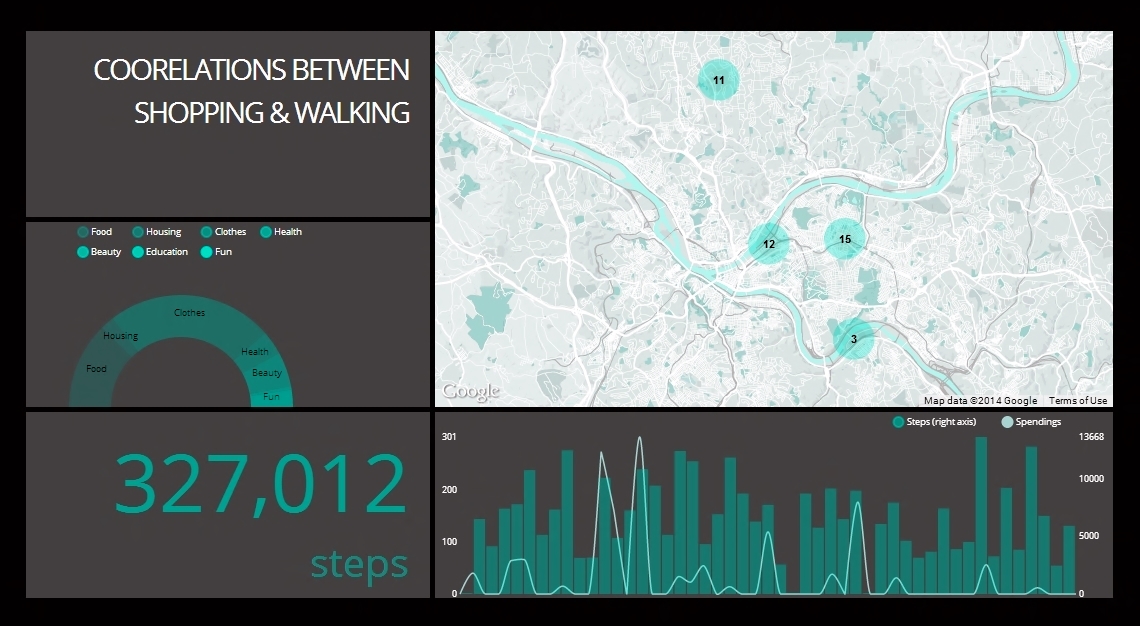
After today’s critique, I decided to narrow down the diversity of the data-set, and stick with only how much I spend, where I go and how many steps I take. This project addresses my curiosity and interest in highlighting the correlations that exist between my frequent shopping sprees and my walking habits.
Tools I am using Tabletop to access data stored on Google Spreadsheets. I visualized the data using D3, nvd3 and Google Map API.