Eye Tunes: A visualization for the Oculus Rift of all the songs I downloaded during each month of the year since 2010.
Here is the data on a Google Docs Spreadsheet.
The Arduino Leonardo “power glove” I made:
Hooray for the classic ‘Arduino in the Altoids can’ image!
Sketches:
This project was both a challenge and a joy to work on–in spite of all the hours of pulling my hair out because of OpenFrameworks / numerous Oculus migraines, I was satisfied with the end result and had a lot of fun playing around with it.
I was never really interested in hardware / physical computing until near the end of last semester in Electronic Media Studio II, when we started to play around with Arduinos. I was interested in getting out of my comfort zone of working with purely virtual visualizations, and decided to explore how tangible mediums can enhance a visual experience. Thus, I used the Oculus Rift with a self-designed Arduino power glove to realize my Quantified Selfie. The data was taken from my iTunes library while the visualization was created in OpenFrameworks using the ofxCsv, ofxOculusRift, and ofxSpeech addons.
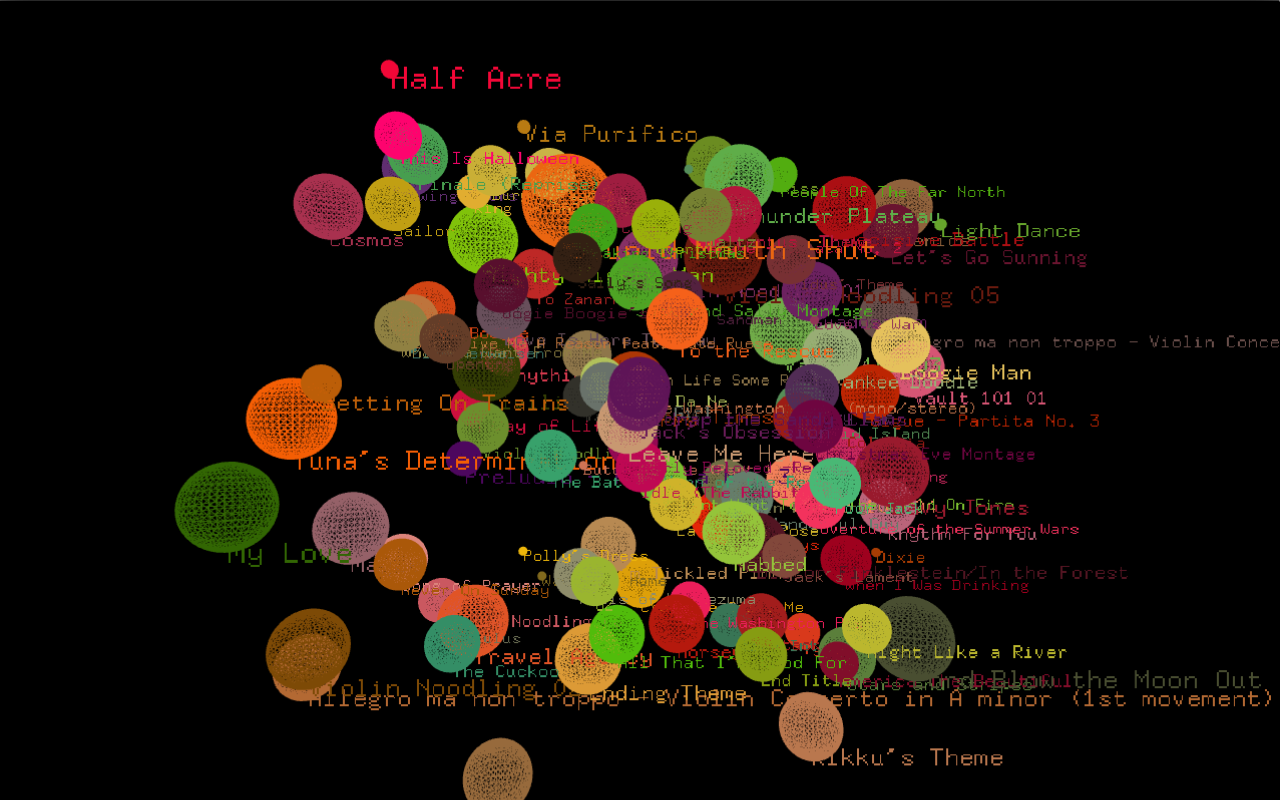
Basically how it works is that the user ‘experiences’ the visualization with the Oculus and controls the visuals with the power glove and their own voice. When the user says the name of the month they would like to inspect, a screen showing the number of songs downloaded for that month will be momentarily displayed, followed by the visualization itself. What they see looks a lot like these decorative cotton ball lights I used to own in the bygone days:

(the photo isn’t mine, but I think the lights I had were very similar)
I initially wanted to include algorithmically-generated audio for each month which mashed up all the songs I downloaded during that time (special thanks to Haris for referring me to Tina Liu, who’s developing an algorithmic medley generator for her grad thesis), but the logistics ended up getting too complicated. Nevertheless, I am satisfied with the final product and feel that including sound might disrupt the cohesion of the visualization.
It was really interesting to see the type of music I was in the mood for during certain months and how my music downloading activity could vary greatly at different times of the year.
eyeTunes from truffles on Vimeo.
Github stuff here.