Category Archives: project-0

Project 0

My name is Daniel Vu. I normally go by Daniel or Dan. I am a super senior in BFA Art program with a concentration in ETB (Electronic and Time Based work). I would say for the most part I do 3D modeling with a bit of branching into many other fields in art from course work. I enjoy playing games, and making them as part of CMU’s Game Creation Society is another thing that I like doing.

In regards to this class, I don’t actually have that much confidence in my programming ability, but I will give it my best. I have some minor experience here and there mainly from classes– so I am familiar with digital art, using code as an art form, and several of the topics in the course. I hope to improve my skills and make something really cool at the end of the semester. As far as what I want from this class, I think I would like to see more interesting interactive work, Kinect or other computer vision stuff, and video game related projects.

A tiny prototype information visualization project I did for another class called Environmental Hackfest is this thing I call ‘The Top Ten’ written in Processing.

The Top Ten

What it is, is a basic interactive visualization of the top ten countries that produce the most CO2 emissions. The user can click on one of the implemented countries that is highlighted when moused over and additional information and charts will be presented.


I haven’t used them yet but:
Twitter: @flock_of_sheep
GitHub: SheepWolf


Shan Huang

16 Jan 2014

Hello world!

I am Shan, a senior in Computer Science and Human Computer Interaction. I am a programmer who also happens to draw and paint. Exploring the intersection of Computer Science and Art has always been a great enjoyment to me. Honestly speaking my interests in both fields originated from playing video games (and I know I’m not alone in this haha). There were so many epic moments in games that made me think “Ahhh, I wish I could make this”. I started by attempting implementing character control via keyboard in middle school, and this eventually led me to systematically study CS as a CS major while keeping sketching and painting. Of course I know both CS and Art are so much more than game developing, but it’s game that brought me here.

Nowadays I like to make cool stuff in my free time, game related or not. This includes coding cool looking things like particle systems and simulations, tools for procedurally generating cityscapes with night illuminations, tools for generating animated impressionism paintings from photos, and adding touchpad control to unexpected things (for example robotic arms). Here is a project from last semester that I especially like. It is a hackathon project called Super Duper Mario:

The project is basically an augmented reality version of Super Mario. It is an Android phone game implemented with Android SDK, pretty standard stuff. In this game we turned the real world into our game world by running edge detection on camera input and using the edges as platforms for Mario to jump on. The idea was simple, but we had a lot of fun implementing edge-based platform generation and combating noise from the real world.

The motivation of this project was to escape from level design. Because my level design skill is kind of horrible, I tend to work around level designs by building levels from existing matters (like maps, photos, large data sets). Super Duper Mario follows the same rationale. However, it doesn’t mean the game excludes level design. To the contrary if you are interested in creating your own level, it’s as simply as drawing down your level on a piece of paper and point your camera at it. This is a cool aspect of the game that the video doesn’t demonstrate ;) You can even form levels with your body, or your friend’s body (in which case it would become a cooperative game in which the other player “holds” Mario for you). There are a lot of exciting things you can potentially do with the game mechanism, and I wish to revisit this concept some time in the future to further polish it.

Links

github: http://github.com/yemount

twitter: http://twitter.com/yemount

Austin McCasland

15 Jan 2014

Hey there, my name is Austin McCasland, and I am a current student in the Master of Human Computer Interaction at the HCII.  My background is mostly in interactive sculptural work.  I am currently very, though not exclusively, interested in bringing media out of the screen and into the real world.  I am hoping that this class will strengthen my portfolio with some beautiful data visualizations, and interesting experiments in unusual ways of representing that data.  I am hoping that I can leverage the expertise of the people in the class, and learn enough to where I can confidently approach data visualizations of all shapes and sizes.

Twitter

GitHub


Sound Room is a CV piece which uses an IP webcam mounted on a beam in the roof of a hangar to track the locations of movement in the room and play sounds which vary in shape and tone depending on where within the exhibit the movement is. In the video you can also see a few of my other pieces – though these are all are part software, part sculpture. Everything in this show was made from recycled computers and components. I think that the piece was very successful – the goal of it was to create an presence which was impossible to ignore in the room as you explored the other pieces in the show; it was meant to infect the perception of the entire space and the pieces within it in an uncomfortable way. The intent of the show was to create undesirable interactions with computers using each of the three sculptures, and the irritating sound that the viewers themselves were responsible for made their experience of the show that much more grating. I think that this piece fell short in an over saturation of tones. It was supposed to feel like every time you moved you created more/new sounds, but when a bunch of people got into the space it just sounded like a screaming banshee and an individual’s movement didn’t affect the overall sound in a noticeable way.

Brandon Taylor

15 Jan 2014

Hello.

I’m Brandon, a second year phd student in HCI.  I studied film and electrical engineering at the University of Texas at Austin as an undergrad and have a master’s from the MIT Media Lab.  Before coming to CMU I worked at Samsung in Korea for a few years.

Most of my work has been focused towards the hardware end of things (custom sensors, hardware design, gesture recognition) but there is usually a software side (even if it’s just try and see why the hardware isn’t working right).  At Samsung I worked on gesture recognition for the TV platform.  Samsung is not big on openness so I don’t have much to show from my work there.

For my master’s thesis, I developed a grasp-recognition system called Graspables. It used custom capacitive sensor arrays to detect how someone holds an object and use that as a means of interaction.  I was going to talk about this project, but it’s not really representative of what I am hoping to do in this course.  Instead I’ll post about the Ionosphere.

When I was an undergrad, I got a internship at the Applied Research Laboratories working with scientists who studied and modeled the Ionosphere.  I had no particular interest in high atmosphere physics, but I needed money and a things to put on a resume, so study the Ionosphere I did.

Ultimately, the goal was to produce models of the Ionosphere which would work like weather prediction models to correct GPS errors introduced when the signals passed through the Ionosphere.  To this end, I was tasked with cleaning up satellite data sets and running various analyses on them.  These data sets consisted of hundreds of millions of data points collected continuously by several satellites over a span of years.

Using a terrible combination of fortran, perl scripts, matlab and C code, I spent the next 2+ years trying to detect events that were of interest to the Ionospheric science community.  A sudden increase in electron density (see below) during a satellite’s pass could indicate a weather event worth studying.SAPevent

A Segment of Electron Density Measurement by Satellite Latitude

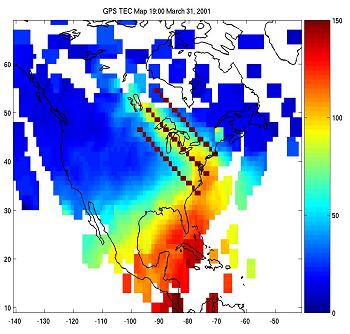
As I worked, the plots I developed became more complex.  Events could be better visualized and explained.  The map below was automatically generated by an algorithm searching decades of data for narrow bands of elevated electron density associated with storms.
Plume

Detection of a Storm Enhanced Density Plume

Ultimately, I graduated from UT and moved on, but whenever the subject of big data or visualizations come up, I’m reminded of my brief tenure in Ionospheric science.  The problem that was holding back understanding of the Ionosphere wasn’t a physics problem, it was a problem of finding the relevant data.

Ever since then, I’ve been particularly interested in trying to apply techniques across fields.  I’m hoping that this course will give me the chance to explore new things that may turn out to be useful in some unexpected way down the road.

 twitter – @brttaylor

github – bttaylor

Paul Peng

15 Jan 2014

My name is Paul Peng and I am a sophomore in the Fine Arts program at Carnegie Mellon University. Next year I plan on being a junior in the Computer Science and Arts program at Carnegie Mellon University. I like to draw and program things. For this class I plan to draw and program things.

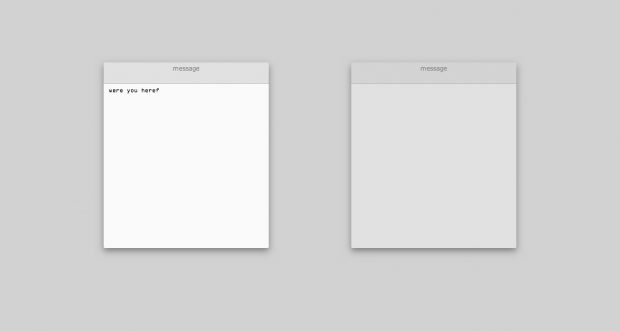
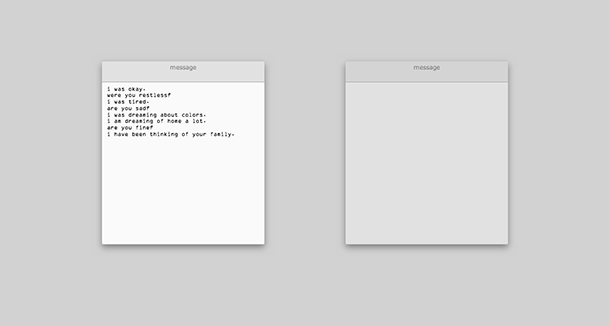
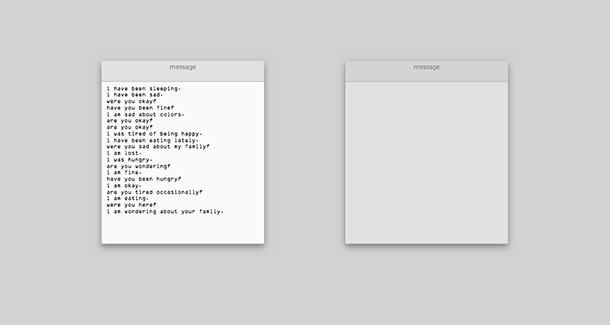
Last semester I made a depressing chatterbot for one of my studio classes. It prints out vaguely melancholy statements in its chat window every 3-8 seconds. To the right is another chat window for the viewer to respond to the bot, but this chat window is greyed out, leaving the chatterbot to endlessly talk alone, unsure of whether there is anyone who cares or is listening at all. It doesn’t actually feel these things because it is a chatterbot.

Screen Shot 2014-01-15 at 9.16.07 PM

Screen Shot 2014-01-15 at 9.15.06 PM

Screen Shot 2014-01-15 at 9.14.14 PM

I didn’t use any toolkits for generative text / literature for this, which I should have because coding this would have been much less annoying and it would have allowed me to create a greater variety of sentence structures for the chatterbot to spit out. It’s still pretty nice, though.

twit git

Andrew Russell

15 Jan 2014

Welcome to my post.

I am a masters in music and technology student, which is a half music, half CS, and half ECE degree. As such, I am very interested in computers, both hardware and software, as well as music. I started programming over ten years ago and cannot even remember when I played my first song. I also compose my own music and like to tinker with guitar pedals.

My interests don’t stop with music and computers though.  I love to play sports (doesn’t matter which sport), craft beers (the hoppier the better!), and gaming (of both the video and the board variety).

Second Screen

All engineering students at the University of Waterloo are required to complete an upper year design project during their last year and a half at school with a group of three to five members.  This project is supposed to be an actual product which the students could theoretically start a company around after they graduate (and quite a number do).  My team worked on Second Screen.

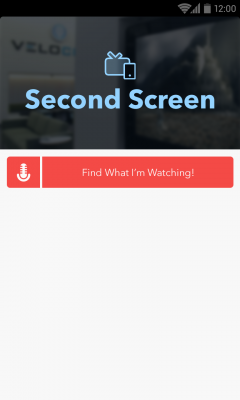
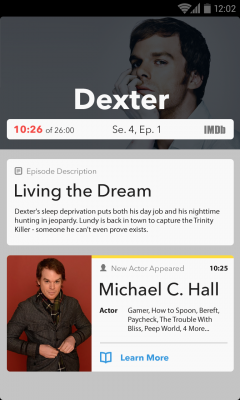
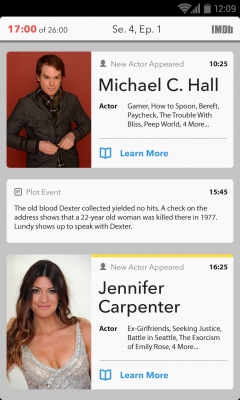
Second Screen is a TV buddy application, design to enhance your experience watching TV shows.  Upon opening, it will listen through your phone’s microphone for up to 30 seconds and, using acoustic fingerprinting, figure out what TV show and what episode you are currently watching as well as the current time in the show you are at.  It will then display information in real time as the show goes on, such as relevant plot points, show trivia, first appearances by actors, and friend’s comments. There is also a list of dialogue shown as it is spoken.

SS - 1 SS - 2SS - 3
Second Screen Workflow

Github:
https://github.com/TeamFauna/dumbo
Teammates:
Andrew Munn, Fravic Fernando, Noah Sugarman, Will Hughes

Links

Website:
ajrussell.ca (redesign coming soon)
Youtube:
https://www.youtube.com/user/DeadHeadRussell
Github:
https://github.com/deadheadrussell
My latest video:

Haris Usmani

15 Jan 2014

Hi everybody! I’m a first year grad student in the Music & Technology program at Carnegie Mellon University. I did my undergrad in Electrical Engineering from LUMS, Pakistan. Most of my previous work has been hardware intensive, although I have experience of using MAX along with a few scripting languages. Being part of various underground bands in the past, I also consider myself as a musician. At CMU, I’m part of the A Cappella group Deewane. From this course, I’d like to take away how to put together today’s technology to make something that impacts people- along side, I’m excited to explore computer-driven visualization and the truth it uncovers. My previous works can be looked at my website http://harisusmani.com

Twitter: @uzmani90

GitHub: https://github.com/harisusmani


Suspended Motion (Fall 2013)

Suspended Motion is an arts-engineering project based on a Philosophical Theme revolving around Scientism. I came up with the idea, wrote/did the narration and made the first prototype. Then we incorporated an eight channel setup to enhance the experience further along with a re-worked audio.

Course Project for Advanced SIS: Hybrid Instrument Building (Prof. Ali Momeni, Fall 2013)

Suspended Motion is a setup that tends to make the user believe that he/she is in a state of motion on a spinning chair, while in fact for most part of the experience the user remains stationary. It is based on a Philosophical Theme revolving around Scientism.


More Details

Today, we all live in the Age of Science and we embrace everything that science brings with it. Just look around and you will find that we are surrounded by technology that was just science fiction some decades ago- but this sometimes tends to make us believe that Science is the most authoritative worldview: it has all the answers to our questions and it alone can explain the true inner working of the universe- only science can answer how the universe came about, how we evolved or what our purpose in this world is. Suspended Motion gives a different perspective on the topic.

Suspended Motion II (Group Work) consists of a rotating-chair and an eight speaker array below which the user sits. The user is instructed to close his eyes and to observe how the sound field exactly matches his current position. This is done by angular position data sent to the laptop via OSC from an iPhone’s Compass attached to the chair. After about 40 seconds, the chair is let go to set off in a decelerating rotation. The user focuses on the sound, and experiences Suspended Motion for the last 25 seconds of his spin.

(Disclaimer: Lock Howl-Storm Corrosion from the 2012 release “Storm Corrosion” is the copyrighted property of its owner(s).)

Kevan Loney

15 Jan 2014

Howdy y’all!

My name is Kevan Loney. As an introduction, I’ll give you folks a little background on who I am and where I came from. I’m a MFA Video & Media Design Candidate 16′ within the School of Drama. I little while ago, I graduated with a B.S. in Visualization from Texas A&M University (TAMU). The Visualization program is a fairly new program under the College of Architecture at TAMU. This program exposes it’s students to a broad range of topics such as art, animation, graphic design, and interactive visual programming. At the end of the program you can begin to chose the track of topic you want. I fell somewhere between interactive art and animation. During my education at TAMU I began to have withdraw syndrome from my other love in life, theatre. So I began to gear most of my projects at the university to be performance based or inspired. The summer before I graduated I got my animation accepted to be presented at the SIGGRAPH “Dailies!” 2012. During of which I ran into several Carnegie Mellon students who found out that I was interested in theatre and tech. They told me about the brand new VMD program at the School of Drama, and I knew right then it was to be the next step in my journey!

One semester down and the second one is just beginning! All I can say is that it has been the best decision of my life. I could not be happier to be at this school learning from/with some of the brightest/creative people around. I look forward to getting to know everyone in this class and getting my feet wet in the life of coding. I’ve had some coding in the past but recently have been focusing on platforms such as Touch Designer and Max/MSP/Jitter. So returning to pure coding after after a year or so shall be an interesting task that I’m excited to take and see what comes of it. I hoping this class will allow me to make more customized interactivity for the stage and live performances to enhance how the viewer experiences live entertainment.

Below is a bit of my work.

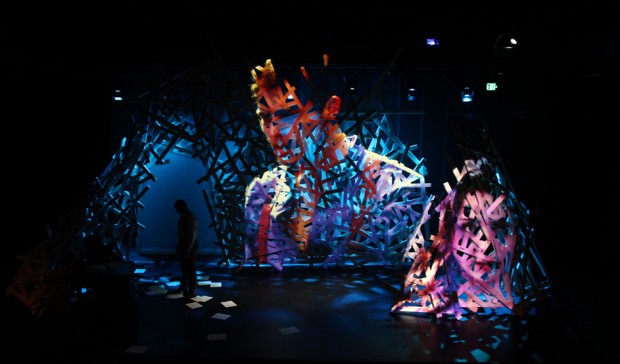
This was my first full production called THE NINA VARIATIONS! It just recently wrapped up in November! In this show, 90 percent of the visuals were live generated through Touch Designer and outputted through Millumin. We had embedded live cameras in the set on stage along with cameras backstage in a make-shift live film shoot within a small hallway behind the theatre. These were being live outputted/manipulated through TD on a PC and sent to a separate Mac Pro to send out projections for mapping and masking along the set. In addition, preview monitors were put backstage so that the actors could reposition themselves with the set. It was quite the task, and a crazy first production, but I loved every minute of it!

Loney_NinaVariations_WebEdit

This is my Demo Reel with short segments of my work at Texas A&M before coming to CMU. I think it may be time to update soon. ;)


Some handy links:

https://twitter.com/kdloney

https://vimeo.com/kevanloney

https://github.com/kdloney

www.KevanLoney.com


Cheers,

Kevan


Kevyn McPhail

15 Jan 2014

Hello, My Name is Kevyn McPhail.

I am a 4th year architecture student at Carnegie Mellon. I am a huge fabrication buff. I love the process of machining and crafting objects. In addition to using machines, I love making and understanding machines and their processes. I am excited for this class, because I see it as a gateway to create and/or manipulate machines to do my bidding. Just Kidding, but the software aspect of this class will allow me to understand fabrication and machines on a deeper level.

Twitter: @studiobfirm

GitHub: https://github.com/kevyn5902

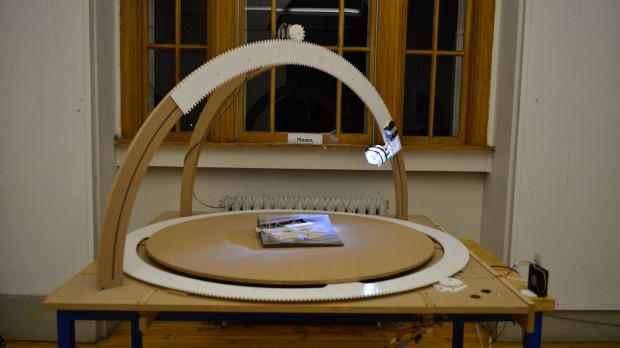
Speaking of Machines, Here is one I made with two of my friends last year.

DSC_0748

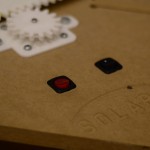
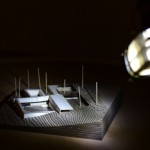
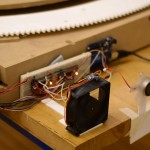
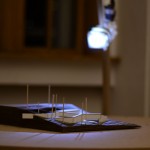
Its called the Solarc. Its a sun simulation table. Basically its and automated turntable and movable light source that cast shadows on a students architectural model to influence their design by  giving them a real world understanding of the effects of the sun on their building. In addition to help with designing and fabricating the table, I coded up the software for it. Since I was in a class that forced me to use python, all the “heavy” computing is done using python, which sends signals via serial to the arduino telling the motors how to move.

Here’s a video!

Hi! I am Yingri Guan, a first year candidate from the MTID (Master of Tangible Interaction Design) . With background in graphic design and mathematics, I love to visualize our daily life phenomenon through mathematical theories and equations.

I hope to sharpen my programming skills and experiment with new ways to visualize massive data sets and develop a new perspective on understanding phenomenon around us.

My portfolio website yingriguan.com and I will be using twitter and Github too.

Work

One of my work is “Ice Core”.

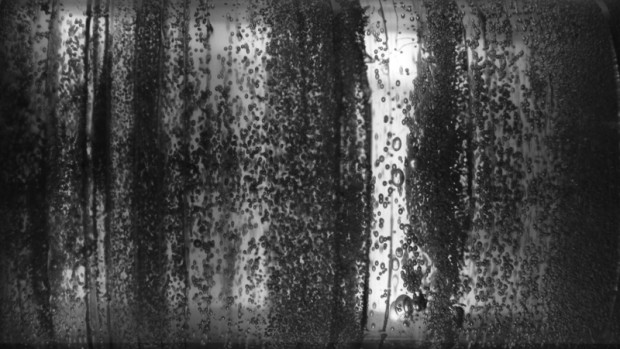
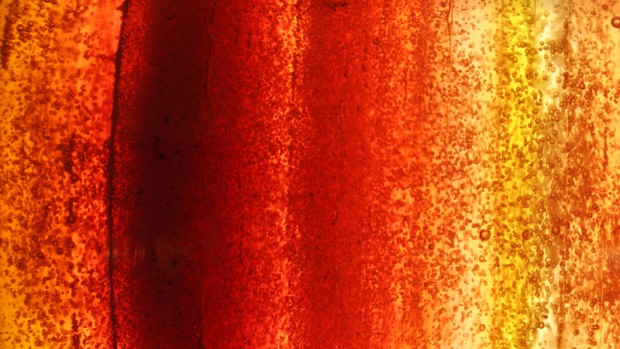
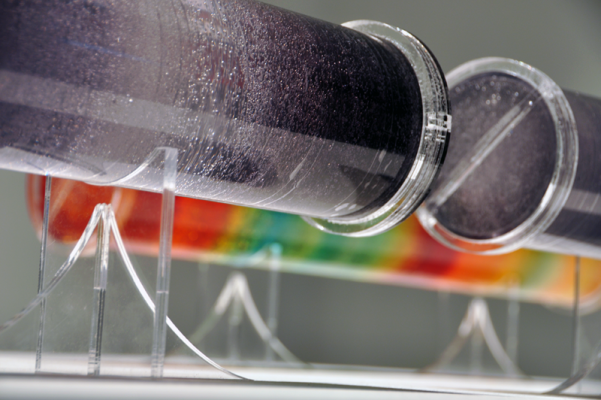
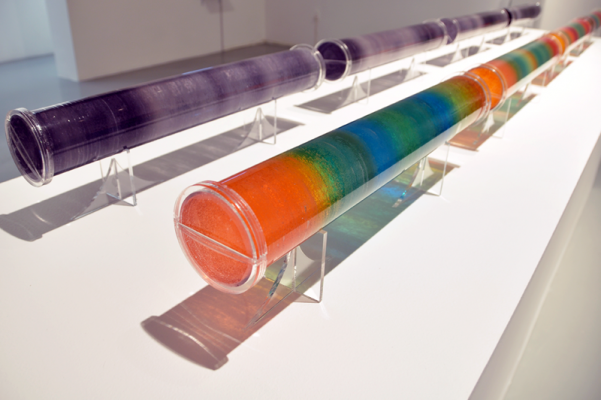
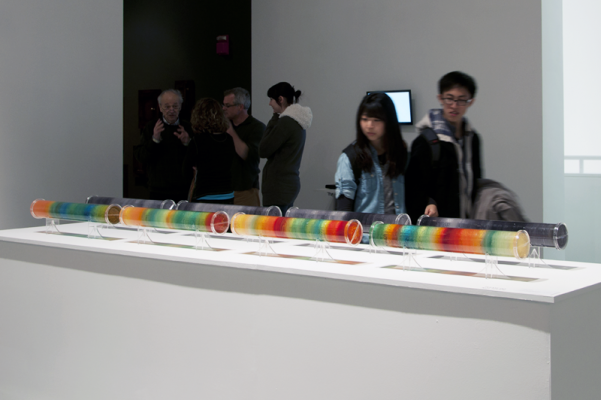
“Ice Core” brings together the aesthetics of layers of ice with the immense amount of weather information core samples contain. It features eight acrylic tubes filled with layered gel wax, with each layer denoting the average data contained within eight thousand year sample. The gray scale tubes indicate the different carbon dioxide levels in the ice core layers.The darker the layer of wax, the more carbon dioxide that was produced during a particular thousand years.The colored tubes demonstrate temperatures variation by using the colors associated with a standard weather map. For example, red denotes the highest temperature and blue indicates the lowest temperature.These tubes, shown side by side, provide an insightful comparison between carbon dioxide level in relationship to global temperature changes during the last four hundred thousand years.

IceCoreCloseUp2

IceCoreCloseUp1

IceCoreDetail4

IceCoreDetail1

IceCoreInstallationView