Category Archives: 24-infovizsketch

mileshiroo

03 Mar 2015

Art e-fact is a visualization of memory artefacts that exists as a layer above other windows.

One can cause artefacts to appear/disappear/change by dragging and resizing windows, and by playing videos and loading images. There are many ways to create artefacts that I have not yet tried.

This project relates to my interest in glitch aesthetics, and an experiment I did last winter regarding screenshots of screenshots. This piece came about by accident. A version of it can be recreated in three lines of code. I am very into the technical simplicity of the project, in spite of its visual richness. In the future, I’d like to create artefact layers as shapes.

Art e-fact provides insight into the operations that go on “behind the scenes” every time the computer performs a graphical operation. Playing with Art e-fact, one might realize that computers have an alien sense of visuality from a human perspective.

Amy Friedman

28 Feb 2015

Currently the market for wearables has increased a significant amount. Many times these wearable fitness products are focused on “activity” based on data from an accelerometer, but how much does this really contribute to helping understand a persons health. Below is a map I created of the current wearable technology market based on data gather from Vandrico Inc Wearable Tech Market Database. It shows the primary applications of the wearables, connectivity, features and work benefits

Screen Shot 2015-02-23 at 2.33.47 PMThere are many opportunities to diagnose information from the sensors utilized. I want to create a visualization which touches upon the potential of wearables to diagnose information about a user when different sensors are combined and patterns are found. Different combinations infer different potential diagnosis. The limitations I have is that I dont know every medical condition that exists therefore I would have trouble creating this.


maddy

16 Feb 2015

I originally had .gifs taken from blingee.com, which would’ve proven to be a COMPLETELY hilarious gif decorator visualization of some sort, but I don’t really give a shit about that anymore.

I recently found out a good friend of mine passed away. We only knew each other through the internet, and our friendship was primarily conducted over mediums like forums, IRC and skype chats. A few years ago, he archived 13 iterations of the skype group we were in, totaling to thousands of messages between more than 20 different users (who ranged from normal members to bots to Chinese autoglass salesmen). As part of a larger archival project of his work, I’m going to clean up the data he saved and create an interactive visualization of the lifetime of the group.

Screen Shot 2015-02-16 at 10.17.02 AM

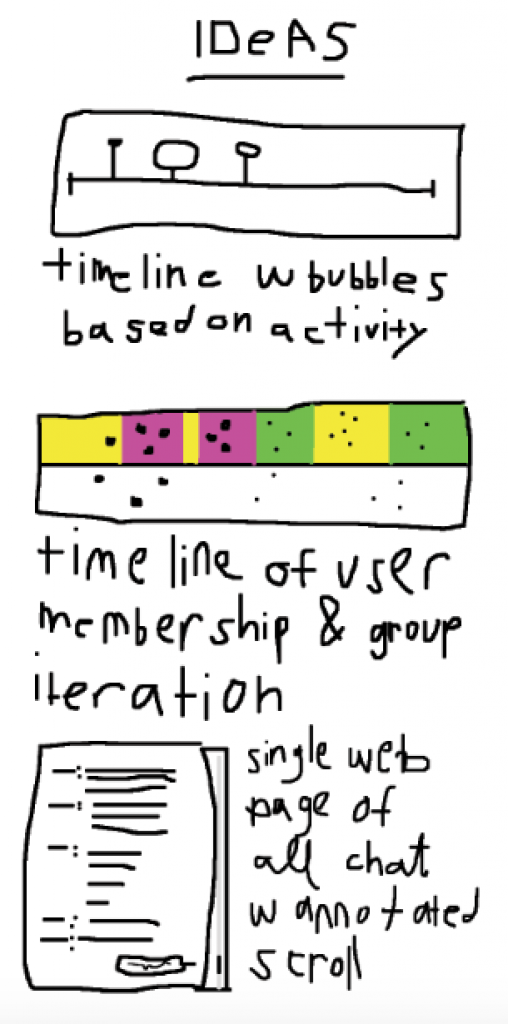
Internet relationships are weird. Your social interactions create concrete artifacts that you can collect and save. If you really wanted to, you could literally quantify your friendship with someone online through the exchange of written word and images (and, in the age of Web 2.0, voice and video call lengths). Everything is timestamped and prepackaged for you, if I wanted to I could literally recreate our conversations, with the exact same timing that was used in the original chat.

I guess it’s kind of serendipitous that we bonded over a comic that was about internet friends playing a video game together, and that the only form of dialog in the comic is the medium of the chatlog. Chat archival has always been popular, with funny/memorable snippets from IRC chats archived by sites like bash.org.

There’s a large dialogue regarding data collection by massive corporations, but I don’t see nearly as big of discussion about peer collection. Our digital bodies are increasingly becoming just another facet of our physical bodies, with mediums like Facebook and Instagram simply extending our irl relationships. But there will always be instances where that relationship is flipped–where our physical bodies become extensions of our digital ones, and our primary mode of interaction is through platforms like forums & chats.

Ron

13 Feb 2015

I scraped the transcripts to the comic strips from Dilbert over the last 25 years. Initially, the idea was to look at what the most popular topics were over the years, examining and illustrating how often certain words came up in conversation, or when certain words were first mentioned (“google”, “unfriend”, “tweet”, etc.)  in the comic. But determining what words were deemed too common or uninteresting and filtering out these words was a challenge. The other challenge is that the transcripts do not use a consistent method at identifying the speaker of the dialogue, nor does it specify which dialogue belongs to what comic strip panel. One option is to use some type of OCR software to examine the strip’s images and recognize and separate the dialogue by panel. Then a computationally generated strip of disjoint panels could be assembled by topic or keyword. I’m not sure if this will still work, so I may have to change the source of my data for the visualization.

For random strips, Cyanide and Happiness is a webcomic that has an option to generate random panels. This results in comic strips that are often non-sensical and uninteresting, but sometimes, it produces dialogue that, put together across panels, are quite funny. The Random Garfield Generator is a similar concept for the long-running Garfield comic strip, but allows the user to fix one panel while the others change. I’ve not yet seen a similar concept for Dilbert, but my “visualization”, if still deemed viable, would be to implement something similar. My only thought is that the generated panels may only be interesting at rare instances.

Some sketches below capture the randomly-generated panel or the keyword plot during the comic’s yearly history.


sejalpopat

10 Feb 2015

I’ve changed my data for the visualization project to something a bit less esoteric and more related to me. I had already been in the process of organizing my old email account and decided to use this as a source of data for understanding different changes in my thought process/behaviors/social interactions. Because my email account served as a source for so many different media (a personal journal, place to dump academic ideas, favorite songs and personal memories, place to get updates about friends on social media and also chat with them) I think it has the potential to have a lot of interesting information (from my perspective).

I thought about a couple different features that I’d like to have available when browsing this data. For one, I want to see the concentration of different email-journal messages and the amount of times I replied to these (I used replying to messages as a way of responding/reflecting on things I had thought earlier, it seemed like a good way to organize thoughts). I also want to be able to filter based on words and compare the frequency over time of different words; for example while I was looking through the data I noticed the tendency toward mentioning first person pronouns, as opposed to references to others, was really strong in the beginning of this account. So far I’ve been mostly focusing on top phrases/groups of words but there are plenty of other possibilities.