Category Archives: LO-7

Yeliz Karadayi

21 Mar 2015

“Forced Fingers” by Saurabh Datta. 2014

Very neat. This girl records your finger’s movements and then plays it back to your fingers, forcing you to repeat the actions. Could you have multiple of these communicating so one person’s movements control many? Can this apply to villainous warfare? The possiblities…! Anyway, it makes me think about the possibility of recording my own project’s movements of the 3d pen so that perhaps if you liked the way a particular part of the model was fabricated you can copy it over an identical path that it takes you on. HMM.

More

“GeoMagic Touch” by Geomagic

And I have found my tool for force-feedback. Perfect! This thing is relatively accurate for what I need, and allows for some degree of freedom so that the user still has the ultimate control. It’s incredibly expensive though but I think I have a way around that….:)

What’s especially great about this product, after speaking with the sales rep there, is that they offer the SDK to make your own software and I would have all control over the interaction with this thing.

More

JohnMars—LookingOutwards—7

CyFi Lab from Sonos & We Are Matik

Explained: Installation at Re/Code Code Conference 2014 exploring cymatic patterns.

Chosen: I’ve done some work with Cymatics in the past, and this was one of the more interesting implementations I’ve seen.

Critiqued: I appreciate that this is an installation that everyone can visit, although cymatics can get pretty boring after a while. I wish there was more documentation of the installation. Well-done cymatics depend on precision — something that’s hard to achieve and maintain in a highly public, temporary installation.

Related: A fairly popular video has been making the rounds in the past few months from Nigel Stanford that features cymatics among other physical sound visualization techniques.

TW3RK-BOT 1.0 from Basement Jaxx

Explained: “Without dance there is no love. Without love there is no passion. Without passion there are no humans. 72% have stopped partaking in the art of dancing. And in 15 years, 98% of us will cease to dance”, ergo, TW3RK-BOT 1.0., the robot that will stimulate the world to dance again.

Chosen: Odd. Musical. Dance-y. Robotic.

Critiqued: Weird. Music video, not real proposal.

Related: The music video pokes fun at contemporary robots, namely Nobuhiro Takahashi’s SHIRI Robot Butt and the Miraikan humanoid robots.

Alex Sciuto

17 Mar 2015

propublica-538

Two recent projects that have come across my Twitter feed are 538’s airport visualization and Propublica’s Health Data Breach visualization. I like them because they are both very competently executed, but they approach user interaction in different ways. During the previous critique, Chris Harrison mentioned about my project that it had “a patina of interactivity” as opposed to rich interactivity. The Propublica graph could have the same the critique leveled at it, while the Airport visualization is much richer. There are strengths to both strategies.

Which Flight Will Get You There Fastest?

538 presents a map with US airports as nodes. The map initially contains no data beyond the airport locations. The user can hover over an airport and see which other airports have more efficient routes. Clicking on a second airport isolates the connection and displays additional information. As the user clicks through the progression, cards stack next to the map showing the user’s state.

The primary pleasure of the experience is hovering over different airports, seeing the routes light up and seeing which airports contain mostly green or mostly red airports. The least successful parts are the zoom-in information screens. The detailed information graph is difficult to read, and requires moving your eyes away from the screen.

Going back to the quality of the interactivity, The 538 map offers no information unless interacted with. That’s great for people like me who are looking at this data and curious about the vis’s construction, but to someone on smart phone or someone without much interest, the amount of work to get to insight is too high.

Over 1,100 Health Data Breaches, but Few Fines

I like ProPublica’s visualization of health data breaches because it works well without any interactivity at all. In addition, the non-interactive initial layout entices the viewer to interact and learn more information highlighting outliers with actual numbers. The filter and zoom interactivity that is front and center for 538 is secondary for Propublica. The user most likely only filters by state and company if they have a specific question about the data.

Deeper interactivity is non-existent. Deeper meaning more than filter and hover.

I think both strategies for interactivity are needed for a successful data visualization. The vis needs to entice the user for interaction, then deliver on that enticement.


Amy Friedman

16 Mar 2015

Psychogeographies

An installation created by Dustin Yellin and commissioned by the New York City Ballet to create 3d-esque figures of dancers using glass layers and cut out pieces of books, magazines, trash, etc.. Its about the weather and the way it impacts the human body, our blood and bones are affected by the surrounding environment. He jokes and claims that he makes “window pane sandwiches”, they are made of 3000 pound microscope slides. He also says that bone marrow can tell a story and this is the way of visualizing that experience. I feel this piece is an interesting visualization, and very calculated as they need to design each layer of glass, but you cant determine exactly how it will come out due to the random assortment of media they use to create color. I wonder how it looks from the back side of the sculptures and if they consider the mood looking from the opposite perspective (in the video only the front seems to be highlighted). This may not be programed, but the visualization tells a powerful story I wish his process of how he chose each one was explained better. I appreciate the reinterpretation of the memory of a body frozen in glass. It is emotional, but also has a view think about how their body feels throughout the day based on weather and changes.

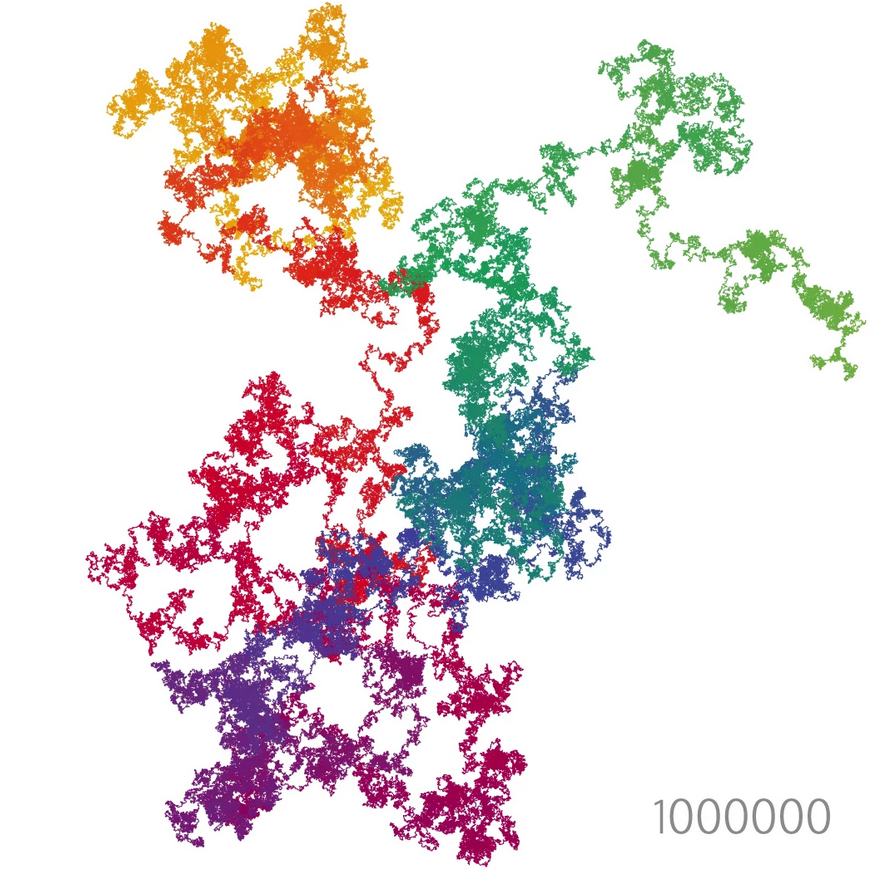
A million digits of pi visualized

Screen Shot 2015-03-16 at 11.48.01 PM

This is a data visualization of 1 millions digits of pi. The colors scale from the first number of pi until the 1 millionth number, below is the color key to understand beginning and end of the sequence. This visualization was created by an astronomer named Nadieh Bremer.

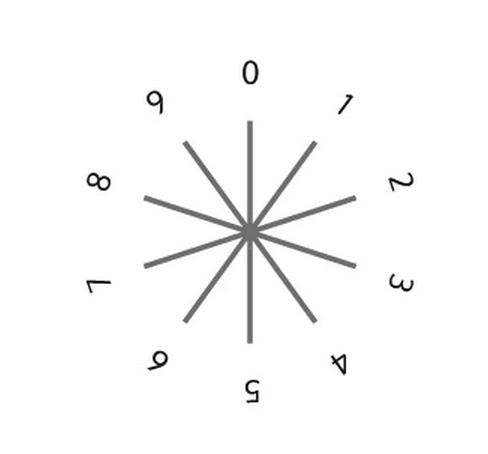
Screen Shot 2015-03-16 at 11.49.54 PMThe direction of the line indicates the current number of pi, and steps to then create the next line determined by the number in pi.  See below.

Screen Shot 2015-03-16 at 11.50.01 PM

This visualization isnt an original idea, but inspired by the 1888 book “The Logic of Chance” by John Venn a mathematician. In this book his suggested the first “walk” of pi as the numbers 0-7 represent the 8 different directions on the compass. Other works which integrate pi include those by Martin Krywinski and Cristian Vasile. Visualizations are meant to show information in a new means, or medium. I feel that this is an interesting way to see what pi represents and how much 1 million digits represents outside a list of numbers. Its hard to tell what each number is and itd be nice if you could zoom in, or highlight each piece to what they are. Even allowing a video of the image as it forms a tree like formation. The description doesn’t make it clear of how the program truly jumps from one the the next number and how they could cluster the way they do.


Bryce Summers

16 Mar 2015

Artistic Model Train Layout

This model train layout that I found on YouTube has so much order that it excites me. The layout consists of a huge spiral with an entrance in the middle and an exit on the outside. On the track, travels a ridiculously long train with a regular pattern of cars and engines. The shear length of the train causes me to be impressed that no derailments occur. I consider this a work of interactive or at least moving art, because the train is ever moving and creates a circling field of geometry shapes that has a lovely texture as the train circles by. The repetition and logic of it all appeals the orderly side of myself.

As for improvements, it might have been better if the video could have been from a top down perspective instead of a gaze from the side, because then the 2D shapes of the cars would be more apparent. I also think that the lighting for the scene could have been better, the authors could have done more to create specular reflections at special angles through the material properties of the cars and the angles of the light sources. I believe the author was just having fun creating a train layout and was not attempting to make art, so it is not surprising that the work seems to lack dramatic considerations.

Sim Tower, Yoot Tower

I was referred to another great game involving elevator management last week. I found out that their were entire games based on towers and elevators made in the past including SimTower and Yoot Tower. These games are the kind that I would have been proud to have made.  Yoot Tower incorporates many features that I have thought of including allowing elevators permissions for certain floors, setting the resting floor for certain elevators, and controlling the amount of elevators that are built. I found the visual layout to be very helpful, because it provides many ideas for ways in which to present multiple elevators, floors, the underground, etc.

https://en.wikipedia.org/wiki/SimTower

http://strategywiki.org/wiki/Yoot_Tower