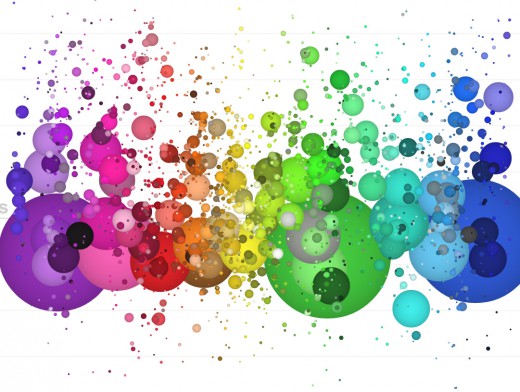
His and Hers Colors

This visualization by Stephen Von Worley illustrates what names men and women use to describe a particular hue. Each dot represents 2,000 of the most frequently-used color names, sourced by a 5,000,000+ sample from a color survey by XKCD. Color names used by women are in the top half, men in the bottom half. Not only is data showing how the genders perceive color interesting, the results themselves are beautiful. One aspect of the responders that wasn’t evident from the survey was their cultural background, which can affect their perception of color. Indeed, this visualization by Muyueh Lee shows the difference between how the English language and Chinese language describes colors — there are far more English names for colors than Chinese ones.
Humanity’s Cultural History
As a son of immigrant parents, I find the migration patterns of people interesting, often wondering why they migrate to a particular area over another. This visualization was created by Maximilian Schich and others from The University of Texas; they took data from the Freebase and charted the places of birth and deaths over several centuries. Places where a high concentration of people died provide fascinating insights into the cultural city centers that drew them there. Schich’s team also looked at these results in the context of phrases used in literature at a given time (via Google Ngram Viewer) to infer population and depopulation trends of a key city. This data isn’t as complete as it could be, however. Freebase is a Google-owned catalog of well-known places and people, but there is bias in this source data towards the U.S. and Europe, so the results aren’t globally representative.