I’m planning to create a quantified selfie of facebook.
Few similar projects found :
1. “themail” by Fernanda Viégas
themail is data visualization of a person’s email exchanges. Every column corresponds to email exchange with one person, the words on column show keywords used in the conversation. Interesting fact about this visualization is that you can see the evolving relationship with an individual over time.
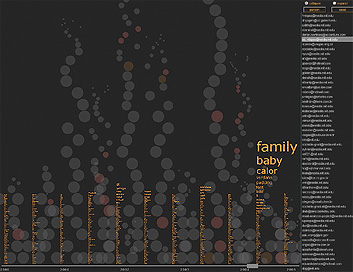
more.
2.Found an interesting article on visualizing facebook friendships Vs geeographic locations. The generated map uses data of 500 million people.
“Visualizing data is like photography. Instead of starting with a blank canvas, you manipulate the lens used to present the data from a certain angle.” ~ Paul Butler.
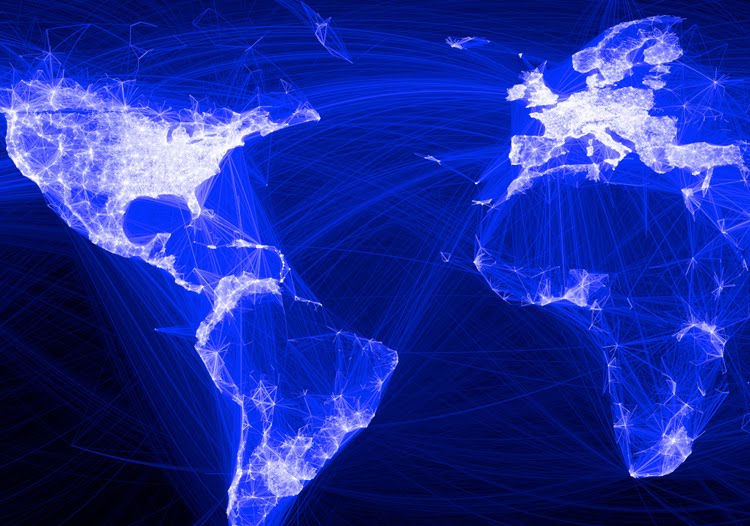
More information.
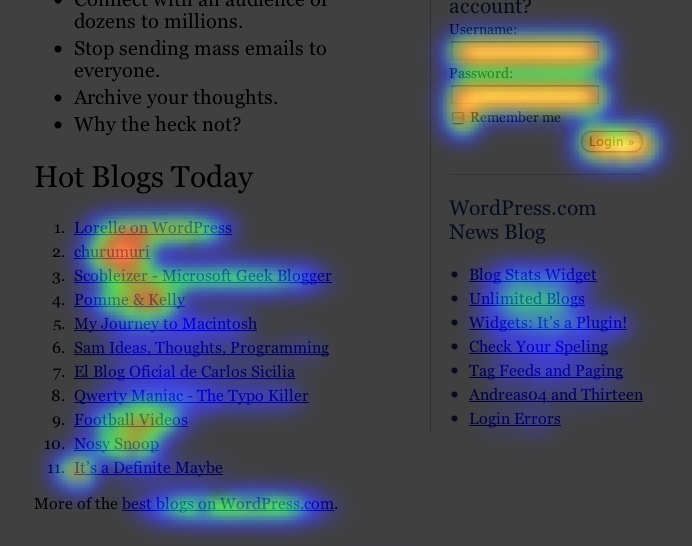
3. Crazyegg does heat visualization of websites. Based on number of clicks for various facebook tabs, a heat map can be created for an individual.
4. Found many great examples from last year’s blog. here.
Sketches for visualization
My visualisation is going to be a city based in medieval time. I believe facebook can be imagined as digital landscape where we all have our identities and spaces. We visit and get insight into other’s spaces on internet. Just like our own house, there is a limit till which point we allow others to see our lives. I plan to create a city scape based on facebook data.
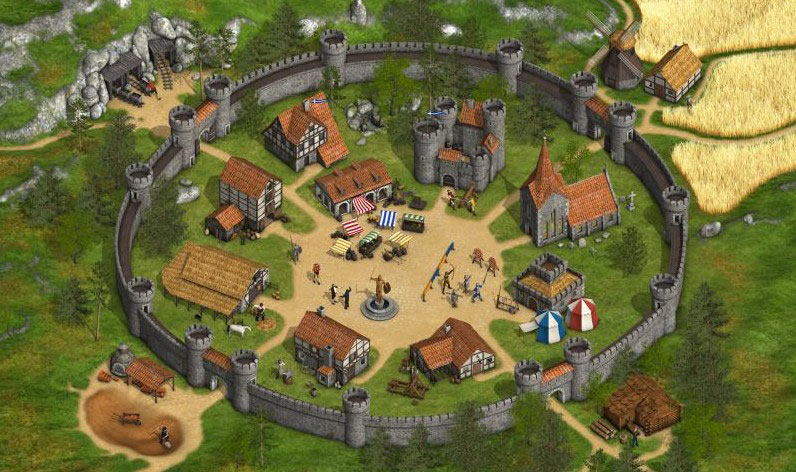
Every person will have their own castle at the center of the city. Houses around the castle will be from your friends. The vicinity to castle will depend on number of likes and shares from that particular friend. House of a friend will be upgraded depending on the the frequency of communication.