Project 3 : Webcam Paint

by mghods @ 9:22 pm 14 May 2010

Introduction

Webcam Paint is a program developed using openFrameworks in Code::Blocks for windows. It enables user to paint using a webcam through a simple color detecting algorithm.

How it works?

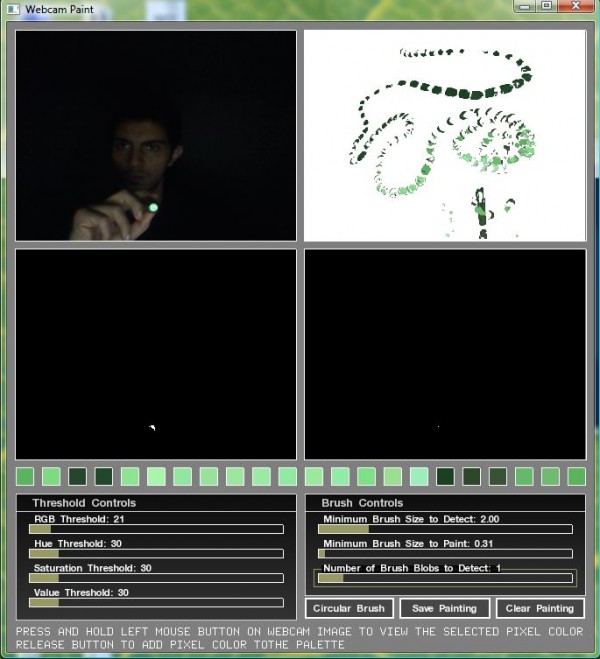
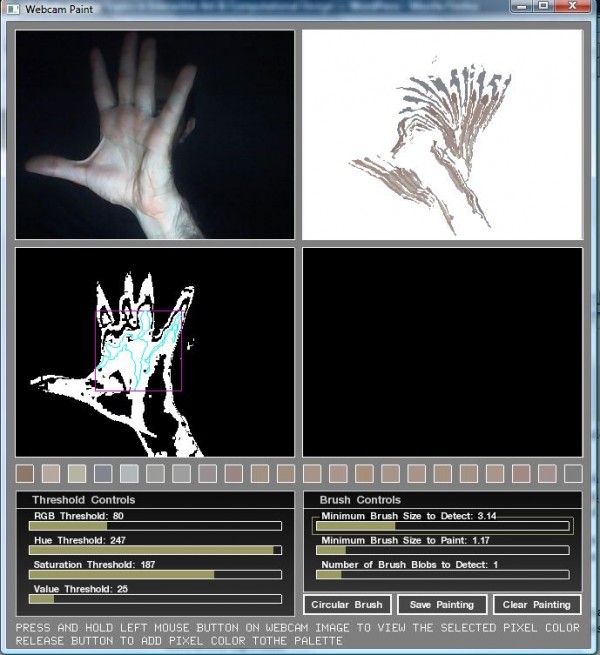
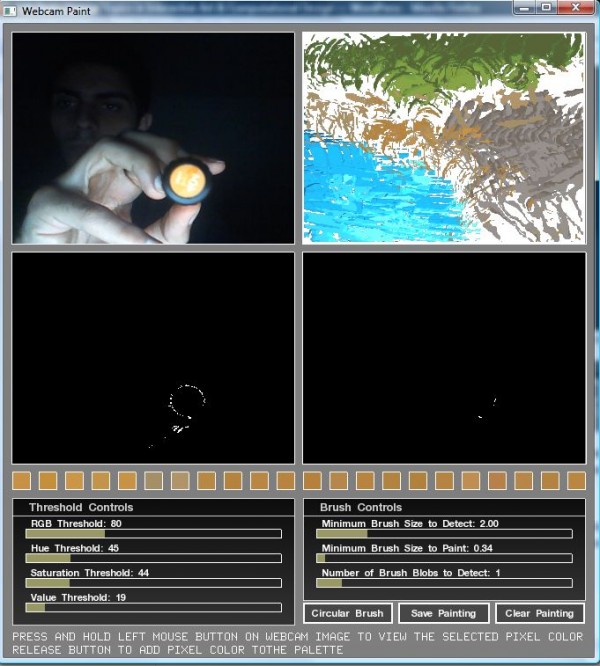
For painting on the pad user should add colors to color palette.  User can do this by pressing mouse left button-while color of program background changes to selected pixel color- and after finding desirable color, user should release the button. The color will be added to the color palette.  For example, user may use his/her hand as a painting brush by clicking on his/her hand and add colors of hand to the palette. Then, he/she can paint by moving his/her hand in front of webcam. User can tweak painting mode using provided sliders.

Interface

Webcam Paint interface is consists of four screen, a color palette, two control panels, and three buttons.

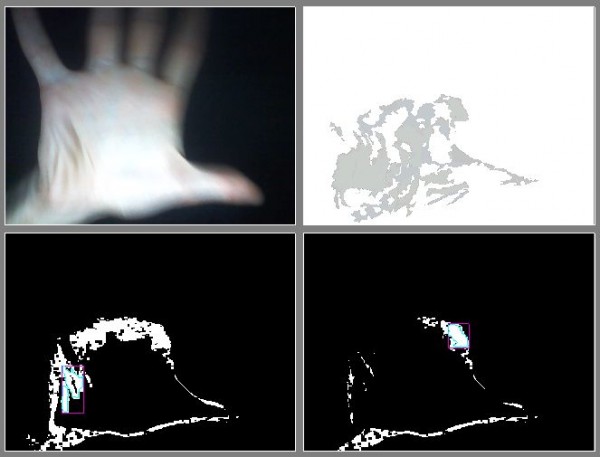
In upper-left screen, user can see webcam input to the program. Upper-right screen is the pad where user paints on. This pad shows current brush positions and painted stuff. User can view and optimize brush detection using lower-left screen which shows the black and white image that OpenCv uses for detecting brush blobs. Finally, lower right screen display any movement of brush blobs.

The color palette displays colors which have been added by the user. User can add unlimited colors to the palette, but, Webcam Paint just uses last twenty two colors on the palette. User can review these colors in the small boxes between screens and control panels.

Additionally, there are two control panels, which give user ability to tweak brush blob and blob movement detection. First one contains sliders to determine hue, saturation, and value threshold for detecting brush blob. It also has a slider that controls RGB threshold for detecting movements in webcam input. Adding thresholds makes detections more sensitive, but high thresholds make it hard to paint accurately. Next control panel has sliders which determine minimum size of blobs to be detected as brush blobs and blob movements. The other slider determine how many blobs detected for each color in the palette.

Finally, there are three buttons in the lower-left portion of interface. One of them is for clearing the pad. The other on is for saving the painting – you can find saved painting in the data folder of the program. The last button switches between drawing by circular brush or free-form brush. If you like to see shape effect of your painting tool on the pad, turn of circular brush button.

What are the algorithm?

For detecting brush blobs, the program changes webcam input to a HSV color image and extract grayscale hue, saturation, and value images out of it. Then,  it detects color blobs for added colors, based on specified thresholds. For detecting brush movement blobs, program perform same process on a image that contains pixels of difference between current and previous webcam input, which has been created using background subtraction algorithm.

Find the program here.

Find the source here. (extract it into of_preRelease_v0061_win_cb_FAT\apps\ folder )

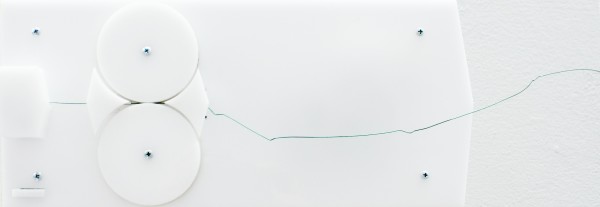
wire speaker

by Cheng @ 6:24 pm

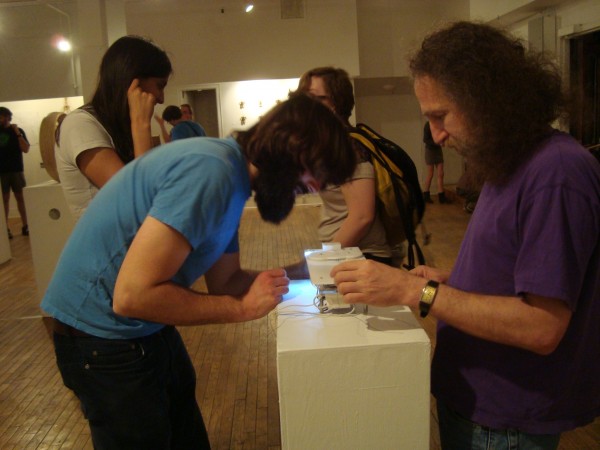
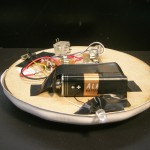
Speaker interactively sculpts wire forms based on the sounds of people
talking. A micro-controller is used to analyze speech and control
several small motors that push and bend wire.


Looking Outwards: Freestyle

by guribe @ 8:48 am 12 May 2010

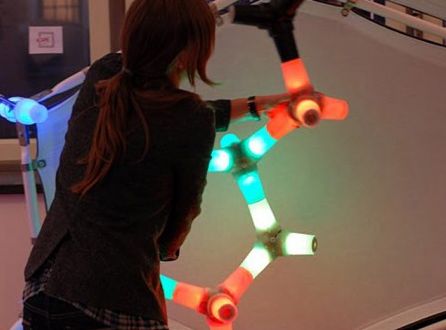
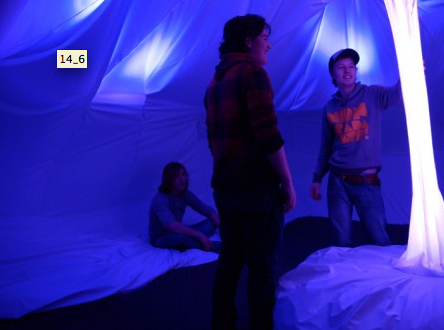
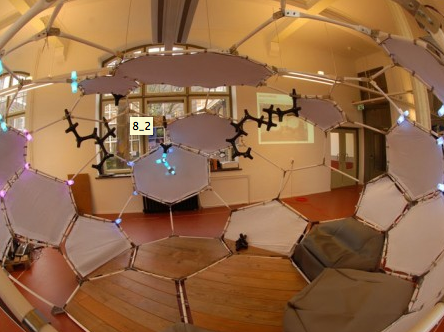
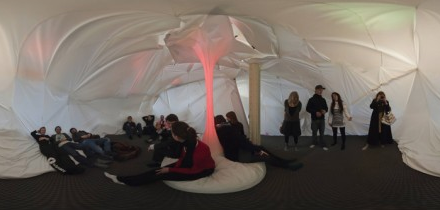
These projects caught my attention because they create an exciting environment that encourages people to play & interact with it. They were created by students studying a course on interactive environments.

There are few courses as extraordinarily ambitious as the Interactive Environments Minor a semester-long project at TU Delft organized by the Faculty of Architecture – hyperBODY and Industrial Design and Engineering – ID-StudioLab.

“Throughout the course, three interdisciplinary groups of students supported by TU Delft researchers and guest teachers have designed and built three interactive lounge pavilions. The pavilions attract people to enter, facilitate relaxation and provide a refuge from daily chores.”

“Each of these structures is a dynamic system, which communicates with its visitors across different modalities. The installations not only actively adapt to their users’ actions, but autonomously develop a will and behaviour of their own. In this way interactive architectural environments come to life, engaging their occupants in an unprecedented experience of a continuous dialogue with the occupied space.”

While he’s been too modest to put his name up front on these projects, the real passion and brains behind this project has been Tomasz Jaskiewicz bringing together undergraduate students from a range of degree courses to create a unique design space occupied by programmers, engineers, architects and designers. I look forward to seeing how this evolves in future.

You can find out more at http://www.interactive-environments.nl/

Final Project: Visualizing Music

by guribe @ 7:59 pm 11 May 2010

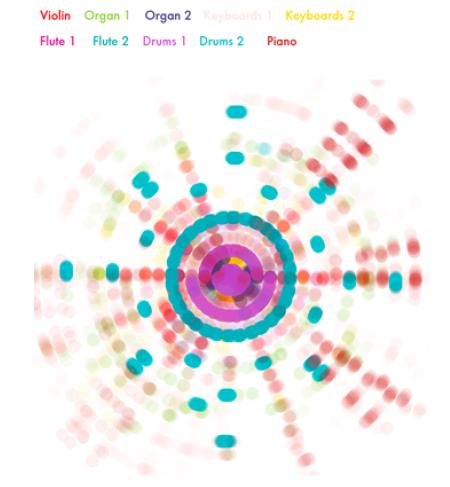
This project aims to create static images representing musical compositions. Each image is like a fingerprint of the song that visually expresses that piece’s use of instruments, rhythmic layout, and how expressively the piece is performed. Information about the music was collected through midi files of each piece. Through Processing/Java, these midi files were parsed and evaluated to visually display various aspects of the songs.

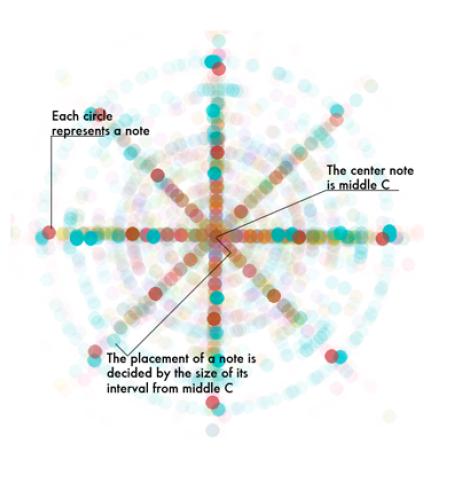
Each note within the piece is represented by small circles. The center circle represents the center of a keyboard, “Middle C”. The placement of a note is determined by the size of its interval from middle c.

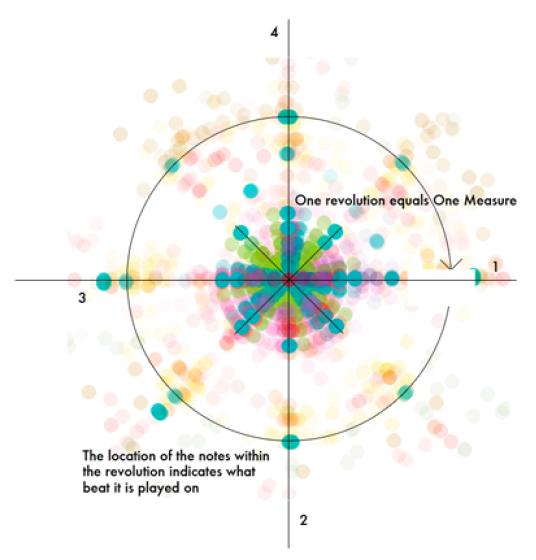
The notes are placed on a square canvas based on the distance from middle C (creating its distance from the center) and also based on where it is played within the measure it is in. This way, if a note is played on the first beat, it will be displayed directly to the right of the center note, if a note is played on the second beat, it will be displayed directly below the center note, and so on. This visually displays the rhythmic patters within the composition as well as creating a strong graphic pattern that can be used to discern how expressively or rigidly a piece is played.

When a note is played, it is displayed in a color representing the instrument that played that note. This makes it easy to see patterns within individual instruments as well as the overall variety of instruments.

Through visually displaying these aspects of the music, one can begin to discover certain differences and similarities within the songs.  The images displayed on the poster are organized by genre so that the viewer can easily understand the differences of the pieces within each genre as well as the differences between the genres overall.

Final Project: Minute

by areuter @ 2:12 am

Overview

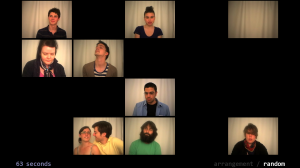
Minute is an examination of individual perception of time–specifically, how everyone perceives the duration of one minute differently. Participants in the project submit videos of what they perceive to be a minute to a database, from which a selection of the videos are chosen randomly to create a visual arrangement of people perceiving time in relation to one another.

Background

I first became interested in this project due to my own inability to accurately perceive time. When I was younger, I would always be the last to finish anything and I’d wonder if everyone was really fast or if I was just slow. This got me thinking about what time meant to me personally, and why I have the perceptions about it that I do. My investigation began about a year ago in Ally Reeve’s concept studio class, in which I conceived the idea of creating an video which contained an arrangement of people perceiving a minute based on background habits, such as whether or not they drink coffee. Then for my first assignment in this class, I expanded upon the idea by creating an application that pulls the videos from a database and arranges them on the screen, generally based on some background factor. For the final project, I wanted to carry this idea even further my making an interactive piece in which people can contribute their own minutes to the database, and then observe how their perception of a minute compares to all the others who have contributed their own minutes.

Implementation

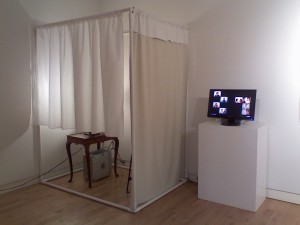
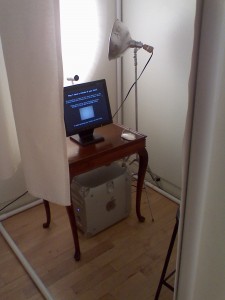
To collect the temporal perceptions of the masses, I constructed a recording booth in which participants can create videos of themselves perceiving their minute. The booth’s frame is made out of plumbing pipes so that it is easy to transport, and the backdrop is a stretch of light-blocking curtain backing. The material is pretty stiff, so it stays in place during the recordings and doesn’t cause too much distraction. Additionally, I hung a short curtain on the side of the booth to make it clear where people should enter, as well as make it easy to see if someone else was in the booth already without disturbing them. The whole structure white colored so that light reflects off the surfaces, as I only used one drawing light aimed at the wall behind the camera as my main source of illumination. (The booth is small, so I didn’t have room for more lights than that and shining the light directly on the booth’s occupant completely washed them out.) Inside the booth is a computer, a desk with a monitor and webcam, and a stool. The computer runs an openFrameworks application which automates the recording process in an effort to make it as simple as possible. Participants are invited to sit inside the booth, and instructions for recording their minute are displayed on the screen with a live stream from the webcam (so that they can adjust their appearance and placement inside the frame as necessary before they begin). When they are ready, they click the mouse to begin recording, and then click again when they feel that a minute has gone by. During this time, the webcam feed is not displayed so that it is not a distraction from perceiving the passage of time. After the final click, the video is sent wirelessly to the computer outside the booth, where it is saved in a directory containing all the minutes recorded so far.

The computer outside the booth runs another openFrameworks application that displays a sample of twenty minutes on a large widescreen monitor, arranged either randomly or by duration. As each video representation of a perceived minute ends, it immediately cuts to black and leaves a gap in the arrangement. After the last minute has disappeared from the screen, the program creates a band new arrangement of videos–no two iterations of the display will be the same. At the beginning of each iteration, the twenty minutes are chosen at random from the directory mentioned above. (All the videos are saved in their own file, separately from the application, so that they can be used the next time the program is run.) My hope is that after participants record and submit their minute to the database, they can step outside and see their minute in the next iteration on the display.

Here is a short sample of the minutes I collected at the Miller Gallery during the BFA/BXA senior exhibit (Fraps unfortunately limits the clip to 30 seconds):

Results

I’m pleased with the outcome of this project, although of course there are many areas which I could improve. One aspect of the project I deliberated over until the end was whether or not I should include the aspect of how a person’s background potentially influences their perception of time. One criticism I’ve heard is that doing so makes the project seem overly scientific for an artistic exploration. As the senior exhibit drew near, I decided that my time would be better spent keeping the piece simple but bringing it to a highly polished state, and looking back I think this definitely the right decision. It’s far more interesting just to arrange the videos by duration and listen to the audience’s conjectures about perception.

After completing the project, I made a couple observations. While the first participants were very withdrawn in their recordings, people became more and more adventurous in how they conveyed themselves. This was extremely interesting to observe, since I’m still very interested in how personality might play a role in how people perceive time. Also, I originally intended that only one person record their minute at a time, but some people really wanted to have someone else in the booth with them. I felt that this conveyed some aspect of their personality that might otherwise be lost, so I ended up deciding to let pairs of people perceive a minute together.

Lastly, there are a few other details that could be a little tighter, but I don’t feel that they detract from the piece in any major way. The booth is hard to keep clean because it’s all white, and sometimes the pipes don’t stick together very well. I ended up taping and nailing them into place, but it would have looked much cleaner if I had drilled a hole through each of the overlapping sections, and then placed a pin through the whole to keep them in place. Also, the recording application takes a few seconds to copy the video over to the other computer, and during that time it looks as if the program has frozen. Occasionally, people will click the mouse multiple times. Each click is queued and sent to the application after it has recovered, resulting in a number of quick scrap recordings that are still sent to the database. Also, it would have been nice to include a feature in the display application so that recently submitted minutes will always be selected. This way, people would be guaranteed the opportunity to see themselves right after recording.

Documentation and reactions to the project:

Project 3: Stuck Pixel

by areuter @ 11:21 pm 10 May 2010

In this project I considered what it might be like to create an experience that contracts one’s perception instead of augmenting it. Stuck Pixel is an application that runs in the background while you carry out your daily activities on the computer. However, whenever you click a pixel (anywhere) on the screen, it becomes “stuck” at the color value it held when you clicked on it. Furthermore, the pixel can no longer be clicked on. After the stuck pixels become sufficiently bothersome, the user can save out the pixels to a BMP file before exiting through the application window.

My intention was to at create a visualization of a user’s computer habits, while at the same time prohibiting their most repetitive actions and eventually encouraging the user to seek an alternative. Which, in a way, is actually a means of augmenting their experience. In a most extreme case, the resulting pixels could provide a visual depiction of addiction…Facebook or other social media, perhaps? Here’s a quick simulated result of that scenario:

Here are some images from my own experience using the application:

Although it wasn’t my intention, I thought that the resulting image was interesting because it reminds me of a constellation:

The application was written in C# using global mouse hooks and other (kind of hackish) tricks.

References:

Processing Global Mouse and Keyboard Hooks in C#
By George Mamaladze
http://www.codeproject.com/KB/cs/globalhook.aspx?msg=2808928

Final Project: Fluency Games

by davidyen @ 7:37 pm

Introduction
For my final project, I worked with Professor Jack Mostow and the Project LISTEN team (www.cs.cmu.edu/~listen/) to do some exploratory work for their product, the Reading Tutor.

Background
Project LISTEN is a research project at CMU developing a new software, the Reading Tutor, for improving literacy in children. The Reading Tutor intelligently generates stories and listens to children read, providing helpful feedback.

My Involvement
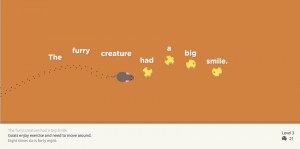
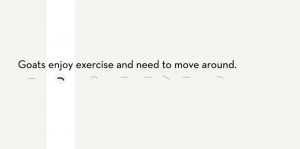
I was asked to create sketches for a possible new component of the Reading Tutor, which would explore using visual feedback to help children read sentences more fluently (not currently a feature of Reading Tutor). This involved using canned speech and analysis couples to experiment with the intent of becoming “live” at a later date.

The Challenges
The most challenging parts of this project was working with the raw data from speech analysis software making partial hypotheses (and later correcting them) as to what was being said, and doing signal processing on the data. Also it was really fun and stimulating to work with experts in a subject to develop ideas.

Prosodic Data
Prosody is the pattern of rhythm, stresses and intonations of a spoken sentence. Project LISTEN developed speech analysis software that understands what words have been said and measures pitch & intensity over time.
Game Mechanics

Game Mechanics
I emphasized an approach that would incorporate game mechanics to the visualization of prosody to engage and connect with children. Game mechanics provide incentives for improvement and reinforcement through rewards.

The Games

Other preliminary sketches

The Games
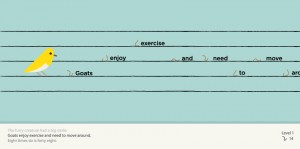
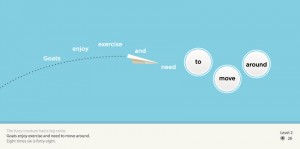
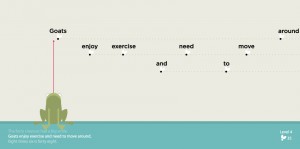
My sketches developed into a flexible system of “leveled” gameplay, which grows with the child’s abilities to provide a steady challenge. The framework provides a consistent objective (mimic the correct shape of the sentence) while slightly and intuitively mapping different game mechanisms to different visual scenarios.

Next Steps
I worked with the Project LISTEN team in the last few days of the semester by walking through my code together, so they can continue developing my sketches to hopefully be user tested this summer with local schools.

Thanks to Jack Mostow and Project LISTEN team for the great opportunity, essential guidance and accommodation, and Golan and Patrick for their help along the semester and for a fantastic class.

-David Yen

Final Project- Colorshift

by caudenri @ 1:28 pm

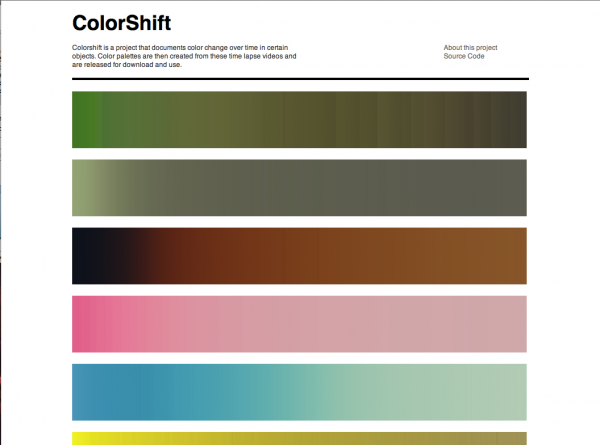
For my project tracking color changes in different things over time, I was able to do eight color experiments, with the ability to add more.

The web interface can be found here: http://carynaudenried.net/colorshift/colorshift.php

I would like to add more color experiments in the future because there were several that I just ran out of time to be able to do. I would also like to make some sort of physical output with these gradients, such as printing them on a coffee cup or having the colors stitched onto a tee shirt. If I can do this, I’ll update this page.

Overall this project was very challenging to me, just in organization and getting all the technical aspects working, but I had a lot of fun with it. I think there is a lot of potential to branch off into related areas with this project as well, and I’ve found a new interest in timelapse photography.

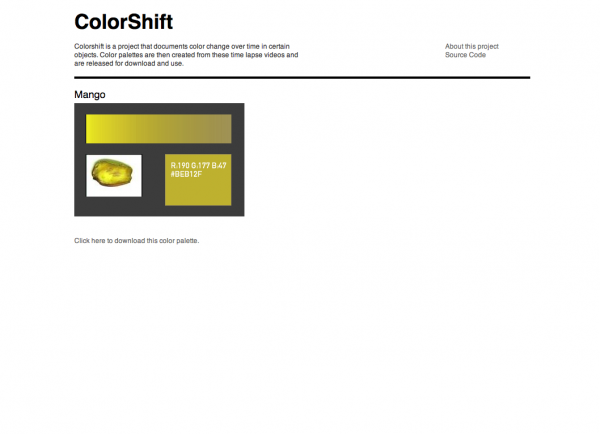
Below are some screen shots of the site. The source code and ACT files can all be downloaded from the site.

homepage screen shot

gradient page screen shot

Final Project: Typeface Map

by Nara @ 12:13 pm

The Concept

I actually came up with the idea for this project a while ago. Last semester, I wanted to do an information visualization piece for my senior studio class and after searching for ideas for things that hadn’t been tackled in the realm of computational information design yet, I thought up this project. The only visualizations of typeface classification and the relationships between fonts had been static posters, so I thought this was a real opportunity to do something that hadn’t been done before. At the time, however, I felt too inexperienced in information visualization to tackle this project.

The concept has a fairly broad scope and can be expanded to include any number of ideas and applications, but for the sake of making it workable for this class, I decided to focus my efforts mainly on the analysis of the letter shapes and the mapping in 2D space, where proximity represents a measure of similarity between two typefaces. Obviously there are a number of other visualizations that could be tried, and the applet could serve a number of different uses, and someday I’d like to try a lot of those things, but in terms of this project, there just wasn’t time. The project would have two deliverables: a large poster representing the map, as well as an interactive applet implemented in Processing and Java.

The Significance

Many people have asked me, “Why do this project? Why are you interested in this?” The answer is that I think a lot of us graphic designers carry a vague notion of this typeface map in our heads, but if you asked us exactly to describe it (or even draw it) I think we’d have a hard time just because I think our understanding of the relationships between typefaces is based as much as, if not moreso, on this intuitive sense, rather than facts and math. So, I’m interested in comparing the maps in our heads with a mapping based on mathematical analysis.

In addition, part of the inspiration for this project came when a non-designer friend asked me, “I’ve been using Helvetica all the time because I love it, but I feel like I should be branching out. What typefaces are similar to Helvetica that I can try?” I rattled off a list before even thinking about it, and then I started wondering how I knew that and why he didn’t. Part of my intent behind this project was to create a tool for non-designers that will allow them to understand more about the world of typefaces, and make informed decisions about which fonts to used (not based on purpose, since that’s an entirely different animal, but based on relationships to well-known fonts).

The Execution

The project had two main components: Analysis of the letter shapes using various metrics and shape analysis methods, and mapping the nodes in 2D space using PCA. The letter shape analysis was done using the Geomerative library for Processing, which unfortunately had a number of problems; for example, the fact that the positions of the points on the outline of the letter shape start at a different and completely random position for each font. As a result, some of my computations were slightly hack’ish, and when I continue this project, I’d like to make them more sophisticated and smart, but with how little time we had, I didn’t really have the time to dwell on these things if I had a hack that was working.

As for the mapping using PCA, I used the TuftsGeometry library for Java, which is very lightweight and easy to use. Unfortunately, it doesn’t quite have that many useful extensions; for example, it can’t give me a readout of exactly which factors are included in the PCA projection and how dominant they are. However, the ease of use of this library compared to many other PCA libraries for Java to me was much more important than its extensions.

Once I figured out how to do the PCA projection using this library, I just needed to add the new variables to the matrix input every time I added one, so that was fairly simple and easy. One of the trickier bits was weighting the variables. Since the variables are in different units (some are actual measures while others are ratios) the real variance between them isn’t always indicative of how important a variable is, and so you need to weight them accordingly. Finding the correct weightings took up a lot of time in this project.

A classmate suggested that I also use this to calculate the best serif/sans-serif pairings for each typeface, so I did. That was fairly easy to do; it just used some of the same variables but with a different weighting to look for the typeface in the opposite “class” (serif or sans serif) with the highest degree of similarity.

The Process

The final product essentially does the following:

  1. Reads in a TrueType font file
  2. Converts it to a polygon using the Geomerative library
  3. Runs shape analysis on a specified set of letters and their properties
  4. Puts these analysis variables for each typeface into one large matrix
  5. Sends this matrix into the TuftsGeometry library to do a PCA projection
  6. Maps the typefaces in 2D space using the PCA projection
  7. Calculates the best serif/sans-serif pairing for each font using a small subset of the typeface variables
  8. Displays the mapping on-screen, with some extra interface stuff

Also, for the sake of comparing the mapping to our learned knowledge related to typefaces, the program reads in a CSV file with some information for each typeface such as the year it was made and the pedantic classification it’s been given by ATypI. The digital applet allows the user to overlay this information on the mapping to see if any interesting and/or unexpected results are shown.

The Difficulties

The project actually progressed fairly well until I ran into a major technical difficulty the day before the final show. I had just rendered the PDF poster and was going to print it when I realized a few things I needed to add and opened Eclipse back up. For some reason, however, it had deleted all the contents of my /bin/data folder, which contained all of the TrueType font files I had been working with. I was able to recover some of them, but most of them had been downloaded from FontYukle.com and were low-quality. Before rendering the PDF, I’d managed to replace most of those with fonts from my own OpenType font library that I’d converted to TTF files, but all of those were gone and unrecoverable. Sometime over the summer, I’d like to do all of those conversions again so I can restore the applet to what it looked like when it was working well. Thankfully at least I had the poster as proof of my program’s success.

The Final Deliverables

The poster can be seen below:

The applet currently isn’t online since it needs a lot of fixing up. Hopefully I can work on that over the summer because I do want to continue this project since I think it has a lot of potential.

The Next Steps

Once I have some time to relax and detox from this busy school year, here’s some things I want to work on next:

  • Restoring all of the font files
  • Making the shape analysis metrics a little more sophisticated and less hack’ish
  • Focusing more on the applet as opposed to the poster and adding more functionality to the interface (eg. zoom)
  • Play around with a few other visualization methods to see what happens
  • Write a paper??
Jon Miller – Looking Outwards 8 – Facadeprinter

by Jon Miller @ 4:01 am

link: http://www.pixelsumo.com/post/facadeprinter

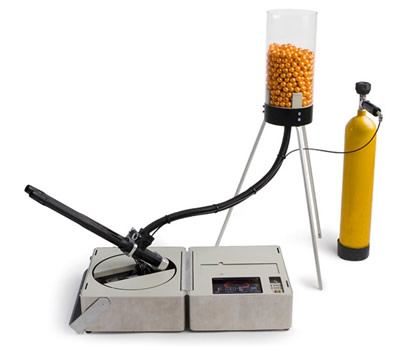
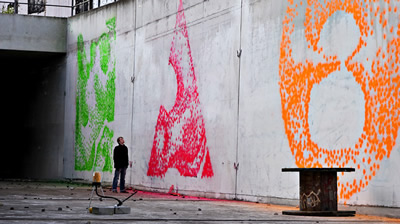
This is another innovative combination that involves two preexisting pieces of technology: printing software and a paintball gun. They use it to print images onto a canvas, which could be anything, including the sides of buildings and structures. It looks like they are also attempting to package it as a quick way of communicating visually, for example during disaster relief where there is a need for large, easy to read signs to be put up quickly.

Jon Miller – Looking Outwards 7 – Color Survey, Xkcd guy

by Jon Miller @ 2:41 am

Link

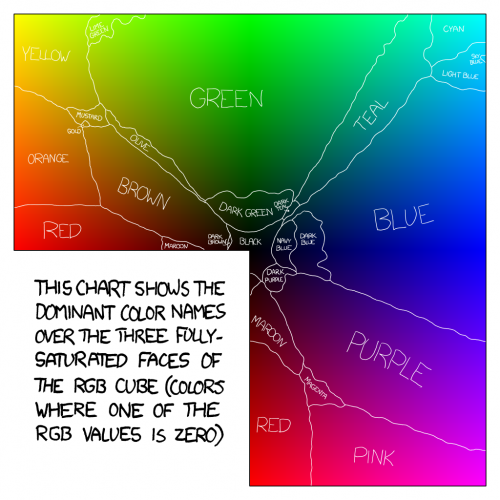
The data set given was to ask people to name colors. The xkcd guy then analyzes and the results in an interesting and humorous way.
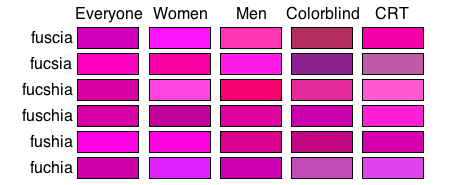
A lot of thought and analysis, however tongue in cheek, has gone into this, much more than pictured above. I recommend checking out the link. He analyzes the most “masculine” and “feminine” colors (“penis” and “dusty teal” respectively), as well as looking at some of the more interesting things said by the participants.

2 Girls 1 Cup Final Project

by paulshen @ 11:24 pm 9 May 2010

http://hackandsleep.com/2girls1cup

As of posting, 70,000 hits and counting!

From Wikipedia

2 Girls 1 Cup is the unofficial nickname of the trailer for Hungry Bitches, a scat-fetish pornographic film produced by MFX Media. The trailer features two women conducting themselves in fetishistic intimate relations, including defecating into a cup, taking turns ostensibly consuming the excrement, and vomiting it into each other’s mouths. “Lovers Theme”, from Herve Roy’s Romantic Themes, plays throughout.

Part of what has facilitated 2 Girls 1 Cup’s spread are the reactions it causes. Thousands of videos exist on YouTube of users showing the original video (off-camera) to their friends and taping their reactions, although some videos seem to be staged.

Analysis

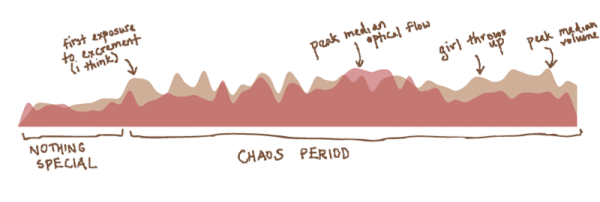
A collection of twenty of the most-viewed YouTube reaction videos were downloaded and then edited to start at the same time. This was possible by listening for the start of the audio for the 2 Girls 1 Cup video. Each of these videos were then processed to collect data about optical flow and volume.
Volume

Loud reactions are common in the reaction videos. Screams of disbelief and horror are a big part of what make the reactions so interesting. For each frame of a reaction video, the fast Fourier transform calculated the frequency spectrum of an instance of audio. The frequency bins were then summed to calculate the volume. A window of one second was used to smooth the data.
Optical Flow

There are often strong visible reactions to the video, with people either flailing or cowering in fear. Optical flow is the amount of movement in a video. This differs from techniques such as background subtraction and differencing because the amount of image displacement is calculated. For this project, the openCV function cvCalcOpticalFlowBM was used to retrieve the amount of motion between consecutive frames. As with the audio, a window of one second was used to smooth the data.

Pretty graphs

Each color represents a different reaction video plotted over time.

The median value for each second was used to lessen the effect of outliers.

Conclusion

So in the end, were there any conclusions that resulted from this analysis? I had hoped by analyzing the reaction videos quantitatively, patterns would emerge that could, in an indirect way, describe 2 Girls 1 Cup. But it appears that once the mayhem begins, the reaction videos turn into chaos, maintaining the shock through the duration of the video.
This project was created for Golan Levin‘s ‘Special Topics in Interactive Art & Computational Design’ course at Carnegie Mellon, Spring 2010

Shameless plug for other projects: Augmenting with Optical Flow The Central Dimension of Human Personality

So much for trying to put numbers to scat-fetish porn.

Jon Miller – Looking Outwards 6 – Duct Tape Platformer

by Jon Miller @ 8:27 pm

Link: http://www.artificial.dk/articles/edgebomber.htm

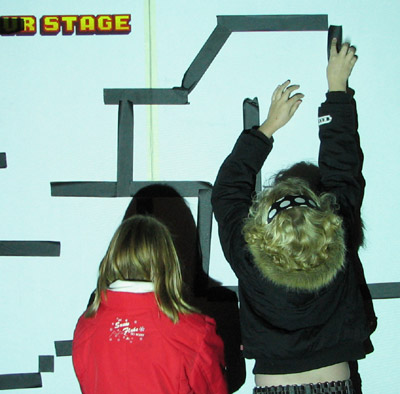
This piece allows people to place duct tape on the wall, which is then scanned and turned into a playable platform game that is projected onto the screen. It’s one of those ideas that, once thought of, is relatively easy to implement, if only one had the idea first. This piece is relatively old (2006), but in case anyone was not yet aware of it, here it is.
I think it is meaningful because it is a creative combination of the physical world and the game world. I could also see something like this turning into a creative tool for level design.

SubFabricator

by mghods @ 9:50 pm 8 May 2010

“How to Sculpt an Elephant: A Foolproof Method
Step one:  Obtain a very large block of marble.
Step two:  Remove everything that does not look like an elephant.”

– from comments on project sketch

Introduction:

Sub-Fabricator is a framework that enables Processing users to fabricate objects as the output of their Processing codes. The goal of Sub-Fabricator is providing a simple way for Processing users to exhibit their code outputs in form of fabricating prototypes through connecting Processing and Rhino GrassHopper while enabling users to create their desired forms in an interactive or a static way.

More Details:

Taking advantages of both, Sub-Fabricator provides a link between Processing and Grasshopper. Processing users can use Sub-Fabricator by implementing sub-fabricator interface for writing their code. They should provide Sub-Fabricator their code as a class which creates a set of drill paths for CNC router or milling robot. Then they can statically preview the output of their code or interactively create outputs in Sub-Fabricator user interface, which also runs in Processing. After adjusting their desired parameters for fabrication in Sub-Fabricator interface, they can send their desired output to GrassHopper. Additionally, they can, simply, tweak the outputs in GrassHopper Sub-Fabricator definition. From GrassHopper, users can send their file for fabrication.

Sub-Fabricator supports these features:

– Creating drill points or milling paths for one layer and multiple layer fabrication

– Interactive creation of drill points or milling paths

– 3d Environment for previewing outputs in Processing

– One sided and double sided milling or drilling

– Tessellating outputs on surfaces

You can find project:

sketch here

poster here

SubFabricator package here

Examples:

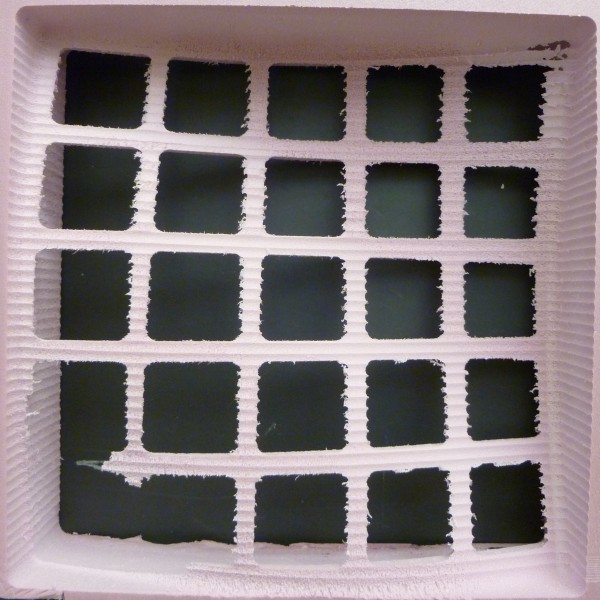
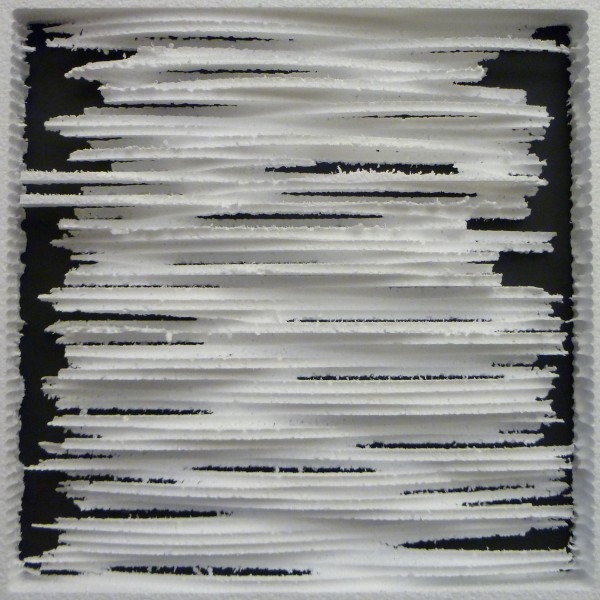
1- Sine wave with a grid of openings:

Processing Code:

UserClass3(int numInXDir, int numInYDir, float stepSize) {
  this.numInXDir = numInXDir;
  this.numInYDir = numInYDir;
  this.stepSize = stepSize;
  float maxDis = numInXDir * numInXDir + numInYDir * numInYDir;
    for (float x = 0; x <= numInXDir; x += stepSize) {
      for (float y = 0; y <= numInYDir; y += stepSize) {
        PVector position = new PVector(x, y, 60 + 40 * sin(map((x+y) / (numInXDir + numInYDir), 0 , 1, 0, 2 * PI)));
        float magnitude = ((x % 20 < 4 || x % 20 > 16) || (y % 20 < 4 || y % 20 > 16) ? 20 * sin(map((x+y)/ (numInXDir + numInYDir), 0 , 1, 0, PI)) : 0);
        float diameter = 1;
        CNCOneLayerData curData = new CNCOneLayerData(position, magnitude, diameter);
        COLData.add(curData);
      }
   }
}

Fabrication Image:

Fabrication Video:

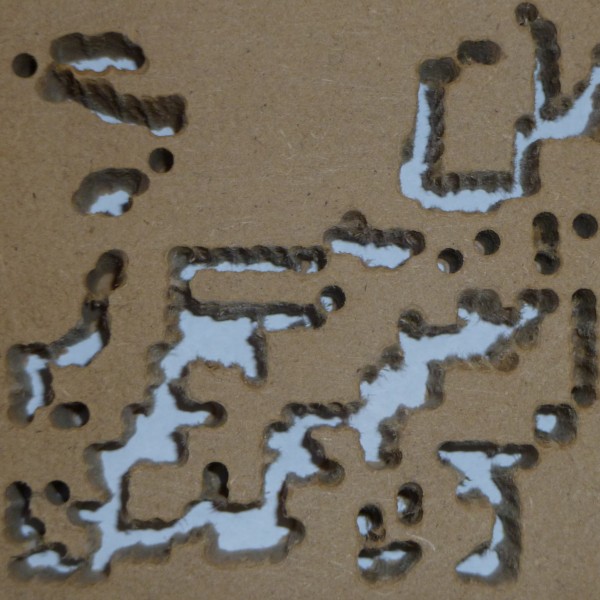
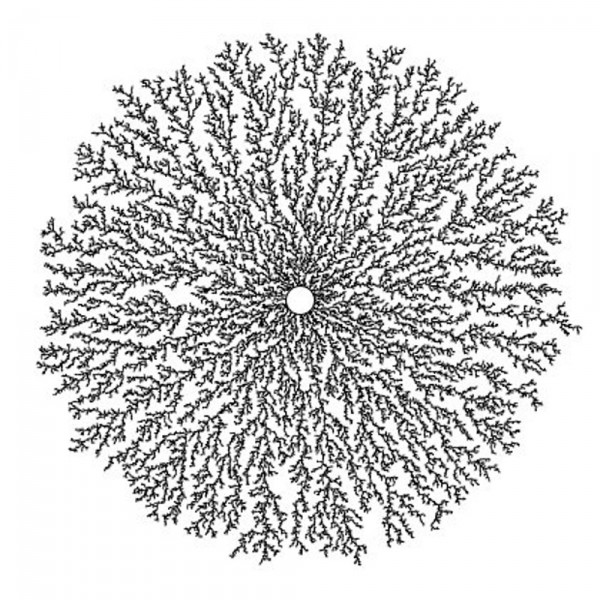
2- Diffusion Limited Aggregation Image:

Processing Code:

UserClass2() {
   // enter path to your image here
   img = loadImage("C:\\temp\\images\\wdrop.jpg");
   this.numInXDir = img.width;
   this.numInYDir = img.height;
   this.stepSize = 10;
   int cols = floor(this.numInXDir / stepSize);
   int rows = floor(this.numInYDir / stepSize);
   for (int i = 0; i < cols; i++) {
     for (int j = 0; j < rows; j++) {
       float x = i * stepSize + stepSize / 2; // x position
       float y = j * stepSize + stepSize / 2; // y position
       int loc = floor(x + y * numInXDir);           // Pixel array location
       color c = img.pixels[loc];       // Grab the color
       // Calculate a z position as a function of mouseX and pixel brightness
       float z = (brightness(img.pixels[loc])) / 255 * 10;
       PVector position = new PVector(x, y, 20);
       float magnitude = z;
       float diameter = 1;
       CNCOneLayerData curData = new CNCOneLayerData(position, magnitude, diameter);
       COLData.add(curData);
    }
  }
}

Original Image: (a small portion of this image fabricated)

Fabrication Image:

Fabrication Video:

3- Random sine waves:

Processing Code:

UserClass5(int numInXDir, int numInYDir, float stepSize) {
   this.numInXDir = numInXDir;
   this.numInYDir = numInYDir;
   this.stepSize = stepSize;
   for (float x = 0; x < numInXDir; x += stepSize) {
     int randStart = (int) random(0, 100);
     for (float y = 0; y < numInYDir; y += stepSize) {
       float z = 15 + 5 * sin(map((y - randStart), 0, 100, 0, 2 * PI)) ;
       PVector position = new PVector(x, y, z);
       float magnitude = 10 * sin(map(y/ (numInYDir), 0 , 1, 0, PI));
       float diameter = 1;
       CNCOneLayerData curData = new CNCOneLayerData(position, magnitude, diameter);
       COLData.add(curData);
    }
  }
}

Fabrication Image:

Fabrication Video:

What I Have Learned:

Working on this project I learned:

1- Lot about fabrication. Most important one is that milling is much, much faster and safer than drilling a point. While drilling DLA image I broke two drilling bits. Fabricating  the small DLA image takes an hour while fabricating others take one hour totally (the change of material from wood to foam was helpful to some extents. I tested milling on MDF as well, it was much faster than drilling MDF. )

2- How to work with hash sets and tables.

3- Some data handling algorithms.

Challenges:

While writing codes and creating prototypes for demonstrating SubFabricator functionality, I have encountered many problems and challenges:

1- Checking if a form can be created even by a simple idea like drilling a bunch of points is a complicated problem, since every time a path milled or a point drilled the remain material changes and it may not be stable anymore for further fabrication, as an example think of fabricating a sphere.

2- Creating molds which are functional, usable, and stable and checking for all of these features needs considering many situations and exceptions. For example, questions like “Is all spaces connected?” and ”Do molds stay stable after casting?” come to the mind.

3- Creating reusable molds for complex shapes is an open problem.

4- Figuring out if a path is valid for milling using a 7 axis robot is mind blowing.

5- Implementing algorithms which has low run-time complexity for doing all data handling and problem solving is still a big challenge.

To Be Continued:

Current code just supports creating one layer form using CNC router. The complete project will support CNC multilayer and Robot one layer/multilayer forms as well. It also works based on drill points, this will changed to milling paths for sake of faster and safer fabrication. In addition, my final goal is providing a script writing environment for SubFabricator, where users can write and run their interactive codes in Processing language.

Final Project Documentation – Head Monster

by kuanjuw @ 6:19 am

Head Monster from kuanjuwu on Vimeo.


0.Introduction
“LIVES IN MY HEAD. IT CONSISTS OF MY WILL.
WHEN IT EATS SOMETHING, I HAVE A FEELING.
SOMETIMES HAPPY, SOMETIMES SAD.
SOMETIMES SWEET, SOMETIMES FUCK.
IT IS HARD TO CONTROL MY FEELING, JUST LIKE
TO CONTROLL THE HEAD MONSTER.”

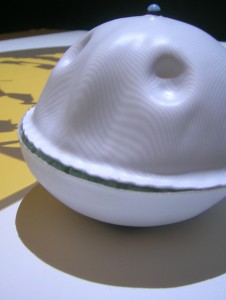
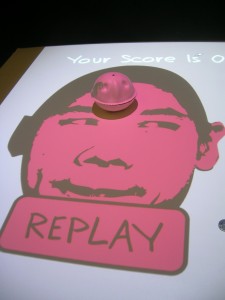
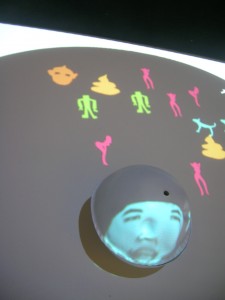
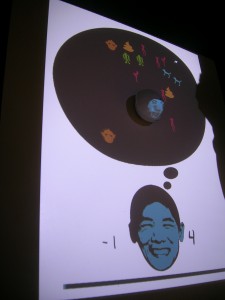
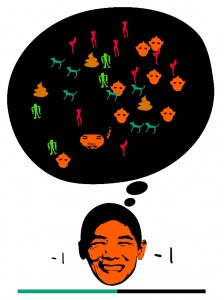
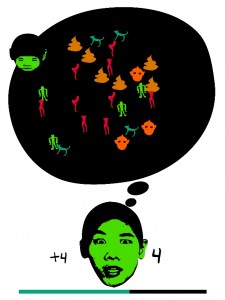
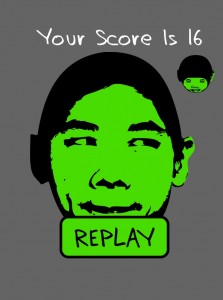
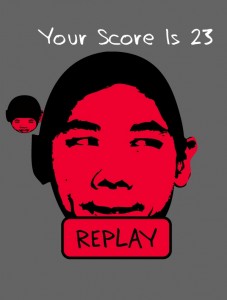
Head Monster is an interactive game that the user uses a face shape control panel to drive a head like small robot. When the robot hit an object (projection), it will eat the object, and the face will change. Some objects represent good some mean bad. We earn points by eating those good objects and get minus point by eating bad objects. In the limited time the user need to gain the points as high as possible.

1.Motivation
The idea of creating a small creature that has simple behavior (follows simple rule) came to my mind at the first time. In many movies like AVATAR or Princess Mononoke we can find a character that is small and white and represents the spirit of pureness. Inspired by Valentino Braitenberg’s VEHICLES I started building simple moving robots that follow people.

2.Exploration
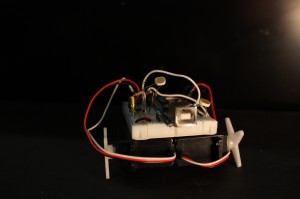
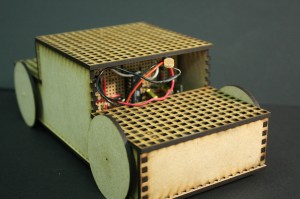
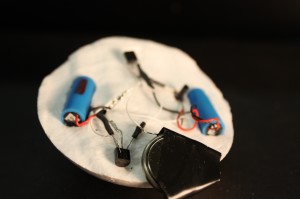
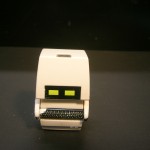
To Make a Braitenberg Vehicle I tried different approaches:

(Two servo motors and two light sensors hook up with Arduino)


(Two DC motors and two light sensor with a handmade Arduino board)


(Two light sensors and two pager motors connected with transistor. No Arduino )

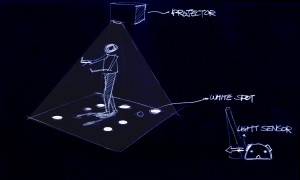
To control these people following robots I was thinking using projector from top projects bright white spot on the floor which enable robots to follow with. A camera from top captures the image of player and find the position, and then projects white circles that are flocking around.

This idea fail because:
1. Robots are too slow to chase the white spots.
2. Player’s shadow might block the light.
3. The light environment has many noise which causes randomness of robots.
At this point I changed the idea:
Instead of making robots follow light spots, I make the white spots (projection) follow a robot. And here is the basic structure of HEAD MONSTER:
Using a IR-camera from the top we can find the position of IR emitter embedded robot and project image on the robot.The robot is made by a small RC vehicle which controlled by a four tilt sensors embedded controller.

4.Implementation

ROBOT:

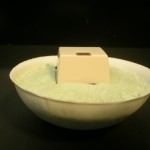
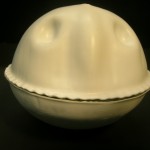
(The form of head monster. Drawn in Alias, cut by CNC milling machine.)

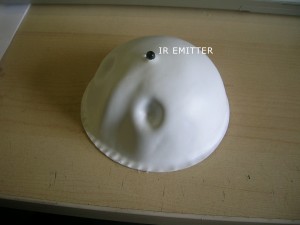
(Vacuum forming the head shape foam, the upper part is embedded with an IR emitter)
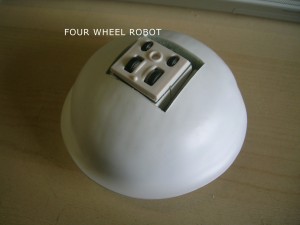
(The lower part has a four wheel robot inside)

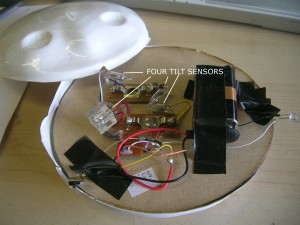
(Hacked radio controller. Four tilt sensors control four directions of movement)

IR CAMERA:

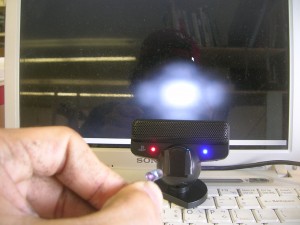
(Hacked PS3 Eye, the IR filter has been taken off. Instruction: http://www.peauproductions.blogspot.com/)

INTERFACE:
Programmed in Openframeworks.


(When the small face moves cross over an object, the score and the big face change)

5.Final Thought
There are many challenges of controlling small robots that following people, which makes me think of: It is so hard to 100% control the robot. What if we abandon the right of control and let the randomness of the physical world (the ambient light, the form of robot, sensors, motors…) drives the robot, the robot might become more vivid. Although the original idea was not success, we learned the experience from this exploration.

Final Project: Shaper

by Karl DD @ 7:45 am 7 May 2010

‘Shaper’ is a prototype device that uses a three axis CNC machine to interactively dispense expanding polyurethane foam material. The device can be controlled directly via a translucent touch screen, allowing the user to look into the fabrication area and create physical artifacts with simple gestures.

Challenge

This project tried to challenge the conventional process of ‘digital fabrication’, by prototyping fabrication devices that allowed for direct interactive control. The motivation behind this was a belief that the current digital fabrication process was too fragmented, and new creative possibilities could be uncovered by using new interfaces designed for ‘interactive fabrication’.

Challenges

The question still remains: What does interactive control offer over conventional CAD-based digital fabrication processes or even manual fabrication processes? I don’t have a definitive answer but there are a handful of ideas I can suggest.

+ A better understanding of materials. By bringing the physical devices together the user automatically starts to design/create with consideration of the nature of the material.
Speed of production. We chose expanding polyurethane foam to enable physical objects to be fabricated quickly. Unlike other additive 3D printing processes, foam quickly expands to a substantial volume. The hope was to have the machine keep pace with the creative process of the user. Unfortunately the foam was quite difficult to tame (as you can see at the end of the video), and the speed of the machine itself proved to be a bottleneck.
+ Interpretability, repeatability, & precision. When compared with manual fabrication, interactive control offers the ability to interpret user gestures and map them to specific physical output, then furthermore repeat them again and again with precision.
+ Direct visual feedback. By situating the interface with the fabrication device the user can view the material directly to better understand the spatial relationships and structure of the form. While this feedback pales in comparison to the rich haptic feedback of manual fabrication, there are instances when safety concerns or issues of scale necessitate the use of a machine rather than a hands-on operator.

FlightSage – Final Project

by rcameron @ 12:14 am

View site

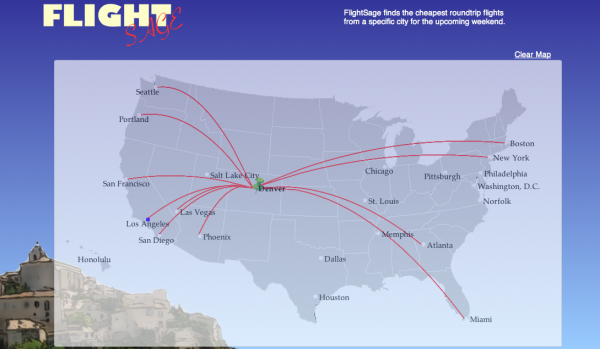
Initial Concept: I wanted to make a big interactive installation. At the same time, I wanted to revisit my first project involving mapping the cheapest flights. So, I mashed them together and involved some LED throwies.

Golan’s Verdict: I just turned something that was meant to be really useful into an installation that doesn’t really help anybody and isn’t entirely compelling. Based on his recommendation, I decided to drop the CV stuff a week before the show and re-make the project in HTML5 using Canvas.

Result: I learned a lot about computer vision and am planning on doing something this summer with a projector, my new found CV knowledge and all the LED throwies I made. The website is up and will definitely be getting an overhaul. The link is above.

Implementation: As mentioned before, the site uses HTML5. All of the drawing takes place in a canvas tag. I had to implement my own animated beziers by calculating them during each animation cycle. I have a Ruby script running on the server constantly requesting tickets from Kayak. Unfortunately, Kayak keeps kicking me out which is not helping me collect data. Anyway, data for the cheapest ticket is stored in a MySQL database. When someone searches for a flight from somewhere, all of the most recent tickets from that place are pulled from the database via AJAX and used to populate the hover boxes. I also provided a Book It! link that takes users to the Kayak purchase page.

Final Thoughts: I want to make the website prettier. Also, I’m not sure about the name FlightSage. If anyone has some great ideas for names or just wants to comment on the current one, I’d appreciate it.

Final Project: Recursive Photo Booth

by sbisker @ 11:01 pm 6 May 2010

Recursive Photo Booth: Fun within pictures, within pictures, within pictures…
By Sol Bisker

What is the Recursive Photo Booth?
The Recursive Photo Booth uses marker-based augmented reality (AR) to enable a simple and fun form of collaborative photography. It is best experienced while tired, giddy or drunk.
To help you understand it, my friends have prepared a Q&A:

Sol! What is this thing?
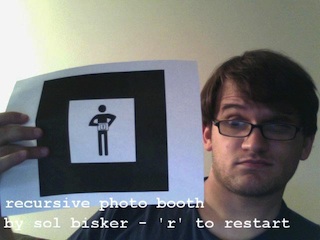
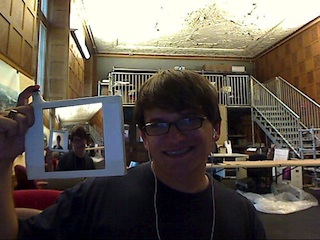
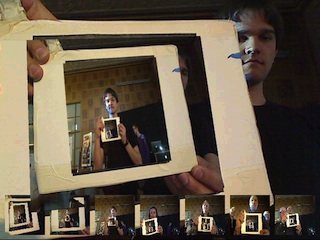
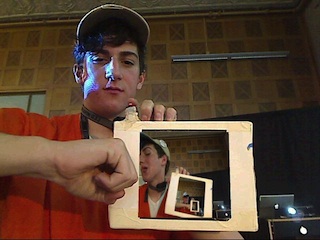
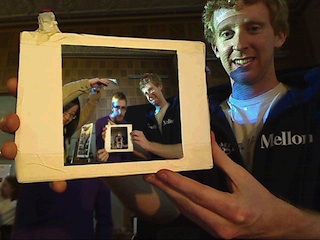
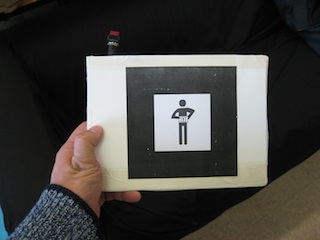
It’s a photobooth! Sort of. It’s like a real photobooth. But we give you an little black and white man to pose with. He’s holding up a picture of himself, holding up a picture.


See? Isn’t he cute?

Ok, why would I want to pose with that little man?
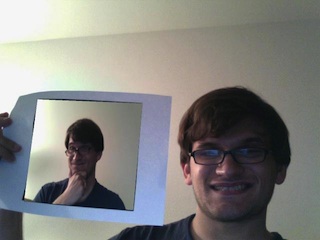
He’s no ordinary little black and white man. When you see him on our screen, he becomes…a picture! Of me, to start. Every good recursion needs a base case.


Aren’t *I* cute?

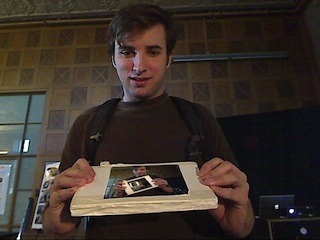
So, you pose with the picture shown on the frame. When you’re ready, you take your picture…


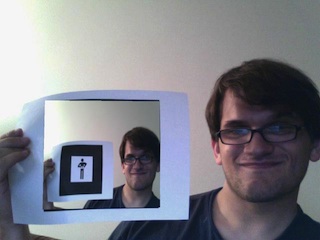
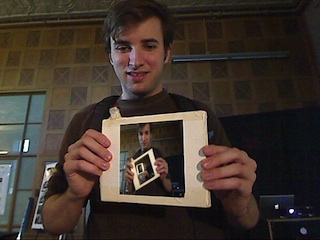
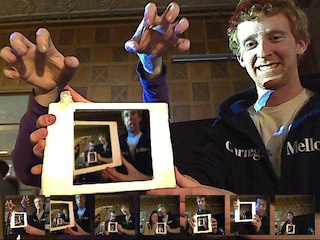
Now, the image you’re holding up becomes…the picture you just took! For the next person to enter the photo booth to pose with.


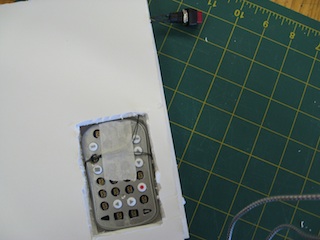
You can take a photo by pushing a red button on the top of the image, as though it were a camera shutter button.

That’s…awfully simple. How could this possibly be fun?
Well, it turns out that once people start playing with it, they find their own ways to have fun with the thing. Ways we had never even dreamed of.
We let nearly a hundred people try out the recursive photo booth at an installation, and here’s some of the many things they did with it:


Pose with yourself!


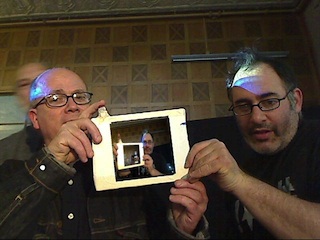
Pose with your colleagues!


Pose with some old dude you’ve never met!


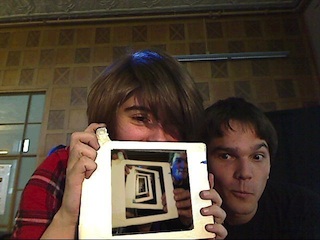
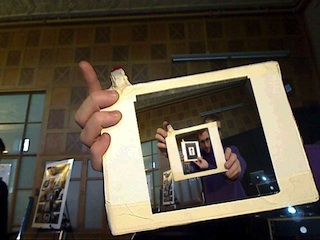
Fall deeper


and deeper


and deeper and deeper…


until you pop back out!


Do the adorable couple thing!


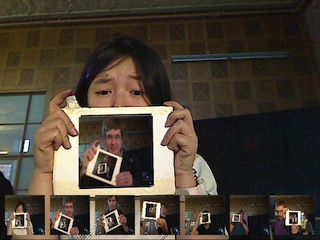
Cower in fear…


…of yourself!


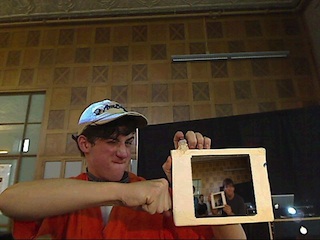
Punch someone in the face!


Then punch yourself in the face! (Why, we’re not sure – it looks painful.)


Cover the black frame with your thumb while taking the photo and screw up the tracking!
(It’s cool; that’s why we have the “restart” and “undo” buttons.)


Lay yourself flat!


…whoa.


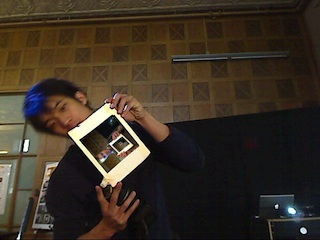
Turn yourself sideways…sideways?


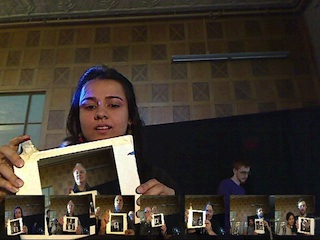
Group shot!


Do some weird growly thing with your hands!

Alright, so how’d you build this?
The “black and white man” is actually a marker for a visual augmented reality library called ARToolkit. The image taken by the previous user is drawn by ARToolkit onto the live webcam feed as you pose with it. Once you press the button to take a picture, we do a screen capture of the webcam feed as your “photo”, save it to disk, and making your new photo the picture for the next person to pose with.
All of this occurs in Processing, although we’d like to port it to OpenFrameworks in the coming weeks.

How does the wireless “camera” with the red button work to take a photo?


Simple. It’s hand-soldered into the button on a standard off-the-shelf presenter’s slide remote. The remote then communicates wirelessly to our computer, which registers your button press as a key press in Processing as if you were advancing a slide on a boring Powerpoint. A cheap and effective hack.


In our prototype installation, we’ve embedded the remote in layers of foamcore without any problems of reliability or wireless signal loss. So our next version will be made thicker and sturdier, out of wood or plastic, to allow for days of Recursive Photo Booth fun! (In fact, we’ll bring a few of them, just in case one breaks.)

Ok, enough already! …wait a second. Sol! How on earth did you get full marks on your semester studio project for at most a week’s worth of actual work?
Shhhhhhhhhh.

Looking Outwards: Freestyle

by guribe @ 10:56 pm

Luminous Ceilings

This is a project I found on interactivearchitecture.org that looked interesting to me.

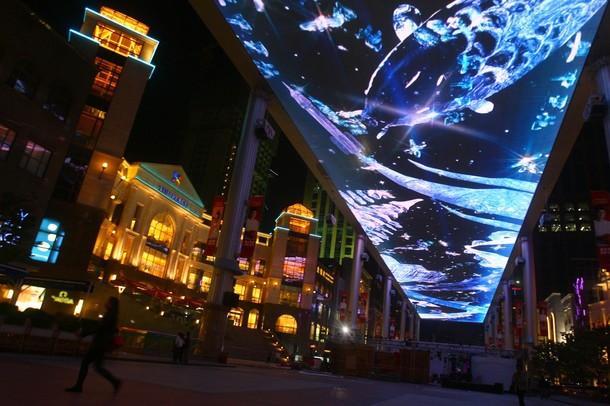
Thomas Schielke sent me his youtube presentation of Luminous ceilings a few months ago and usually I bin such emails since I like to find things for myself but I really enjoyed the way this research was put together (except the chessey music). Thomas explains that besides these ceilings providing spacious impressions they this work always metaphors the natural sky. “The historical observation of ceilings reveals that the image of heaven, which reached a theological culmination in the luminous Renaissance stucco techniques, turned into large-scale light emanating surfaces.”

Watch the video: luminous ceilings

From arclighting.de:

The aesthetic of luminous ceilings
From the image of heaven to dynamic light

Luminous ceilings provide spacious room impressions and can provide different types of lighting. Besides this, they are, however, also metaphors of the natural sky and a mirror of an aesthetic and architectural debate. The historical observation of ceilings reveals that the image of heaven, which reached a theological culmination in the luminous Renaissance stucco techniques, turned into large-scale light emanating surfaces. Even if the luminance of contemporary LED screens has increased intensely and thereby creates a point of attraction, designers still look to establish a pictorial language for an impressive appearance.

Looking Outwards: Final Project Inspiration

by guribe @ 10:55 pm

“Liquid Sound Collisions” is a project created at The Advanced Research Technology Collaboration and Visualization Lab at the Banff New Media Institute.

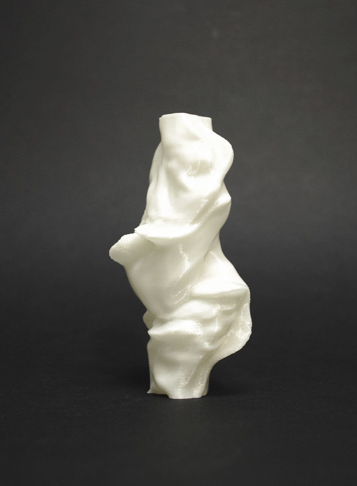
They use voices as sound and water to sculpt a 3D representation of the sound, and then used a 3D printer to create an object representing the sound.

Liquid Sound Collision is an aesthetic and interpretive study of the interactions that happen when recorded voices encounter computer-simulated fluids. In a digital environment, audio input can have a more obvious impact on the shape and distortion of iquids than in reality.

Each study sends two words that can be thought of as poetic opposites –
chaos and order, body and mind – as vibration source into a fluid
simulation. The waves created by the sound files run towards each other,
they collide and interfere with one another’s patterns. The moments of
these collisions are then translated into 3D models that are printed as
real sculptures.

The chosen words that depict dualistic world views are opposites, yet
are displayed as the turbulent flow that arises between the two
extremes.

Produced at The Advanced Research Technology Collaboration and Visualization Lab at the Banff New Media Institute.

Used Soft/Hardware: openFrameworks, MSAFluid library, Processing, Dimensions uPrint 3D Printer

More about this project can be seen here.

Next Page »
This work is licensed under a Creative Commons Attribution-Noncommercial-Share Alike 3.0 Unported License.
(c) 2016 Special Topics in Interactive Art & Computational Design | powered by WordPress with Barecity