Icicle Synthesis

by Max Hawkins @ 9:00 am 17 February 2010

Patterns in icicle formation

Icicle Formation Mystery Solved

Project 2 guribe

by guribe @ 2:04 am 15 February 2010

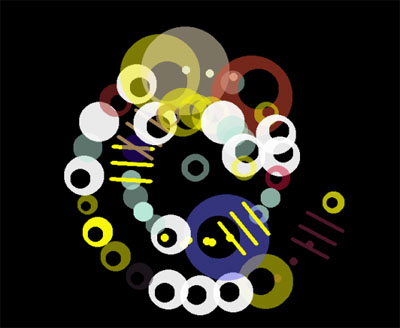
Simulating Organic Behavior through Music

Music Visualization: Erection by The Faint

Music Visualization: I\’m a Lonely Little Petunia by Imogen Heap

Music Visualization: Time to Pretend by MGMT

Where the idea came from

When looking at examples of simulations during class, I was inspired by the work of Robert Hodgin. I was interested in the way he simulated organic behaviors that were directly responding to sound. I decided to create a similar project, using my own aesthetic and my own parameters.

My work process

The first step I took in developing this program was finding a library that could analyze sound. I found a library by Krister Olsson called Ess. This library “ allows sound sample data to be loaded or streamed (AIFF, WAVE, AU, MP3), generated in real-time (sine, square, triangle and sawtooth waves, white and pink noise), manipulated (raw or via built-in filters), saved (AIFF, WAVE), analyzed (FFT) or simply played back.” I used it to analyze the sound using Fast Fourier Transforms to isolate the volume components of each freuency.

After discovering this library, I found source code for two other projects that I used to help me program the project: Flocking by Daniel Shiffman and Input FFT from Olsson’s Ess library website.

After reading and understanding the code, I was able to use the basic ideas from these projects in my own work, merging, tweaking, and rewriting the code to fit my own vision.

My self-critique

Although I was happy with the results, there are a few things I would have done if I could work further.

First of all, my original intention was to have the boids flock with one another. However, I adjusted the boids’ velocities to match the frequencies volume in a way that made it difficult for me to figure out how to implement the flocking behavior.

A second change I would make would be to make the visuals appear more spatial. Although I am content with the current aesthetic, it is a bit flat looking.

Overall, I was extremely excited with this project and content with my results.

Robotic arts event, Wednesday 2/17!

by teecher @ 3:03 pm 13 February 2010

Dear Students,

Robotics artist Eric Singer will make a public lecture/performance this Wednesday at CMU!
The lab I direct, the STUDIO for Creative Inquiry at Carnegie Mellon, is partnering with Professor of Art Melissa Ragona to bring a series of artist lecture/performances to Pittsburgh this spring. Coming up this Wednesday (February 17th) at 6:30pm is a presentation by leading robotics artist Eric Singer, founder of LEMUR (the League of Electronic Musical Urban Robots). All events in the STUDIO, room CFA-111 in the College of Fine Arts building. Events are open to the public and include snacks. Full details in this PDF.


Looking-Outwards Freestyle:Goldfish Music Box

by kuanjuw @ 1:16 pm 7 February 2010

This is a cute and cool iPHONE application by Francis Lam.
The website is here

iPhone App: Goldfish Music Box from Francis Lam on Vimeo.

This application captures images from the built-in camera, then converts color in to music.
It can turn the goldfish or any moving objects into an interactive music box.

Learning some math, any suggestions?

by jsinclai @ 4:35 pm 31 January 2010

Hey all,

So I’m certainly a bit behind on my computer graphics and math skills. I haven’t taken any math since single variable calculus in High School, and I’ve never taken a graphics course. Anyone know any good tutorials or crash courses from which I could learn some of the principles?

I might even consider buying a textbook if it’s a really useful reference.

Thanks for any direction,
~Jordan Sinclair

Looking Outwards – Interactive Physics

by jsinclai @ 12:46 pm

Crayon Physics Deluxe from Petri Purho on Vimeo.

Crayon Physics is an incredible game that applies the laws of physics to your drawings. Balls roll, hammers hit, see-saws catapult objects when a heavier one is placed on the opposite side, and you can even create intricate pulley systems. I really like the concept for the game because all interaction and creativity is left to the user.
This feels like a child’s dream come true; what if my crayon drawings came to life? (Ironically, there is a game called “Drawn to Life,” but it doesn’t seem to offer this same realization of creative objects). The user is not constrained to anything but their imagination and the (simulated) laws of physics.

http://fantasticcontraption.com/
Fantastic Contraption seems like another fun interactive physics game, except here you use predefined physics objects to achieve your goal. What I like about this one is the community tools available for people to share their creations and contraptions.

This post was inspired by the following videos:

(2:00 to 3:30) This first video shows a demo of “Half-Life 2” at the E3 Expo in 2003. I remember being in complete awe after seeing life-like physics in an interactive environment.

This tech demo shows “Digital Molecular Matter” which simulates the physical properties of different types of materials.

Looking Outwards Freestyle

by davidyen @ 7:11 am 27 January 2010

I wanted to share two things, the first just came out but has started to make the rounds in the design circles, Feltron’s Annual Report for 2009. http://feltron.com/index.php?/content/2009_annual_report/
Nicholas Feltron has been publishing Annual Reports on his own life for 5 years. They’re wonderfully designed and feature some computationally driven data visualization, and some personal not-data driven stuff that makes the whole thing more interesting to read. I really liked how he presented quotes describing him as data, in this years report.

The second is the computational artist who helped Feltron with the processing work driving his visualizations, Zevan Rosser. http://www.shapevent.com. His archived Processing sketches are really interesting and exploratory, have a look: http://www.shapevent.com/archive.html.

An effective graph

by Max Hawkins @ 6:00 pm 25 January 2010

Easy Trends (Google)

by Michael Hill @ 12:58 pm 22 January 2010

I was just playing around with Google Trends, and thought I would share a few things.  First, with such a huge background of information, it is pretty easy to determine which trends are seasonal:

Blue: beach, Green: ski, Yellow: snow, Red: Rafting

The Second little bit if information is that all “trends” can be downloaded as CSV’s, making all of this data easy to parse.

Looking-Outwards: New Data Sources

by Michael Hill @ 12:33 pm

http://www.guardian.co.uk/technology/page/2009/jun/17/1

The Guardian hosts all kinds of data sets on their site.  The formats are all over the place, but they can easily be converted.

Also, a few the the Guardian’s sources come from this site:

http://www.data.gov/catalog

From their site:

About

The purpose of Data.gov is to increase public access to high value, machine readable datasets generated by the Executive Branch of the Federal Government.

As a priority Open Government Initiative for President Obama’s administration, Data.gov increases the ability of the public to easily find, download, and use datasets that are generated and held by the Federal Government. Data.gov provides descriptions of the Federal datasets (metadata), information about how to access the datasets, and tools that leverage government datasets. The data catalogs will continue to grow as datasets are added. Federal, Executive Branch data are included in the first version of Data.gov.

Participatory Democracy

Public participation and collaboration will be one of the keys to the success of Data.gov. Data.gov enables the public to participate in government by providing downloadable Federal datasets to build applications, conduct analyses, and perform research. Data.gov will continue to improve based on feedback, comments, and recommendations from the public and therefore we encourage individuals to suggest datasets they’d like to see, rate and comment on current datasets, and suggest ways to improve the site.

We are interested in hearing your ideas and comments about Data.gov. Please contact us and share them.

Goal

A primary goal of Data.gov is to improve access to Federal data and expand creative use of those data beyond the walls of government by encouraging innovative ideas (e.g., web applications). Data.gov strives to make government more transparent and is committed to creating an unprecedented level of openness in Government. The openness derived from Data.gov will strengthen our Nation’s democracy and promote efficiency and effectiveness in Government.

Looking Outwards – Information Visualization

by guribe @ 8:02 am 18 January 2010

Although this project is not interactive, I find the images captivating. It was created by Colombia’s Spatial Information Design Lab and presented at the MOMA.

The project aims to depict the impact of incarceration on certain neighborhoods in New York City, mainly focusing on Brooklyn.

Guided by the maps of Million Dollar Blocks, urban planners, designers, and policy makers can identify those areas in our cities where, without acknowledging it, we have allowed the criminal justice system to replace and displace a whole host of other public institutions and civic infrastructures.


More information about the project can be found here and here.

GML to robot

by teecher @ 10:09 am 13 January 2010

Hey check this out:

Robotagger: GML + ABB4400 from Golan Levin on Vimeo.

caryn- looking outwards 0

by caudenri @ 8:38 am

http://mergers.galaxyzoo.org/
Screen capture from the Java applet
While its not technically media art or design, I wanted to talk a little about Galaxy Zoo Mergers, a crowdsourcing effort by a website attempting to classify galaxy collisions. Take a look at the “Science” link on the site for an in-depth explanation of why they are doing this project and what its benefits are to science- but in short, to better understand galaxy collisions, scientists need accurate simulations of galaxy collisions and the human eye is better at helping create these than a pure computer simulation. They’ve created a Java applet which works like a game to have the user tweak simulations of galaxies to look like actual pictures of galaxy collisions. I thought this was an interesting solution to crowdsourcing- by making the participation fun and engaging, people are both entertained and feel that they are contributing something unique and important to the world of science.

Jon Miller – Looking Outwards 1 – mobile phone usage collage

by Jon Miller @ 8:17 am

This application, which runs on mobile phones, visualizes a person’s mobile communication usage patterns. Each connection is converted into a graphic based on its duration and type, and the results are all displayed together in a colorful, unique image.
I chose this example because I think it is a good instance of data being displayed in an aesthetically appealing, yet useful way. One can, at a glance, look at one’s own recent usage, including also the relative amounts of usage to each other, which could be useful as a type of “cellphone barometer”.
Since the rules of how to display data have become more solidified as communication design and interaction design have become more explored fields, it is refreshing to see an application which chooses a unique way of displaying information. It is unlikely, but perhaps this style will replace bar graphs for certain information.

Mobile Phone application

Source: link

caryn- project 0

by caudenri @ 5:38 pm 12 January 2010

Part A
Not sure if the iframes are working for me, if not the links should still work.

GDE Error: Unable to load profile settings

caryn_project0.0

float angle = 90.0;
float padding = 0.015;
float count=0.0;
int start=50;
 
for(int i=0; i<90; i++) {
  count=0.0;
  angle=90.0;
  beginShape();
  for (float x=5.0; x<=width; x+=1) {
    float y = start+(cos(angle)*40.0);
    x += count*padding;
    vertex(x, y);
    angle+=PI/35.0;
    count++;
  }
  endShape();
  start += 5;
}

Part B
caryn-project-0

float ballX;
float ballY;
float ballXv;
float ballYv;
 
void setup() {
  size(300,300);
  smooth();
  noStroke();
  reset();
}
 
void draw() {
  background(24,201,234);
  ballX +=ballXv;
  ballY += ballYv;
 
  ellipseMode(CENTER);
  ellipse(ballX, ballY, 10, 10);
 
  //paddle
  rectMode(CENTER);
  int px=290;
  int ph=30;
  int ppos= constrain(mouseY, 0 , height);
  rect(px, ppos, 5, ph);
 
  //test for boundaries
  if (ballX < 0) {
    ballXv*=-1;
  }
  if ((ballY  height)) {
    ballYv*=-1;
  }
  if (((ballX>285) && (ballYmouseY-(ph/2))) {
    ballXv*=-1;
  }
}
 
void mousePressed() {
  reset();
}
 
void reset() {
  ballX= 1;
  ballY= height/2;
  ballXv= random(2.5, 3.5);
  ballYv= random(-1, 1);
}
« Previous Page
This work is licensed under a Creative Commons Attribution-Noncommercial-Share Alike 3.0 Unported License.
(c) 2016 Special Topics in Interactive Art & Computational Design | powered by WordPress with Barecity