Sc2 gears is a program where users can look at star-craft replay data and compare stats between different games.
https://sites.google.com/site/sc2gears/
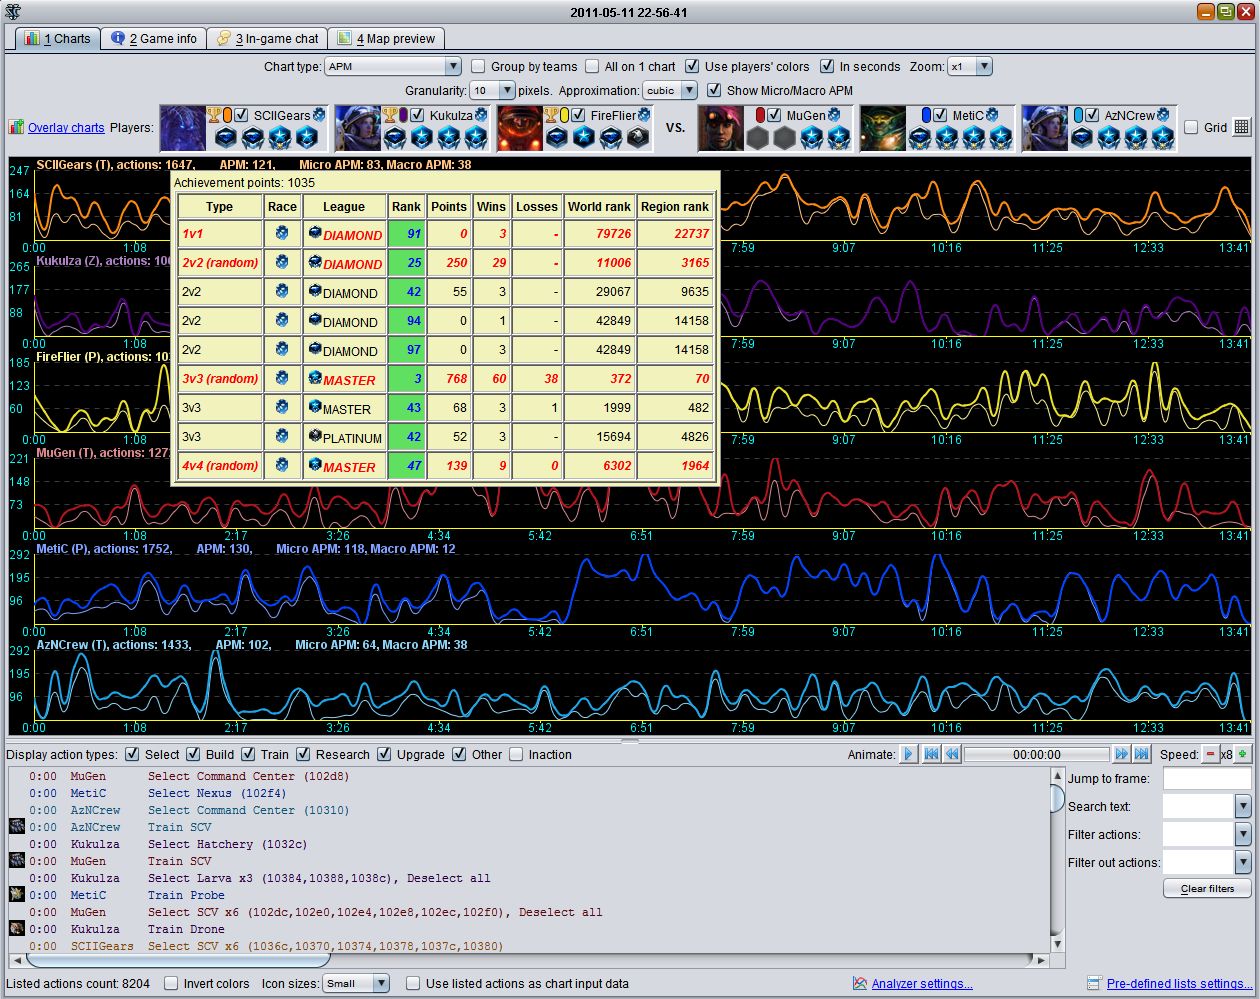
I will be using information from sc2gears, and also sound taken from the actual videos of the game like such.
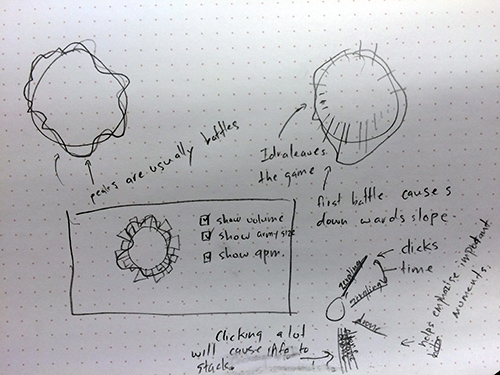
The goal of my visualization is less for analyzing but more for celebrating famous moments like Idra quitting the game. There was one game where he mistakenly thought he was losing and left game when he was actually winning. The crowd was pumped up and cheering for the battle idra was about to engage in. However, Idra left the game and the cheers suddenly calmed down and turned into silence.
There is a lot of correlation between audio and what is happening in game. I would like to explore those correlations. These can be shown by showing the army
Another factor is that the game store time-stamps of all button clicks. There will be more condensed button clicks when people just get into a fight. That can show how much the players actions speed up during exiting moments.
These are the three main data comparisons I would like to use.
– Using timestamps to show units being build.
– Showing army size over time, to see when two army fights.
– The volume of the audience from youtube videos.
The graphs will be spherical like this because they are more meant for celebration/art rather than actualy information visualization. It’s also spherical because it looks rather more scifi and that matches the aesthetic of the game.