WARNING: really bad sketch.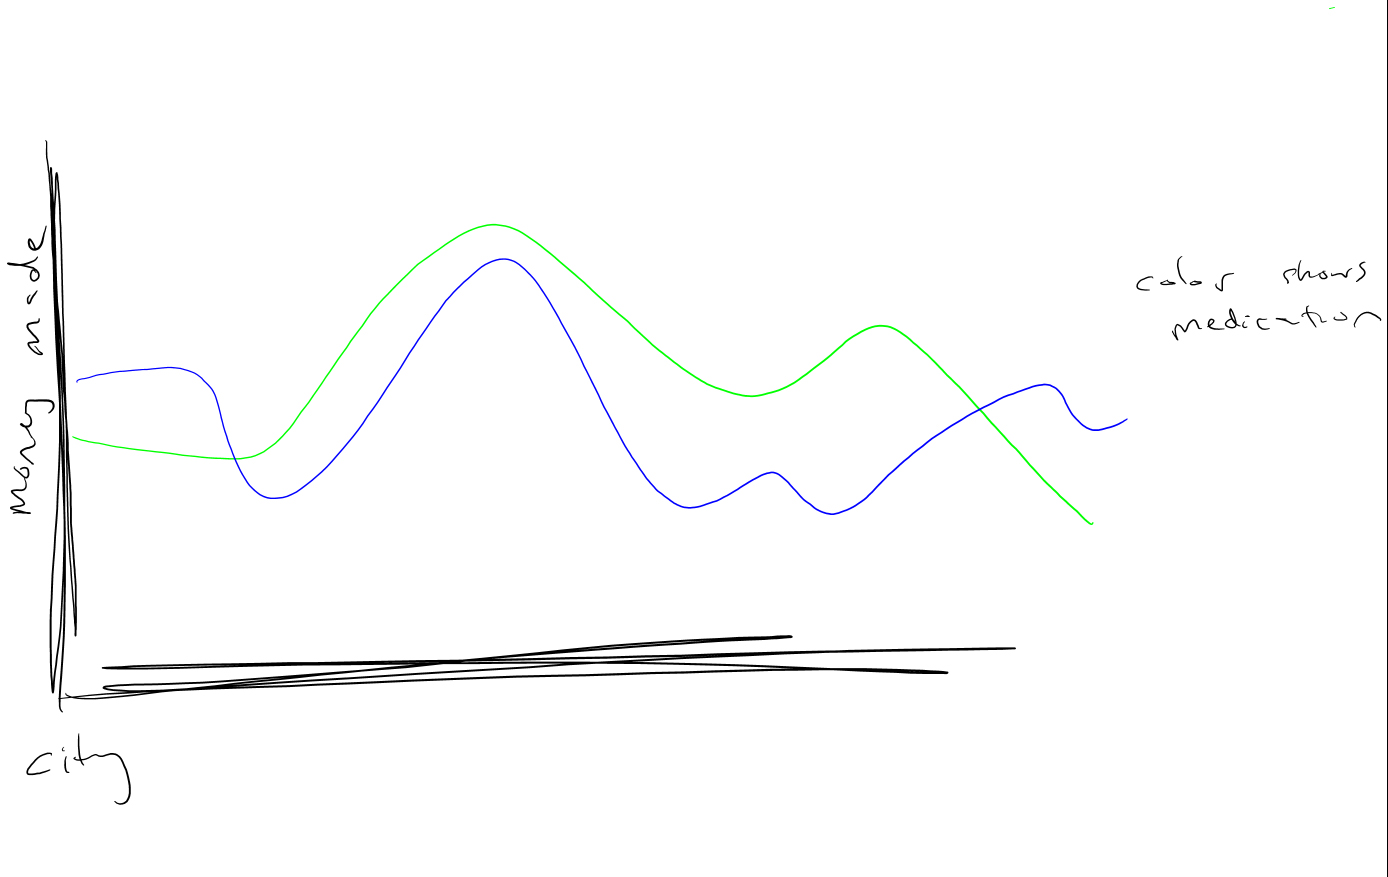

So I was going to do a basic thing with the visualization for torrenting websites, but after collecting for the past couple weeks I saw that the data is 1) not changing much at all 2) not as interesting as I thought it would be and 3) not the cleanest data for how much I’m collecting. I’d have no idea how to parse. I decided to simplify to a better database.
I was watching John Oliver and he talked about how doctors basically get paid by medicine providers to push their product. There is a website that logs all this information. I’m pretty interested in this. I want to compare this database to data that I’m still looking for that shows the quantity of sick people in each city and what their ailments are. There must be some kind of connection, right? I’m so curious. And what are the connections? If there are, does correlation imply causation?
I think this will raise some more interesting questions than my last idea so I’m running with it. In the mean time I have some awesome- I mean awful- sketches of some visuals that to me seem pretty boring and basic. What are more interesting or revealing ways to visualize this though?
As to other works that inspired me, I really liked the name visualization. I also really find cartography interesting which I guess is why I put the graph down imagining it to be similar to the name, and the map. Cartography is particularly interesting because of the geographical overlaying opportunities. I don’t know how to do that kind of thing quite yet, though. I saw a couple projects dealing with manipulating the size of the land based on population or tree growth rates. Maybe something like that?