As my primary 3X assignment, my information visualization maps the relationship strengths of each character in the Dilbert comic strip.
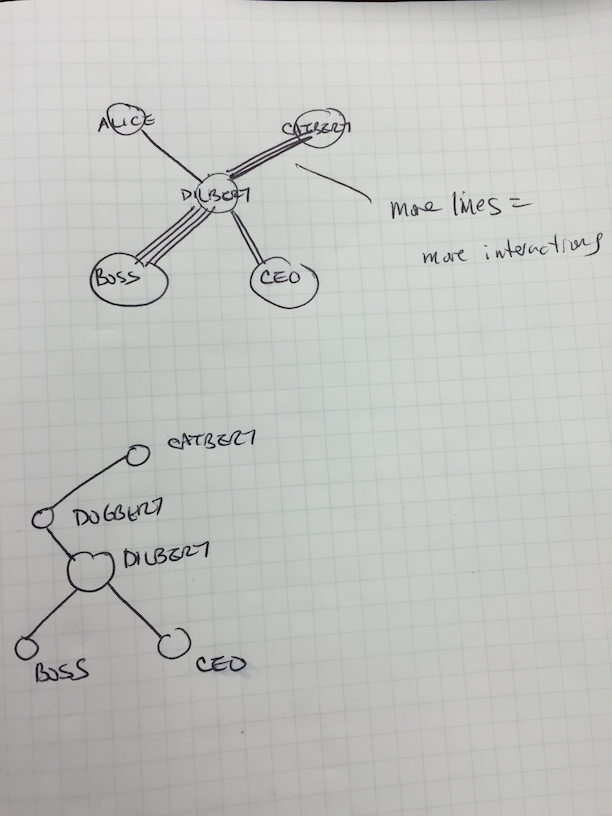
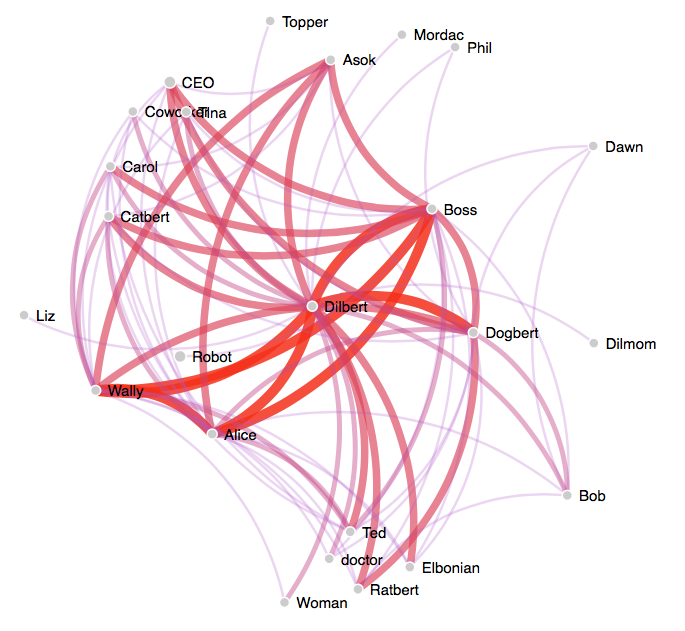
Running for close to 25 years and a favorite of mine, nearly 10,000 Dilbert comic strips have been written by author Scott Adams. Like relationships visualizations that have been done for TV show characters (see this one for the show Lost: http://intuitionanalytics.com/other/lostalgic/), I found myself curious about the relationship strength of the Dilbert characters based on the number of appearances with other characters in the comic strip. I previously scraped the transcripts after accidentally finding them at dilbert.com. I also downloaded every strip in GIF format, initially thinking to possibly manipulate the strip, but its panels varied from time to time — most of them are three panels wide but others deviate from them to include six or seven panels. So I decided to do something with dialog captured in the transcripts. It’s clear that different workers performed the transcriptions from year to year since they are inconsistent; some simply describe the scenario and provide quotes without attributing them to the characters at all, while others include the character’s name (which is more what I expected and found useful) before the quote. Nevertheless, I wrote a Python script to parse through the scraped text that contained the character references, looking for instances of names to determine if he or she made an appearance in a particular comic strip. I then compared these appearances to the concurrent appearances of others in the strip and determine the relationship strength between a pair of characters. The relationship pairs and encounter count was saved to a CSV and used by D3 to graph the network with nodes and edges. I expected Dilbert to have frequent encounters with his boss and Dogbert, for example, but I didn’t know how strong his other relationships were. There are over 30 characters that have appeared in the Dilbert strips at least once. To declutter the network graph, I removed any interaction counts less than 10 (by comparison, Dilbert and his Boss has over 1500 interactions). The edges connecting the characters were colored and thickened based on the interaction count (darker and thicker edges indicate higher number of interactions).
In addition to his Boss and Dogbert, Dilbert shares a strong relationship with co-workers Alice and Wally. And Dilbert has infrequent encounters with his mother (Dilmom; only 10 observed interactions). The generically named “Woman” is usually a character with whom Dilbert will go out on dates.
I found using D3 hard because of its relative lack of documentation. There are lots of examples, however, and I used one of the forced layout examples as a starting point. But it wasn’t obvious how the parameters worked until I just started turning knobs to see what happened. I was hoping to spread the network graph out a little bit so there’s more space between names. With more time, I would include an interactive element that would allow the user to click an edge (link) and see the interaction count between two characters, possibly shown over time.
The github link is at https://github.com/ronkim/homework32