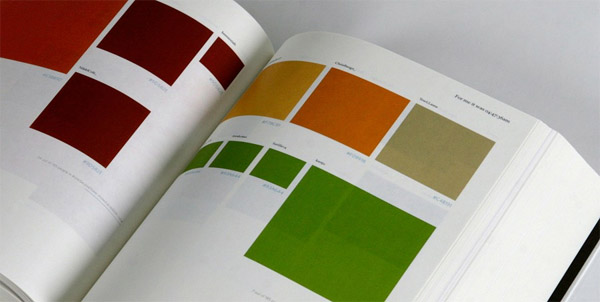
“#oneSecond [philippadrian.com] by graphic design student Philipp Adrian aggregates all the tweets sent at exactly 14:47:36 GMT of 9 November 2012.” The project comes in four volumes: a book of the actual messages, ordered by language; a book of the colors used by Twitter account, ordered by timezone; profile description, ordered by Klout score; and profile name, ordered by number of tweets sent.
There are two things I love about this project: that it seeks to expose the detail in a huge data set instead of reduce it to summary metrics and the different relationship of variables for each book. I feel like many infographics are reductive and seek to summarize the data by averaging everything together; #oneSecond instead preserves the detail of an enormous data set and truncates the data instead. The variables also seem logical and thought out — they aren’t enormously complex but they feel deliberate.
I can’t immediately think of anything Adrian could have done better. I love the print format and the concept. Maybe he could have added more variables, but I there are definitely diminishing returns on simply adding variables for the sake of exhaustively finding relationships.
Adrian doesn’t explicitly talk about his influences, but visualizing and measuring Twitter definitely has a rich history — not particularly surprising since it feels like an unfiltered hive mind.
Metrico is a game that both uses the typical infographic aesthetic as well as uses metrics as a control system. The game itself is a puzzle platform that tracks the input of the player — by manipulating the input the player can control the map (such as by jumping multiple times to raise a platform).
I find this project to be particularly inspiring because of its interactivity. Many data visualizations and infographics present the data but stop short of leading the viewer to action. In Metrico, the loop is closed; the level is the data, and the way through the level is to change the data.
It’s hard to give a proper critique without playing through the game myself, so I’ll talk about some things that I would want to see in it. I’d love to see social metrics, so that you aren’t isolated when playing the game but can use data to quantify your performance in relation to others. I would also want the game to be educational in a way and build up from simple data to more complex data; maybe later levels would not be just about how many times you jump but about the relationship between different metrics (such as maintaining a ratio of one jump per two projectiles.)
The most obvious influence is platform games in general, a genre that is always simple at its core but people always manage to find a new twist for. Data visualization has also always been an integral part of games (such as tracking army growth in Starcraft), and Metrico does a nice job of flipping this part of the game.