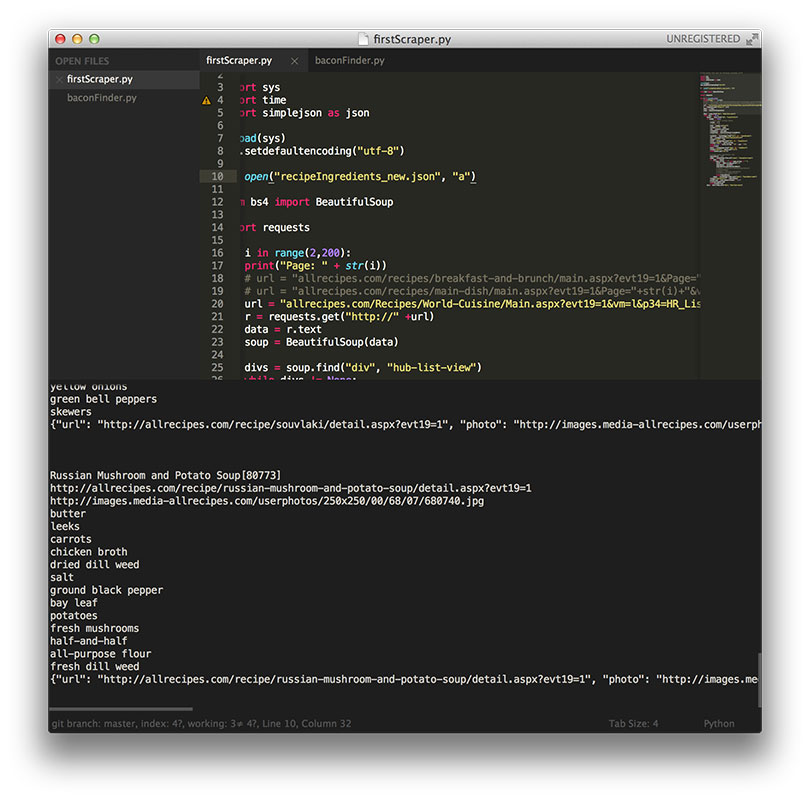
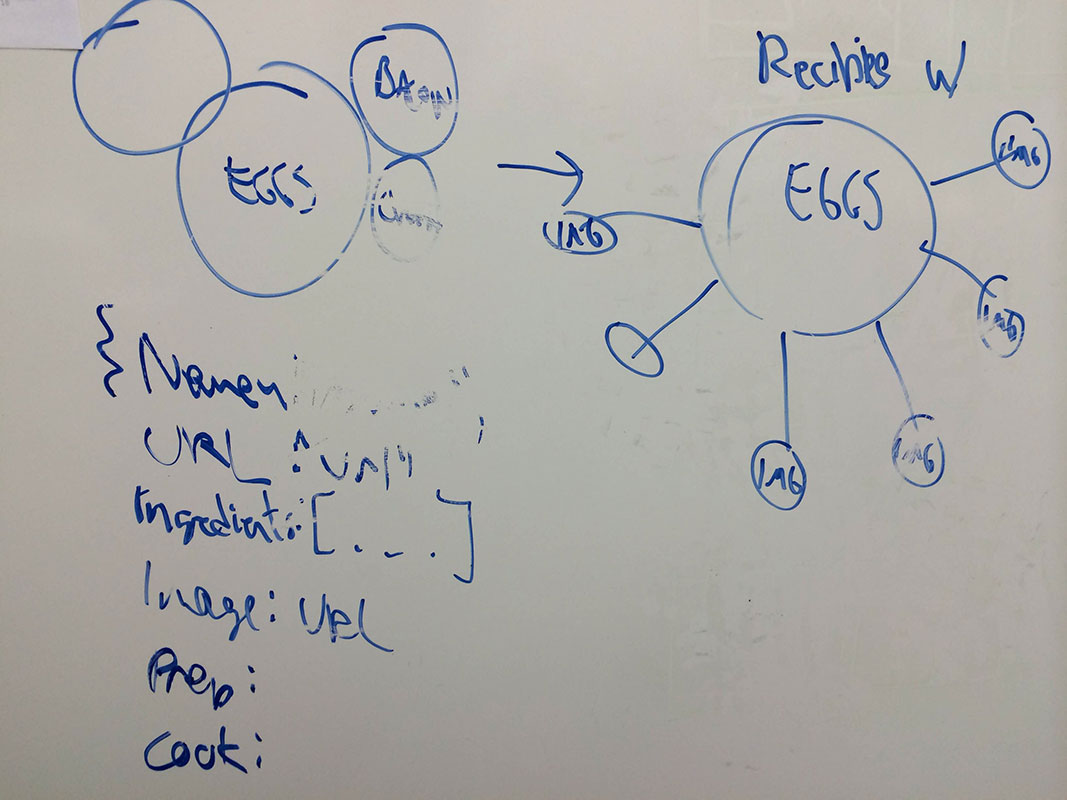
For this project, I decided to scrape AllRecipes.com and find out which ingredients popped up the most frequently, how they were connected to other recipes, and most importantly, how many degrees they were away from bacon. I wrote the scraping script in Python using the beautiful soup library and simplejson, which was all new to me. After scraping some data, I realized that the ingredients list was not normalized. The list contained various versions of water, butter, and other common ingredients.
I set out to look for an automated way to pre-process this information and came across a natural language processing library for Python called NLTK. From there, I learned about how to tokenize strings, tag them, and interpret the coded tags. What I was looking for was a way to distinguish nouns from the rest of the ingredients. For example, “Cold Water” should just be “Water”. Unfortunately, NLTK tagged both “Cold” and “Water” as nouns, so I ended up keeping my original data.
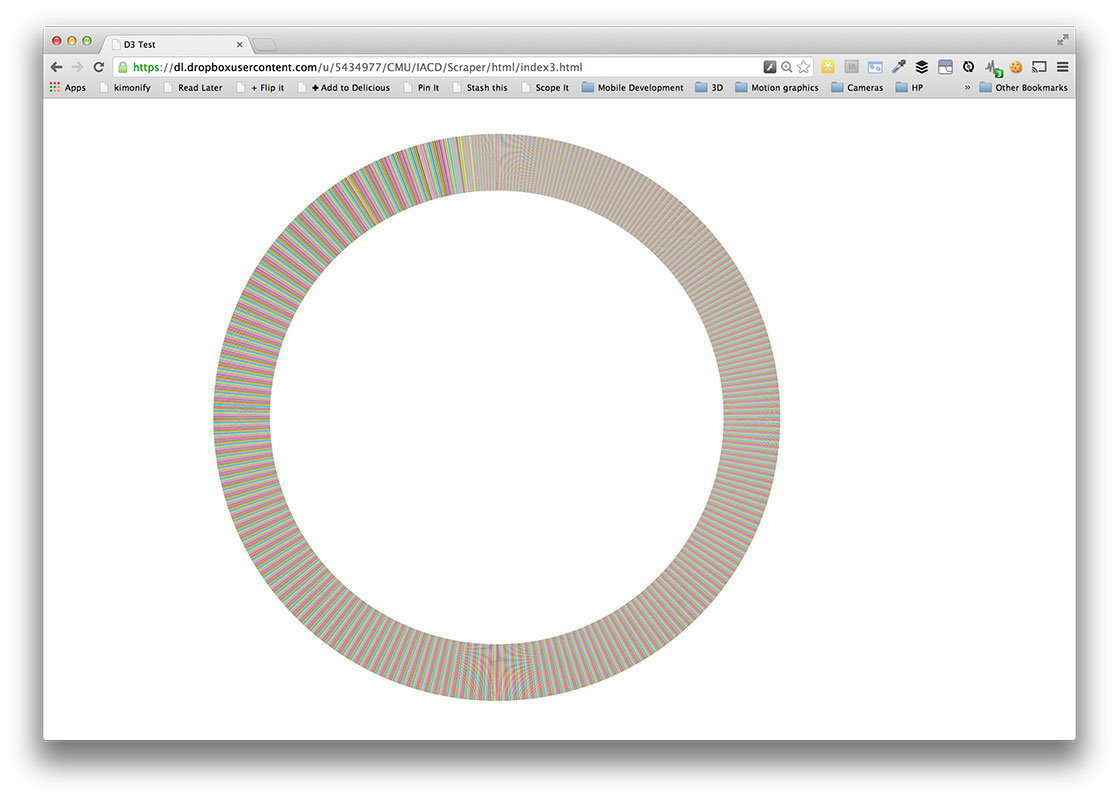
I went on to attempt a D3 visualization without much luck. No matter what I tried, nothing would display on screen. Turns out that it was an issue with the way the Javascript calls things asynchronously. Unfortunately I wasn’t able to get the interactivity I wanted, but it does display slices of ingredients on screen.
Link to visualization: https://dl.dropboxusercontent.com/u/5434977/CMU/IACD/Scraper/html/index3.html
Github: