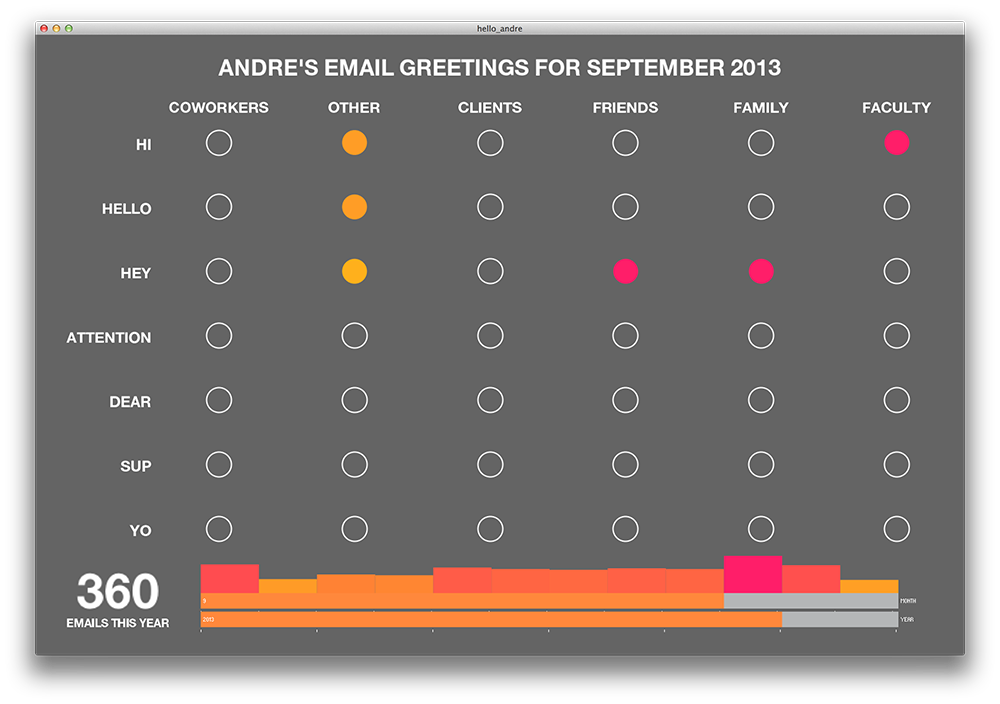
Every email starts with a greeting, and this project is the culmination of 6 years of just that, mapped across various categories of people and formalities.
This project uses data email data downloaded from my Google App’s account. The data spans back to mid-2008, which is when I purchased my domain and made the switch from a gmail address to my andrele.com email address. Email is something that is very interesting for me because of the frequency of its use, and the variety of people that I interact with using it. Unlike social media such as Facebook or Twitter, my emails tend to be crafted with care and special attention paid to the greeting and closings.
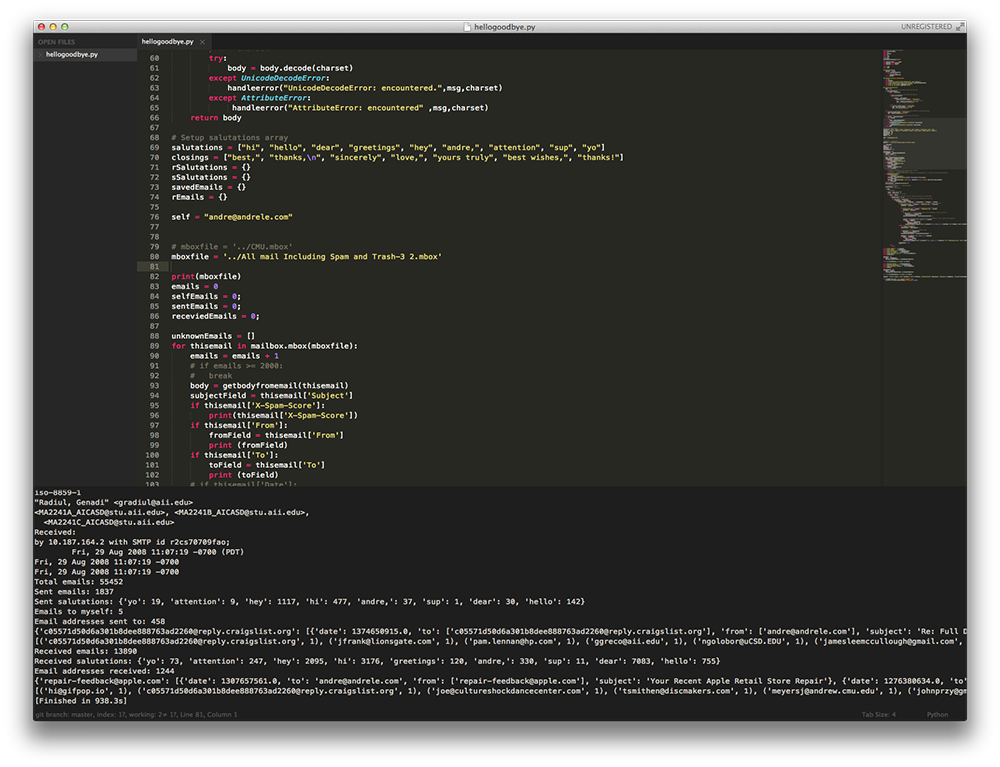
As I progressed through this project, I learned that not only did I have too much data to work with (8.9gb of email data alone!) but it was also not normalized. My python scripts that I hacked together to parse the data kept failing with obscure errors. While the data itself is simple, it took a lot of debugging for me to pull out usable data from the huge dataset that I obtained. Throughout the process, I learned quite a bit about Python, character encodings, regular expressions, and more. If I had more time, I would have liked to explore alternate ways of displaying and linking this information, how it correlates to other external sources of data, and possibly included types of closings in addition to the salutations within the emails.
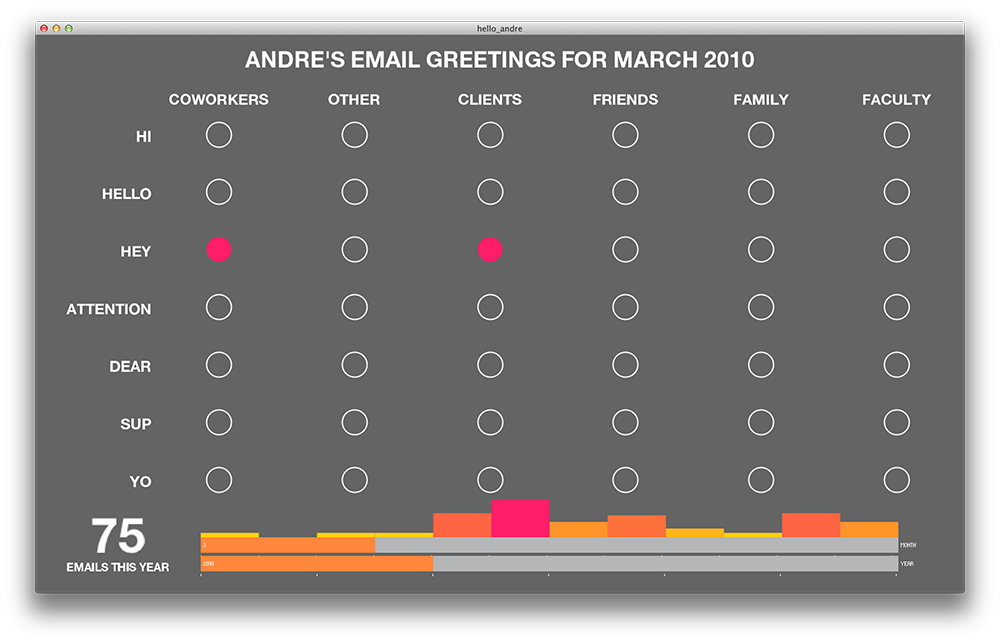
Throughout the data, I found quirky data points that caused me to reflect on my life at that point. For example, what was I doing in March 2010? It seemed like it was all work and no play.
Below you can find some of my process work. I started out with just pulling data and comparing the numbers in the command line.
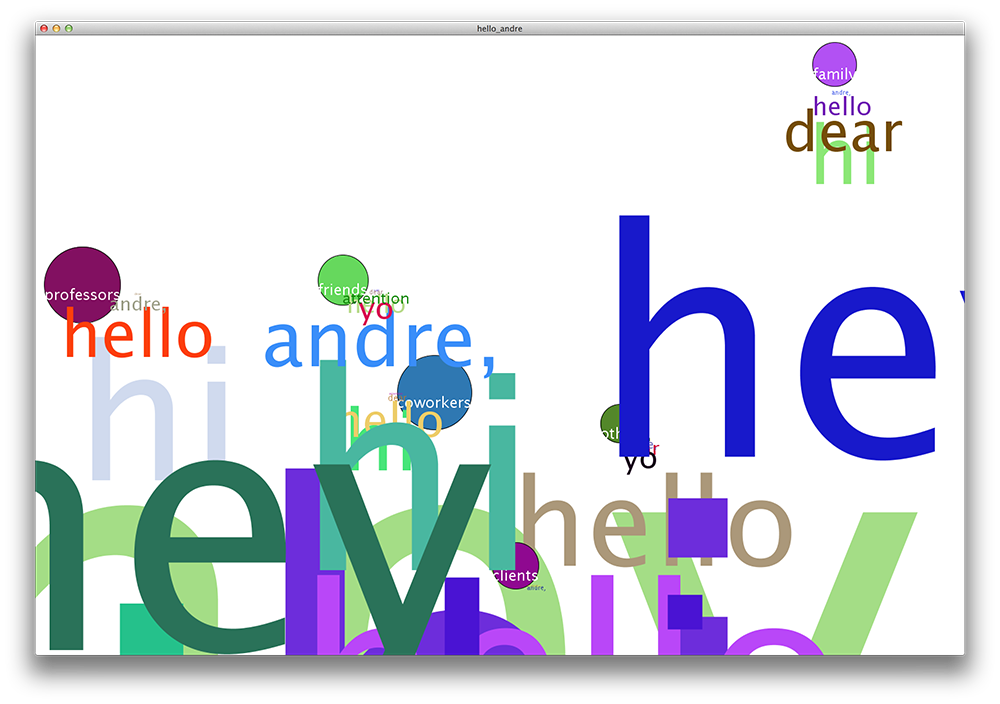
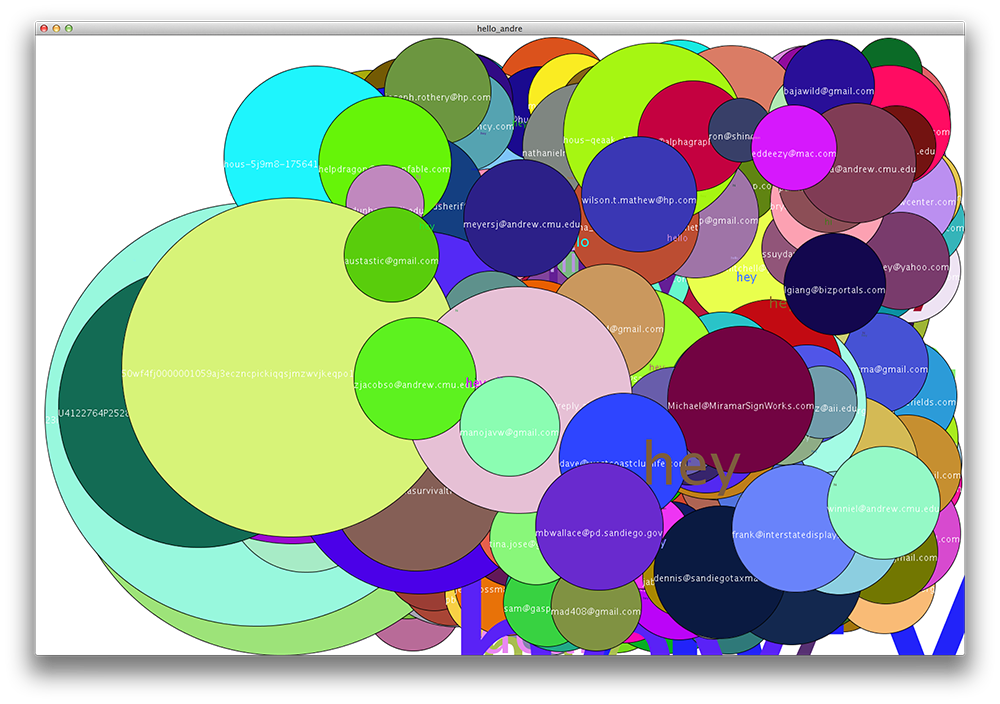
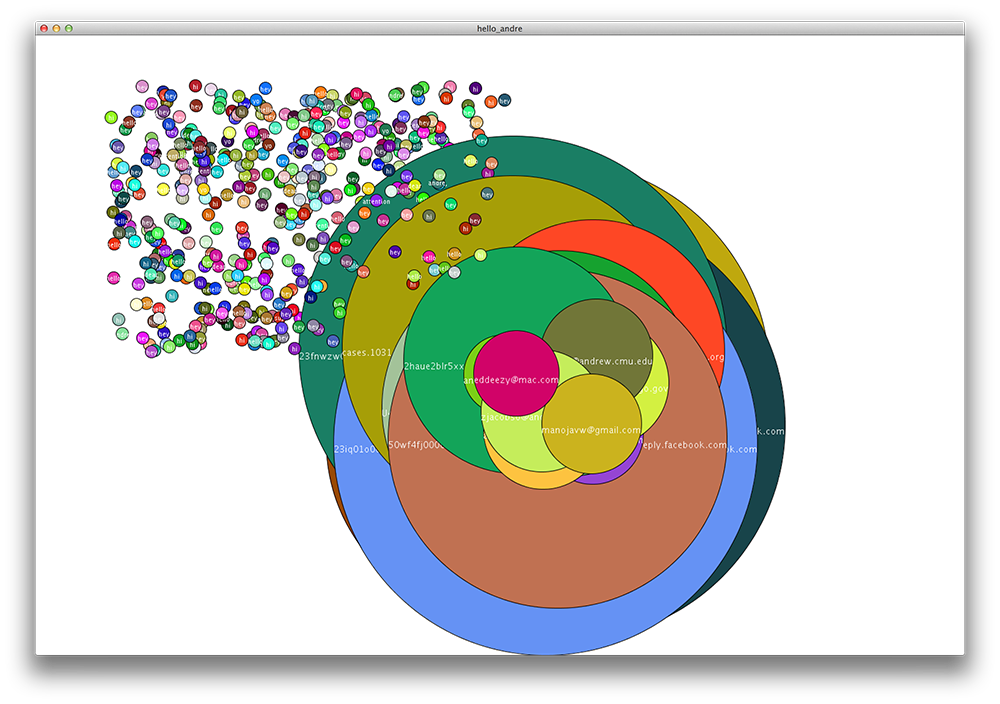
Then, I tried mapping some of the attributes that I discovered to circles and movement. It ended up looking horrible, but at least I got a feel of the range of variability that could occur in the data. This helped me narrow down which parts of the data were interesting enough to visualize further.