From January to March, I kept track of certain consumables I ate and drank as well the time I spent on certain tasks. The resulting selfie can be seen at the following URL:
http://iacd.ajrussell.ca/selfie/
This project was built entirely in HTML, JS, and CSS. Raphael.js was used for drawing, and jQuery.csv was used for reading in CSV files from AJAX calls.
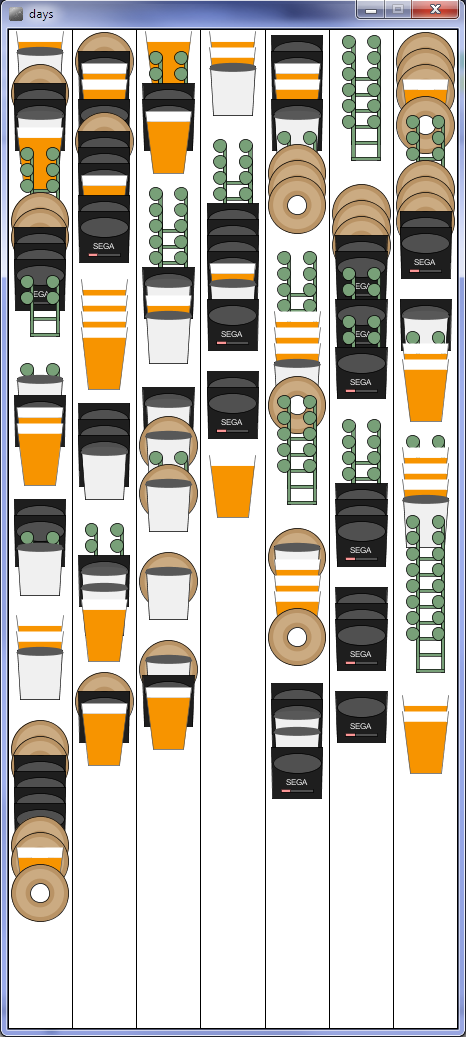
I went through a few iterations of this project. First, I thought I would show a weekly calendar to represent my habits. However, I did not like where it was heading. Instead, I got the idea that I could use a sankey like visualization to show a timeline. I started some simple sketches and implemented a basic version in JS. I wanted each branch to represent a single time I ate a bagel or drank a coffee, however, the entire timeline was two months, and a coffee takes just one hour to drink. This means that each branch was only a small sliver before joining with the main trunk. I finally decided that the trunk should just grow every time an event happened.
Initial Weekly View
![IMG_20140324_192342[1]](http://golancourses.net/2014/wp-content/uploads/2014/03/IMG_20140324_1923421.jpg)
![IMG_20140324_192357[1]](http://golancourses.net/2014/wp-content/uploads/2014/03/IMG_20140324_1923571.jpg)
Sketches of the Sankey