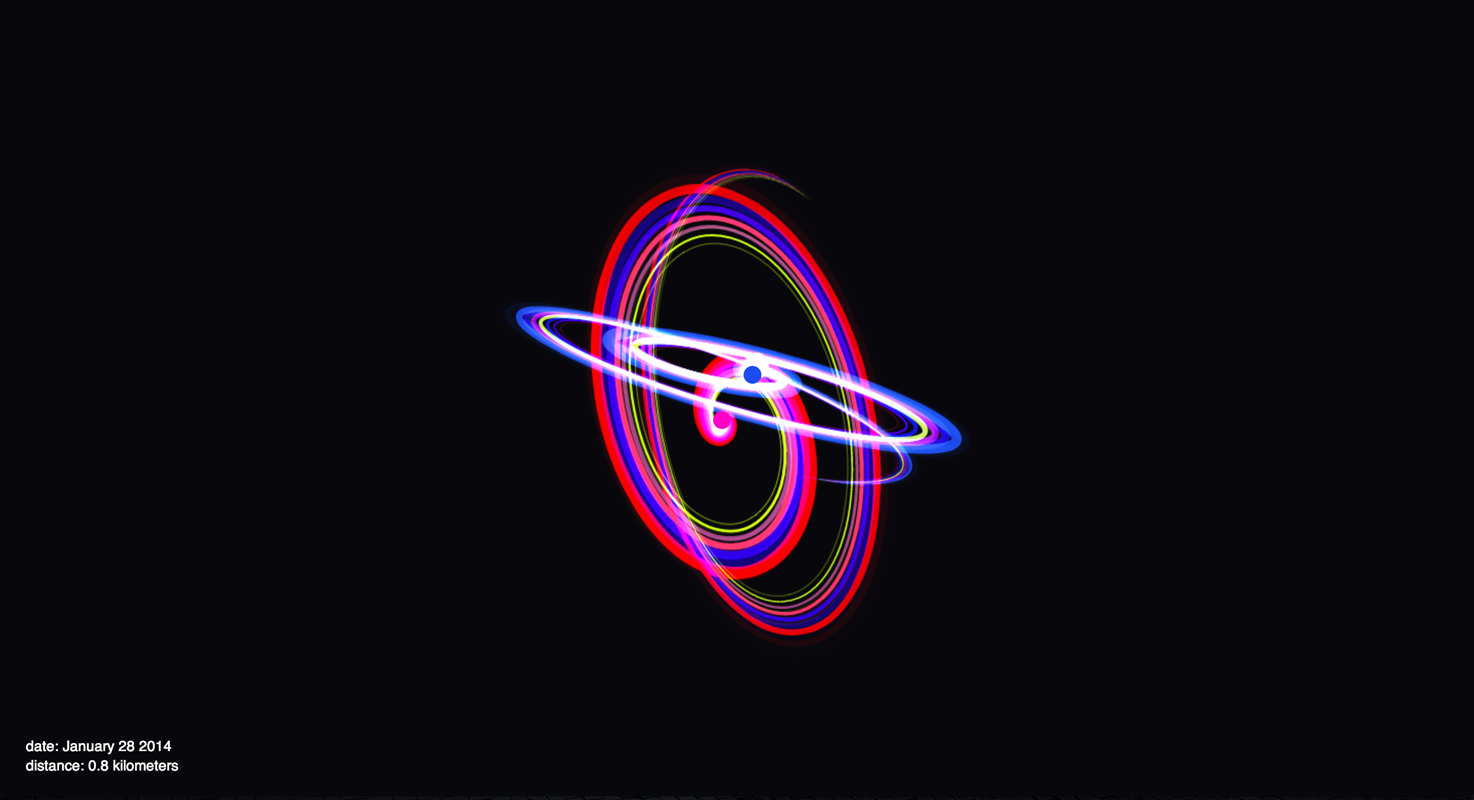
 The vision I had for this project was to tell a love story through the use of personal data. The closer you are the more intense the reaction and as you drift apart into the cold reaches of space, energy is lost and loneliness sets in. That was the idea anyway. What was actually created was a screensaver for the web. Bright colors and fast movements that draw the eye, distracting from the data hidden below.
I used a D3JS’s Force Layout, and the HTML 5 canvas to create the visualization. Much of the fancy eye candy was drawn from a project written by Daniel Puhe, which I modified to meet the needs of my project. The data was collected using OpenPaths running on my cell phone and that of a very nice female volunteer in my graduate cohort.
Visually the project appears more or less the way I originally thought of it. Some elements require a bit of tuning, such as acceleration values and linear speeds. But that being said, the final result doesn’t elicit the emotional draw that I was really aiming for. The introduction I added before the visualization helped set the stage a bit better, but I think the movements in the actual visualization are too fast to allow the viewer to gain a sense of what is going on. It’s like playing a movie in super fast forward.
Source code: https://github.com/jeffcrossman/DataLove
Live Demo: http://sandbox.jeffcrossman.com/datalove/