Tweetable one-sentence overview: A chrome extension that visualizes your browser history as a favicon stack.
Github of the Chrome extension
The Million Dollar Home Page – another internet pixel art project recommended by Golan
Background
I decided to dig deep into my browser history data for my data visualization project. Because I spend so much time online everyday, doing all sorts of things from working to socializing to just aimless wandering, I thought browser history alone could narrate a significant portion of my life and what was on my mind. A plus of using browser history was that the data was nice and easy to obtain. Therefore I could skip the trudge of collecting and cleaning the data and focus on the content itself.
Process
My initial idea was to create a library (of books) of all webpages I viewed. I was curious about the equivalent amount of reading I would have done if all the webpages I had viewed were books. I was planning on creating a book for each site visited, and the thickness of the book would be porportional by the total word count of all pages viewed under the site. I went ahead and downloaded raw html files of all pages in my history, keeping track of byte count in each file (i.e. file size). While doing so, it became obvious that I also needed some sort of images for my book covers. I thought about favicons – low resolution icons associated with sites – and was happy with the solution because favicons are so recognizable and easy to scrape. Thus this is what my library ended up looking like:
(built with Three.js. The environment was fully 3D. To the left of each shelf is the book Lord of the Rings: Return of the King. The conclusion was that every week I read at least ten times as many words as those in LOTR: return of the King. )

There where several things that I wasn’t quite satisfied with the book visualization. Foremost I found a glitch in the way I decided the byte count of pages, and thus the word count was dubious. (Many pages I scraped had length 0 which was apparently due to HTTP request failure, though I did not handle the case.) Secondly the frame rate was kind of poor (10-20 fps when navigating), which was understandable because I was dealing with 10k+ cubes in browser. Lastly the favicons did look a bit ugly due to the low resolution.
In the process I accidentally created the graph below… I was trying to draw all favicons into divs so that I could fetch their dominant colors with ColorThief for something else. It was a silly idea. Chrome didn’t like running the expensive function over my 10000+ favicons at all, and I forgot to hide the divs. My laptop froze for a few minutes and sounded like a helicopter. But at the end of the wait Chrome spitted out this image:
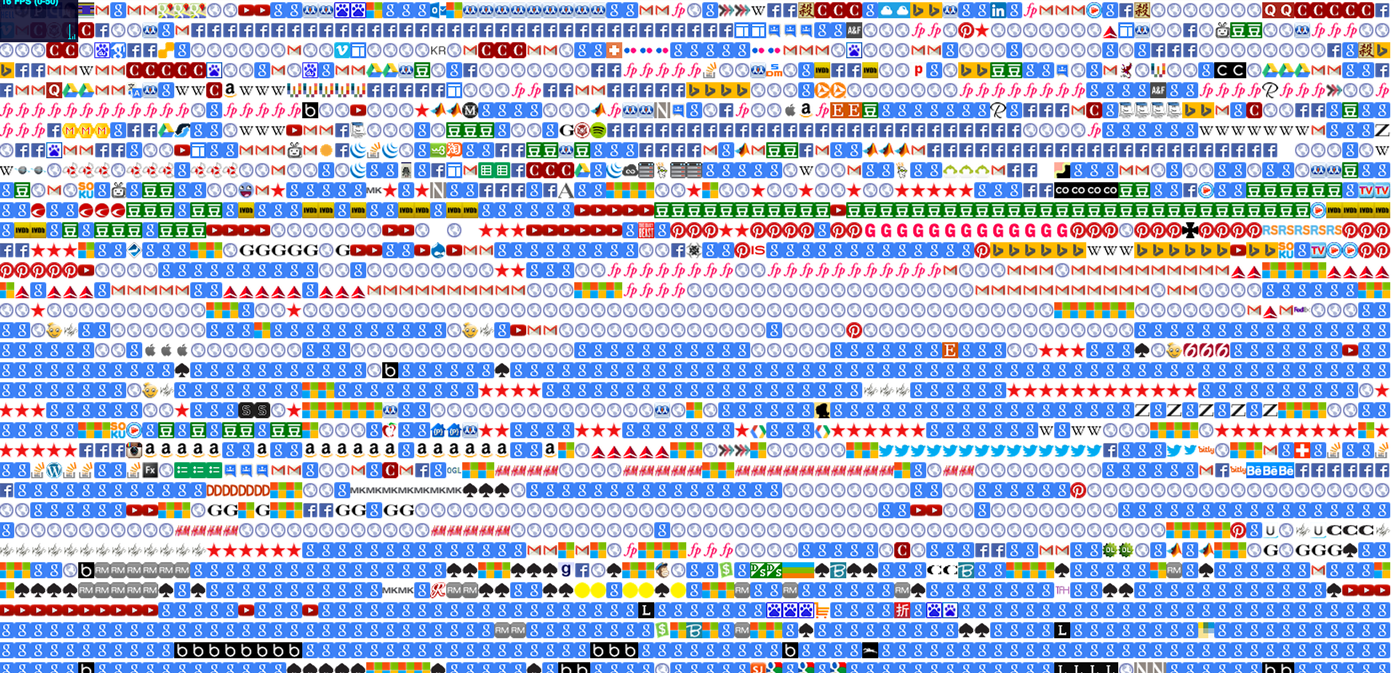
This side product immediately caught my eyes. I realized it could become something more interesting than the book visualization. The concept was so simple – a favicon for each visit. There was no extra layout trick at all, just divs after divs after divs. Yet I was really amazed by the patterns that naturally emerged from the grouping of favicons. For instance I obviously used google A LOT. There were also subtle behaviors like me jumping between katespade.com and google shopping to compare the best price offered for a handbag:
![]()
I was excited about this accidental discovery but not sure if I should switch. On Tuesday, after discussing my two ideas with Golan, who also seemed excited about the favicon visualization, I made up my mind to go forward with the favicon stack. Two days later, after frantically coding to better performance and manually cleaning up the scraped data (another bad bad idea), I had a working version – a reasonably responsive page filled with a crazy amount of favicons separated by date tags.
The result
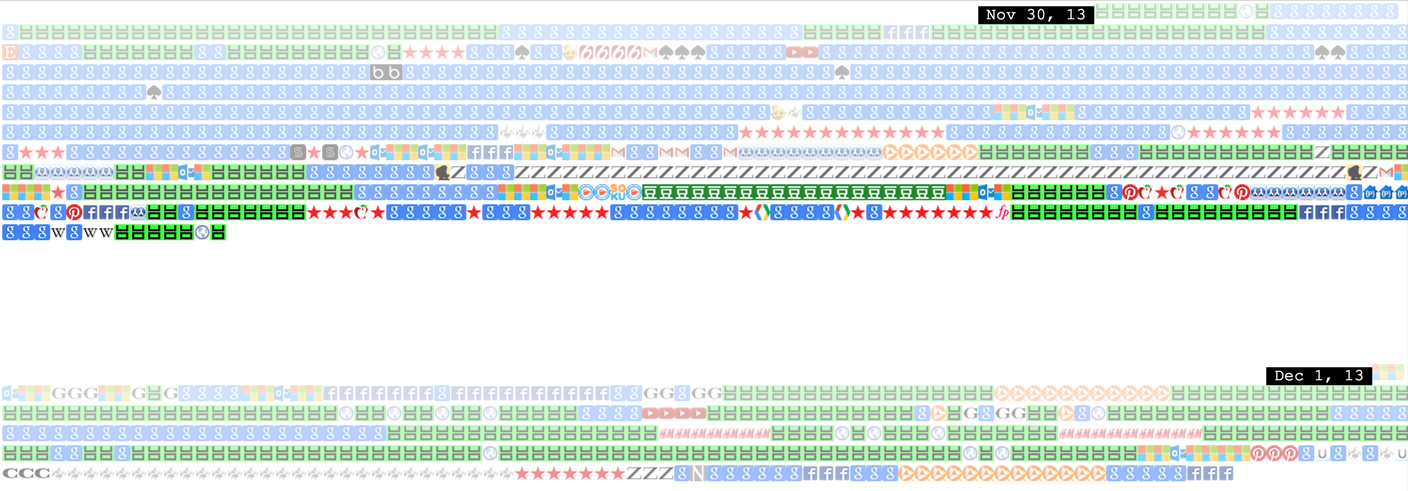
![]() (Click to see the full 2842×25455 screenshot.)
(Click to see the full 2842×25455 screenshot.)
Checkout the demo here.
The result doesn’t look much different from the earliest version, though I included tags to mark up dates. I also implemented very minimal interactivity. You can hover over a favicon to see the title and accessed time of its associated page, or click on the favicon to go that page.
Curious about how often I gave up sleep for surfing the net and if I was being productive at all, I added a day / night toggle. You can hit the ‘h’ key to show visits happened between 12:00AM – 7:00AM. Interestingly enough I found I quite frequently stayed up doing online shopping, especially around Thanksgiving…
(UO = urban outfitters. red star = macy’s. Z = zara. The ‘g’s here are mostly google shopping.)
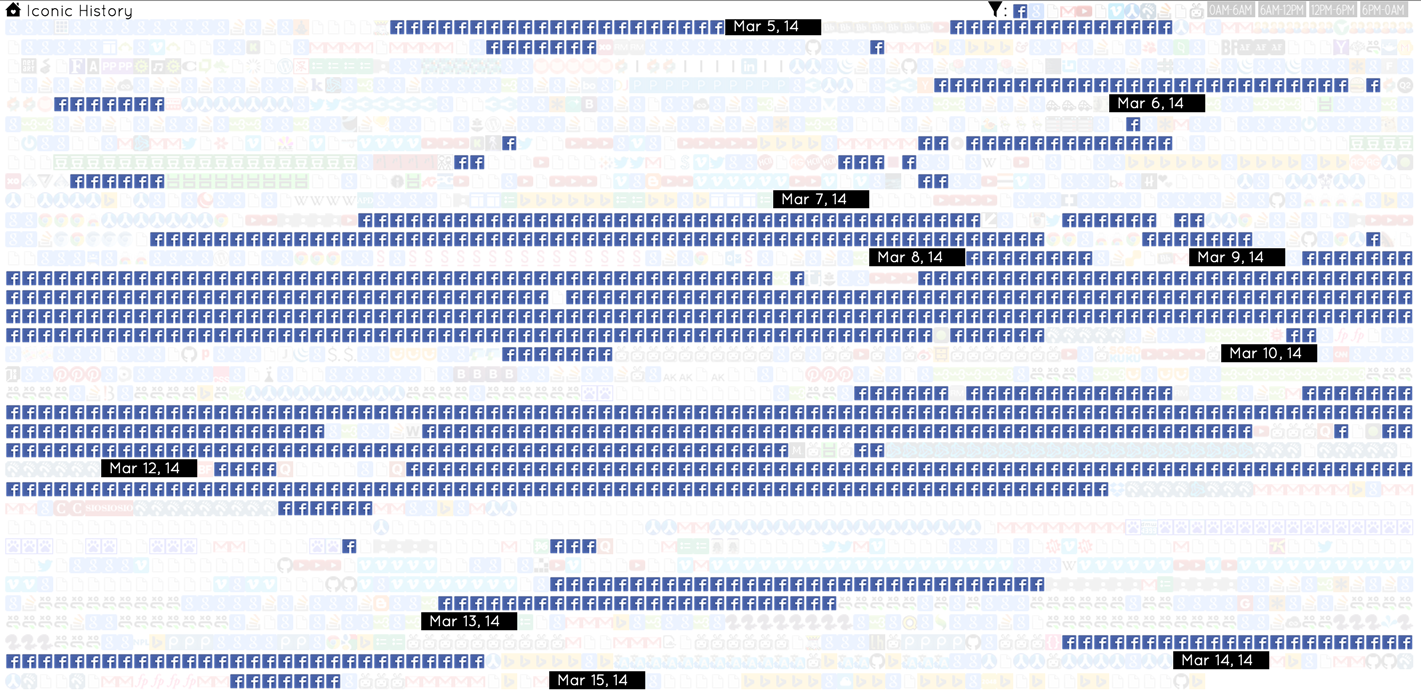
But I did stay up for productive reasons too. For instance here is when I pulled an all-nighter for the anitype assignment. (The blue dots are www.anitype.com)![]()
The Chrome extension
Many people pointed out in critique that the favicon visualization should be a chrome plugin. So I turned the project into a chrome extension during spring break. You can find the unpacked extension here. The github page has instructions on installation and usage.
Chrome keeps all its history in a local sqlite3 database and it can be accessed through a friendly API. Chrome also caches website favicons in a separate sqlite3 database, which can be even more easily accessed through chrome://favicon/. The existence of these two APIs makes scraping history data almost a trivial job, though sadly I did not look into them until after the critique. Another very bad bad idea. Anyways, for the extension I revamped the code to take advantage of these APIs. I also implemented a filter bar to allow filtering by most visited sites and different times of the day.
![]()
One key change of the chrome extension is that it shows one favicon for each ‘url’, as opposed to each ‘visit’ in my demo page. A url is a unique page address, whereas a visit is each visit paid to a certain url. Therefore multiple visits can be associated with the same url. Ideally I would like to visualize visits because ‘visit’ is the lowest-level unit of browser history. However Chrome history API only provide access to urls timestamped by their last visit time, so my only option was to visualize urls. This gives us less data, but nevertheless it doesn’t take away the indicative power of the result.