One sentence tweetable version: Stitching sky views from all over Manhattan into an infinite sky stream.
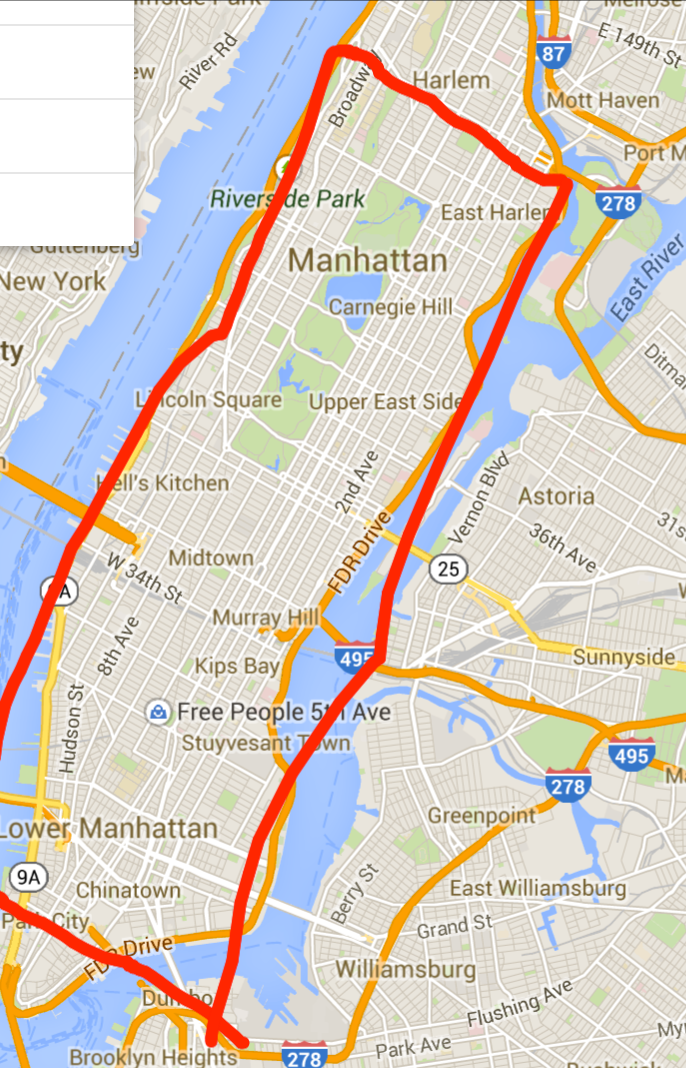
In the process of inspiration searching for my final project, I was fascinated by the abundance of data in Google Street View, a web service that grants you instant access to views from all over the globe. I really enjoyed taking street view tours in places I had never been to, or even heard of, like a lonely shore on the north border of Iceland. But as I rolled my camera upwards, I saw buildings and the sky intersecting at the skyline, and the skyline was extending way beyond the view itself, beyond the street, the city and even the country, the continent. So I was inspired to make some sort of collective sky that creates a journey along a physical or a psychological path.
Scraping
Everything starts with scraping. I wrote some python scripts to query images from the Google Street View Image API and stored metadata such latitude, longitude and panorama id in the filenames. An advantage of Google Street View Image API compared to Google’s other street panorama service is that it auto-corrects the spherical distortion in panorama images. I found it really handy because I could skip implementing my own pano unwrapper. But I had to face its downsides too, meaning the maximum resolution I could get was 640×640 and I had to scrape strategical to avoid exceeding the 25k images/day query quota.

Typically the sky image I got from each query looks like this. I tried scraping several cities in the world, including Hong Kong, Pittsburgh, Rome and New York, but ultimately I settled on Manhattan, New York because the area had the most variation in kinds of skies (skylines of skyscrapers can look very different from that of a two floor building or a high way). Besides contours of Manhattan sky had the simplest geometric shapes, making shape parsing a whole lot easier. In total I scraped around 25K usable images of Manhattan sky.
Shape parsing
I was the most interested in the orientation of the sky area. More specifically, for each image, I wanted to know where the sky exits on four sides of the image. With the color contour detecter in ofxOpenCv, I was able to get pretty nice contours of skies like this:![]()
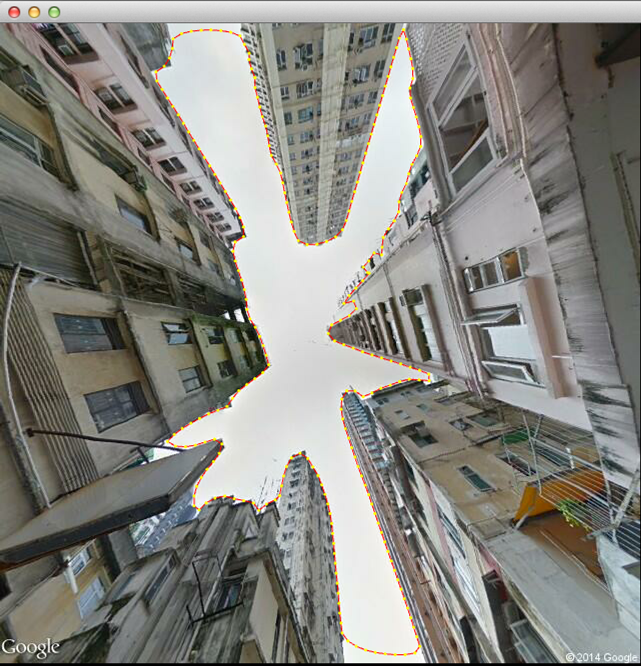 (Contour marked by red dotted line)
From full contours I marked its exits on four sides and computed the direction of the exits. This step gave result like this:
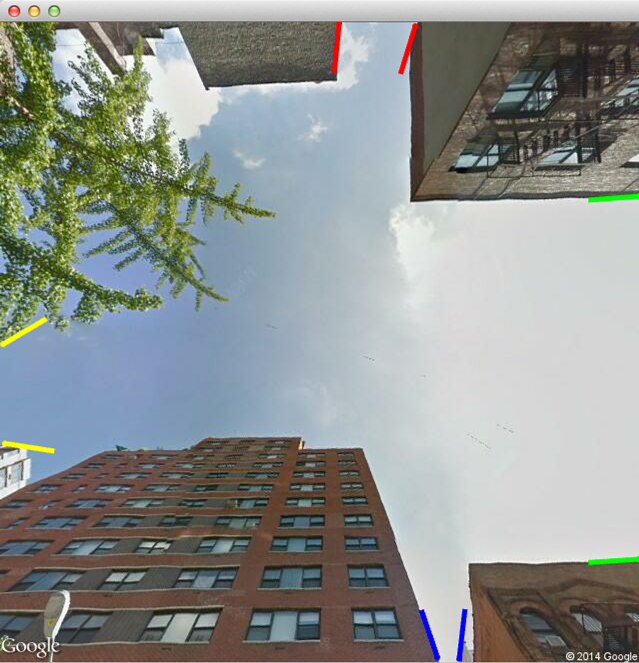 (Exits marked by colored lines)
These exits helped me in deciding along which axis I should chop the image up. For instance if a sky only had exits on the left and right, I’d certainly subdivide it horizontally. If an image had three exits it would then be subdivided along the axis that had exits on both sides. For four-exit images it didn’t really matter which way to subdivide. And finally, images with one or zero exit were discarded.
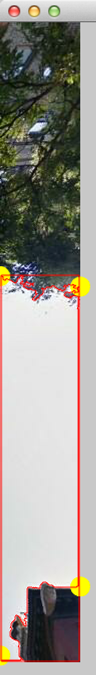
The above steps resulted in a huge collection of slices of the original images, with metadata marking the exits on each slice. I also computed the average colors of sky and non-sky regions and recorded them in the metadata file. The collection was tremendously fun to play with because each strip essentially became a paint stroke with known features. I had the power to control the width and color of my sky brush at will. My first experiment with this collection was to align all skies with a specific with along a line:
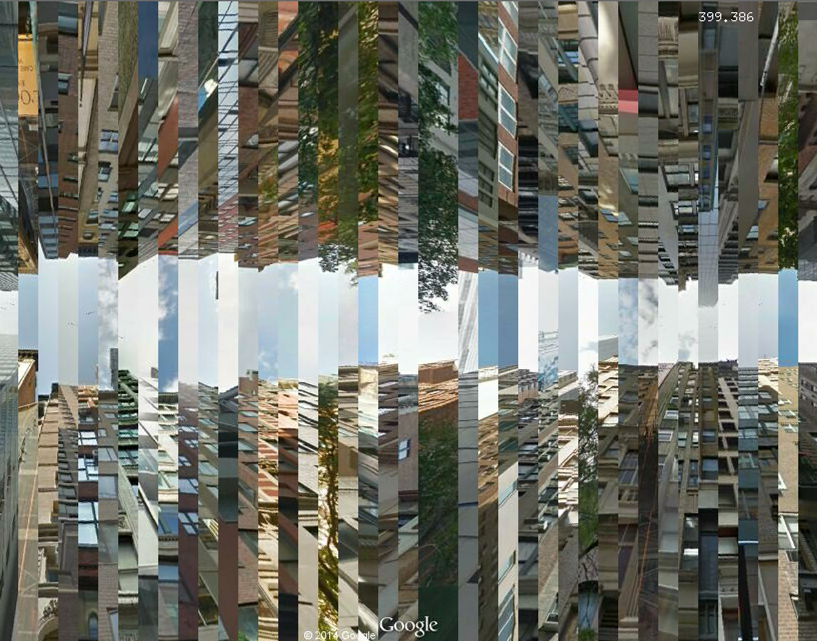
In my final video I sorted the images based on color and aligned them along arcs instead of a flat boring straight line. The result is a semi-dreamy, surreal sky composed ball that led people through a psychological journey in New York.