Category Archives: 24-infovizsketch

Thomas Langerak -InfovizSketch

I had data about related artists pulled from LastFM.
For artist X I find 5 related artists, for which I find again 5 related artists. This I do for thousand artists.

in the D3 library I have quite a few visualizations I like at can be applicable for my design.

Hierarchical Edge Bundling
Fisheye Distortion
BeerViz

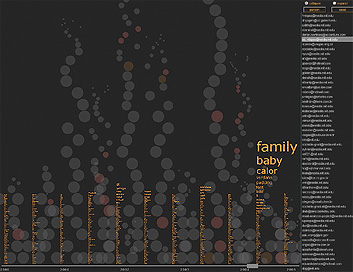
These are a few of them. What they have in common is the fact that they show the names in a round layout and show the connections between them. Yet I think my final design should more dynamic and interactive.

A general comment about the last two weeks is, that by trying to do everything at a decent level I have not managed to do one at a decent level. This should become better over the next assignment. Or otherwise lets believe the video in which they state that you have to deliver a lot of crap before something good.

Infovizsketch_ Priya Ganadas

I’m planning to create a quantified selfie of facebook.

Few similar projects found :

1. “themail” by Fernanda Viégas
themail is data visualization of a person’s email exchanges. Every column corresponds to email exchange with one person, the words on column show keywords used in the conversation. Interesting fact about this visualization is that you can see the evolving relationship with an individual over time.
infoviz

more.

2.Found an interesting article on visualizing facebook friendships Vs geeographic locations. The generated map uses data of 500 million people.
“Visualizing data is like photography. Instead of starting with a blank canvas, you manipulate the lens used to present the data from a certain angle.” ~ Paul Butler.
infoviz2
More information.

3. Crazyegg does heat visualization of websites. Based on number of clicks for various facebook tabs, a heat map can be created for an individual.
infoviz3

website

4. Found many great examples from last year’s blog. here.

Sketches for visualization
My visualisation is going to be a city based in medieval time. I believe facebook can be imagined as digital landscape where we all have our identities and spaces. We visit and get insight into other’s spaces on internet. Just like our own house, there is a limit till which point we allow others to see our lives. I plan to create a city scape based on facebook data.
infoviz4

Every person will have their own castle at the center of the city. Houses around the castle will be from your friends. The vicinity to castle will depend on number of likes and shares from that particular friend. House of a friend will be upgraded depending on the the frequency of communication.

LValley

09 Feb 2015

I downloaded Twilight fan videos containing the phrase “Team Edward” from before and after 2008 (release date of the first movie) to show how the fan’s pre-movie vision of Edward compared to the character, Edward, in the films portrayed by actor/model/musician/film producer Robert Pattinson.

Originally, I had the idea to morph the videos together to form one super video containing artifacts from pre and post film Twilight…

Previously—IMG_3069

And while the idea is still developing, I now have another idea to compile the characteristics of the pre-2008 Edward into one collective portrait and then compare it with the movie character.

IMG_9559

Bryce Summers

08 Feb 2015

My Sketch of the ImperativeB programming language.

My Sketch of the ImperativeB programming language.

I probably will not be using the data that I collected, rather I will be creating an interactive tool that visualizes the conceptual states of data structures as they are used in the execution of a computer program. My hope is that this project will serves as an automated box and arrow diagram generator much like those done by hand by computer science educators for quite some time.

It appears that their is a program like the one that I plan to make called the python tutor: http://pythontutor.com/