Category Archives: LO-2

Ron

22 Jan 2015

His and Hers Colors

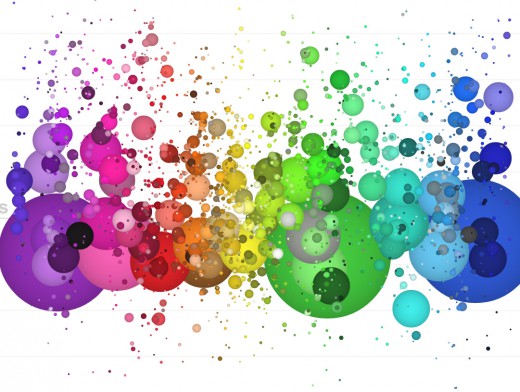
This visualization by Stephen Von Worley illustrates what names men and women use to describe a particular hue. Each dot represents 2,000 of the most frequently-used color names, sourced by a 5,000,000+ sample from a color survey by XKCD. Color names used by women are in the top half, men in the bottom half. Not only is data showing how the genders perceive color interesting, the results themselves are beautiful. One aspect of the responders that wasn’t evident from the survey was their cultural background, which can affect their perception of color. Indeed, this visualization by Muyueh Lee shows the difference between how the English language and Chinese language describes colors — there are far more English names for colors than Chinese ones.

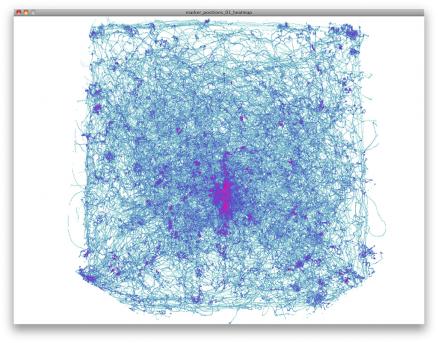
Humanity’s Cultural History

As a son of immigrant parents, I find the migration patterns of people interesting, often wondering why they migrate to a particular area over another. This visualization was created by Maximilian Schich and others from The University of Texas; they took data from the Freebase and charted the places of birth and deaths over several centuries.  Places where a high concentration of people died provide fascinating insights into the cultural city centers that drew them there. Schich’s team also looked at these results in the context of phrases used in literature at a given time (via Google Ngram Viewer) to infer population and depopulation trends of a key city. This data isn’t as complete as it could be, however. Freebase is a Google-owned catalog of well-known places and people, but there is bias in this source data towards the U.S. and Europe, so the results aren’t globally representative.

Matthew Kellogg-Looking Outwards-2: Infographics

Tweetping

Franck Ernewein created this piece which displays a live display of all tweets worldwide. It shows the tweets as bright spots on a world map and also displays running statistics for tweets from different parts of the world.

http://tweetping.net/

I like it for a few reasons. The color choices he made make it feel sharp, elegant and techy, while also giving the feeling that the map is a night view and the tweet dots are lights. It is also dense enough with data in its lower partition to look like something incredibly serious. I also enjoy that the stats start from when you open the page, and given time you can aggregate a bright map that is unique to the time frame over which you’ve opened the page.

I feel this project was very well done. If any improvement could be suggested, it is that it is only real-time. Maybe if a function to view charts from other times, or to see how a timespan looks or changes on the graph existed, it could be more interesting. It may also be interesting to have an overlay with daylight on it to show what time of day it is everywhere.

Metrico

Metrico (by Digital Dreams) is a platform style game with dynamic levels based around gameplay. The graphics and level design are meant to look like infographics. I enjoy this project because it is and isn’t infographics and I enjoy the idea of bringing the aesthetic to a game. I also enjoy dynamic levels in games. For all of this to work together makes it a great project in my mind.

The numbers and variable pointers that update in the game showing you what is dynamic and changing helps make the game look more dynamic and makes the motion of those elements more reconcilable to me.

The tetrahedron landscape bothers me. The pointy structures seem odd and are inconsistent with the foreground cubes. They also seem to differ in color schemes. I feel the aesthetic could be more appealing if this were remedied.


Selfie City

Lev Manovich, Moritz Stefaner, Mehrdad Yazdani, Dominikus Baur and Alise Tifentale made Selfie City which is a piece where they have collected thousands of “selfies” from a few different cities and some statistics about them. Some of these statistics are based on research (age and location, and maybe gender), and others based on facial recognition software.

I like this piece because of the interactive nature. The interface updates to show you what portions change based on the filtered data set (in green). This gives a good representation of relational statistics. For instance, I noticed that women tend to tilt their heads more so than men in selfies.

I also appreciate the real-time update of pictures, and the clean look of the user interface.

To improve this piece, I would like to see more data, as this feels like a very limited sample set of the world, and better facial recognition software because I noticed that many open mouth images were not actually images of people with open mouths.

http://selfiecity.net/

Bryce Summers

21 Jan 2015

Sorting Visualization

by Carlo Zapponi

Weblink: http://www.visualizing.org/full-screen/324949

SortingVis


This project is near and dear to my heart. As a algorithmophile I am always searching for new ways to communicate information about abstract concepts in the hope of increasing the number of algorithm lovers in this world.

This project visualizes the operation of sorting algorithms by visualizing the location swaps that take place when a given algorithm needs to sort a list of integers.

I think that the author did a good job of conveying the procedure over time with the use of arcs. I think that the author missed the opportunity to allow the user to seed a specific initial condition. The user may want to see how a particular set of data reacts to a given sorting algorithm. It would also be nice if there were some sort of feedback that tells the user what the algorithm is doing. There will likely be countless users who can admire the beauty of the visualization but will not understand the logic of what the algorithms are doing, due to the lack of explanation. On the other hand it is nice that the creator, Carlo Zapponi, embedded links to Wikipedia pages about the algorithm within the project. The acknowledgements section at the bottom of the webpage lists the creators inspirations for the project. I would also say that the inspiration for almost all projects of this nature probably eventually can be traced back to the computer science educational experience.

Abundance of Elements

by Jonathan Hull

http://www.visualizing.org/full-screen/56819

elementvis


This project seeks to communicate the relative abundances of the elements of the periodic table within different contained domains. The abundances are displayed via a logarithmic scale based coloring on the respective elements boxes on the standard periodic table. I find this project to pretty cool, because I have done a project recently that tried to demonstrate a sense of scale. I also like projects that try to communicate relative quantities because they remind me of my High School Intro to programming teacher who tried very hard to communicate the relative lengths of program execution (There is a large difference between a program running in a second or a lifetime!) I also like it because it is organized and logically segmented into boxes, which appeal to me.

I think that the project does a good job of communicating the abundances of the most abundant elements in each domain, but most of the charts have a large amount of white space that is boring to look at and does not interest me. Although these non abundant elements are treated as such, it might be nice to know the relative abundances of the less abundant chemicals in a nicer way than raw numbers. I also wish that I could zoom into the pictorial graphs to see the less abundant elements.

chen

21 Jan 2015

The first project I want to introduce is called “Where We Came From and Where We Went“. As the name suggested, it visualized the data of migration from state to state.

oie_22230518m50dZDe

It seems people born in the capital tend to choose live in other places, such as Maryland and Virginia.

oie_2223241fgYE9UCd

The portion of Nevada’s residents who was born in Nevada is the least in all states in the US. Most of its residents came from neighboring states.

This work is really easy for me to get information from, which I think is the most important thing to judge a data visualization project — correct me if I was wrong. It’s hard to manage a large amount of data and this work has done a great job.

There are still some points I think should be improved. The allocation of color and height is not explicitly stated. Like shown in Nevada’s chart, the color of “Born in California” and “Born in Utah” is identical. Also, I noticed the bars shown in the graphics are divided into four groups — the native, the states, the regions, and outside the U.S. It won’t come at first glance, and that’s where might make people confused about.

Similar work can be found in the New York Times’s Upshot, like this one — Mapping migration in United States. There is a large possibility that they share the same data. But this one uses graphics instead of charts to represent data.

————————————————————————————

Selfiecity is an interactive website showing data and analyzation about a research into selfies. Although I’m not a selfie person, it’s still of great interest. This project try to figure out the features and trend of selfies in five major cities in the world.

What they do to collect selfies is collecting random photos from Instagram and ask people to label if the photo a selfie or not. I think this data collecting solution is a bit trivial. There are 140,000 images they collected! Maybe it’s a better way to label selfies using some machine learning solutions. Some of the selfie analysis are interesting, like gender distribution and age distribution, but some are not. You can filter selfies using mouth open or closed option, but it is of little importance to me. Maybe it’s better to detect the background in a selfie, to figure out in what conditions people are tend to take a photo of themselves.

————————————————————————————

There are really a lot of good stuff I want to share. Here is the access to these works!

http://gizmodo.com/the-best-data-visualizations-of-2014-1674001488

Yeliz Karadayi

21 Jan 2015

I want to talk about visualization of expressive movement. To begin, I’d like to define data visualization as taking a complex data set and distilling it into a human-digestible format which enhances our understanding of the data.

Motion Bank

P4ZX1XQ

heatmap_jenett

Screenshot (1)

Motion Bank is an ongoing collaboration project involving a group of designers, dancers, and engineers that archives the motion of dance. The visualization techniques output from the collection of three-dimensional data creates a more measurable understanding of dance as a science, something that can be broken down into understandable parts. The purpose for this project is to enable comparisons for learners as well as to understand the range of motion of a dancer and optimize the space around them. Despite this seeming to be their goal I found the most completed aspects of their project to be more of a representation than actual visualization, for there was little to no visible measurement in the final output, which makes it difficult to truly understand. However I found that the process work shown in the website and in parts of videos shows a lot more interesting sets of visualization, making this collaboration a note-worthy project.
I find the website for Motion Bank to be a little confusing, not to mention the language is primarily German. The website was a little confusing to navigate so it is difficult to really get a clear understanding of what’s going on. I did not see any particular documentation to really explain Motion Bank or what its ‘final result’ is, so to speak. It seems to be an on-going process simply exploring methods for archiving dance. That idea alone makes the project an interesting precedent for its playful and experimental qualities, testing numerous techniques for visualizing motion. The idea of using visualization to learn things is not unheard of, so I’d be interested to see the data being used for some other purpose. Like expression. Which leads me to the next project.

More
Link to un-sharable video

E-TRACES by Lesia Trubat. 2014

E-TRACES, memories of dance from Lesia Trubat on Vimeo.

This recent project collects the data of a dancer’s movement and creates something expressive from it. Now I know that the data visualization from this particular project doesn’t collect the amount of data that we will be expected to from our project, but I still think that the purpose of the visualization is something to take note of. The purpose for the visual effects happening here is to work in collaboration WITH the dancer and push the expressionism happening with her motions into a still drawing. Certainly this approach can be pushed to another level, covering more data, and continuously changing itself in response but not necessarily showing measurable data as much as it is expressing…something? Really, I just like the idea of data visualization being something that does not necessarily depict information on a one-to-one level the way a graph or chart would, but instead become its own art form.
I think that the video documentation could be pushed beyond an overlay on the dance itself. What if the actual dance wasn’t seen at all, and its only purpose was to output some visualization? Can that visualization become legible in its own way? Can it be transcribed back into dance if someone learned how to “read” it? I’m interested in this kind of ‘telephone’ game being played and I’d like to see that taken a step farther.

“Humanizing Motion Graphics” by Matt Pyke. 2012

Speaking to my interest in expressive data is Matt Pyke who talks a lot about anthropomorphizing digital graphics so that people can empathize. His work is not data visualization so much as it is visual representation of motion. Though his work does not invoke an understanding of a set of data, it is evocative and exciting. Can data really be this exciting or emotional? Oh yes. Yes it can. Just stick some googly-eyes on it.