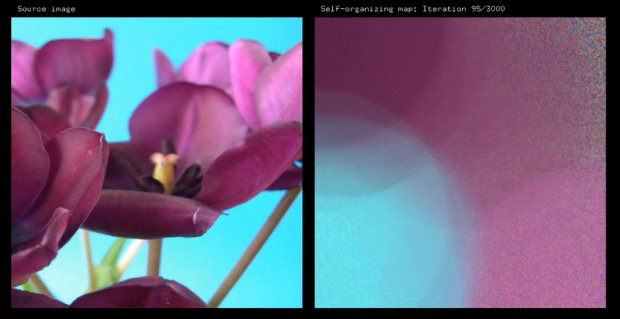
Self Organizing Map
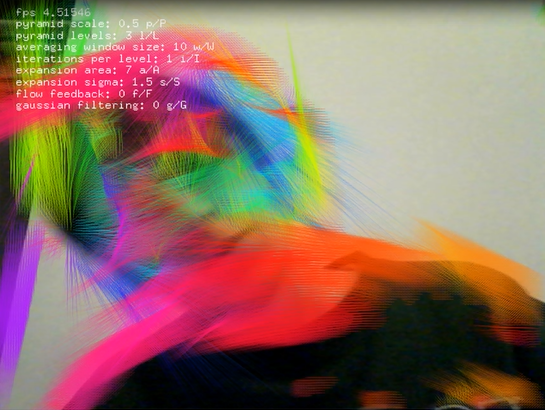
Optical Flow
I chose to try to include optical flow and a self-organizing map in the same of application. I picked these two in particular because I thought it could be really engaging to interact with such a map using the optical flow grid implemented by Denis Perevalov that I posted about here. This would allow the user to highlight different aspects of the map to get a better idea of how the values are interacting and influencing each other. I think that combining these two addons in this way could be an interesting approach for our data visualization project, but for the purposes of the Upkit Intensive I only got as far as compiling the two addons in the same project. I did test out each of the addons’ examples and will post videos of both below for anyone who is interested in a visual explanation of what each one does. Although it is unnecessary for me to post the example code as it is already on github for both addons, I have posted the code for self-organizing map here and for optical flow here.
Self Organizing Map from Erica Lazrus on Vimeo.
Optical Flow from Erica Lazrus on Vimeo.