Introduction
We are interested in creating data visualizations exploring how the movement to make pittsburgh more attractive for territorialization by IT/Hi tech companies is a driving force for the displacement of poor minority people.
As an alternate perspective, we also explored poetic interpretation of this phenomenon by using a robot to feed mold spores placed on a 3d model of pittsburgh with Soylent. Spores are placed at epicenters of tech growth such as the CMU campus and tech incubators. The mold will be fed in a pattern created by data on how tech companies have grown to territorialize the urban ecology of Pittsburgh. Once the mold exhausts the food source it turns into spores that rely on currents to carry them elsewhere. The resulting installation which showcases slime mold growing and colonizing pittsburgh will hopefully evoke a visceral gross reaction, which counters the prevailing narrative around CMU culture that Google and tech industry are progressive and ‘making the world a better place’.
Data Gathering and Visualization
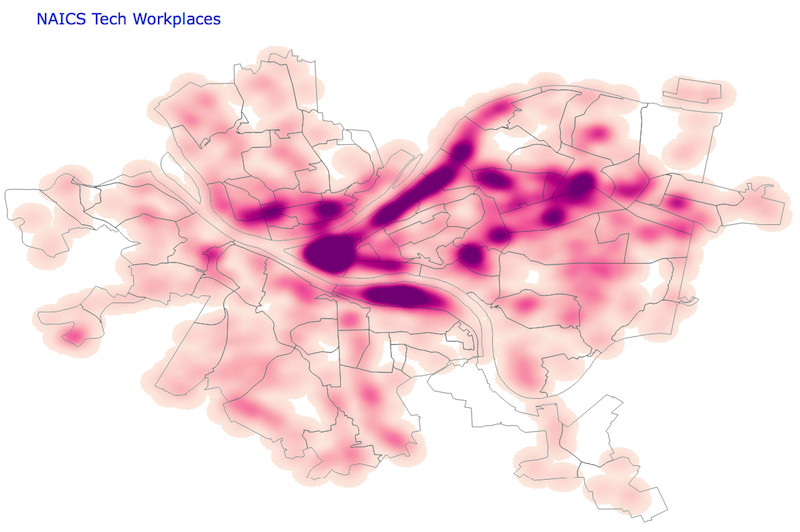
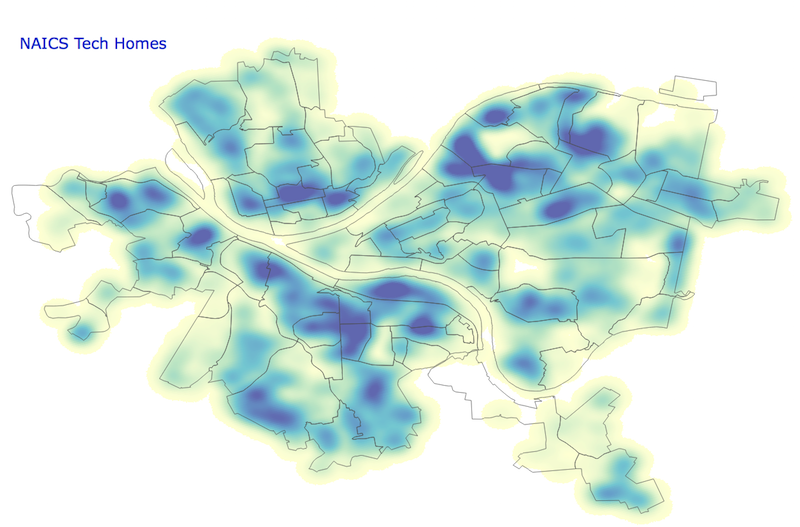
Initial data explorations proved to be quite difficult, as data on the “tech landscape of Pittsburgh” were not readily accessible. We started visualizing the home/work location distribution of employees at NAICS coded businesses which matched a reasonable description of tech business (Scientific and Technical Services) through OnTheMap Census data portal, but upon closer examination we discovered this data primarily consisted of people working at architecture and accounting firms, rather than tech businesses.
We tried to narrow down the NAICS business classification search using the refUSA database to create a complex query which would systematically exclude doctors, accountants, retail technology businesses, and other random selections that would dilute our query for IT/Biotechnology/High Tech companies in Pittsburgh
Omitted:
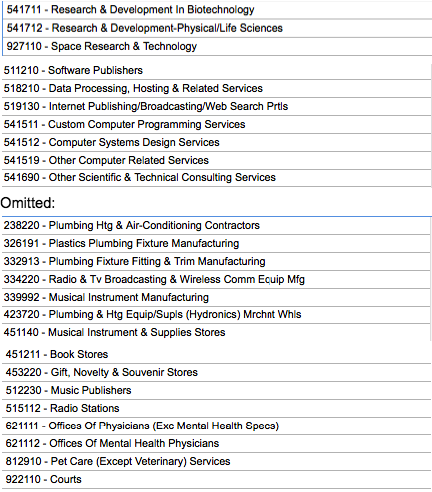
While this data was better curated than the initial NAICS query, it still lacked the specificity we desired. We changed our approach from merely querying databases and started interacting with members of the local community who are knowledgeable about the growth of the tech community in Pittsburgh. After meeting with a variety of people ranging from CEOs of local startup incubators to community activists and administrators at local tech trade organizations, we ended up with a data source including:
- List of local Pittsburgh startups spun off from CMU
- List of companies in Pittsburgh that have received venture capital from local incubators or larger investors from outside
- List of companies that are members of the Pittsburgh Technology Council
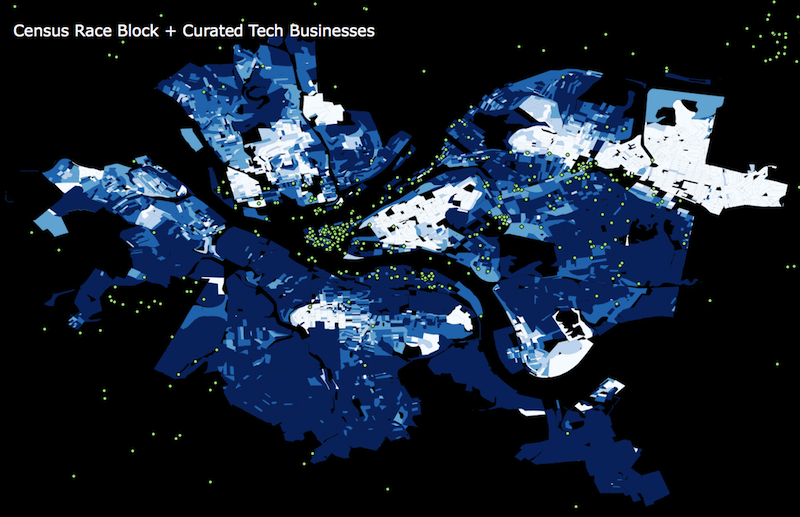
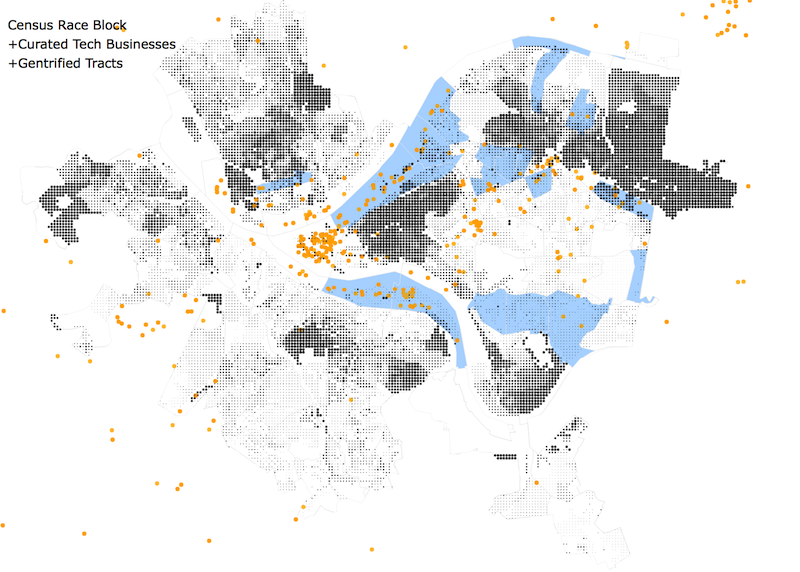
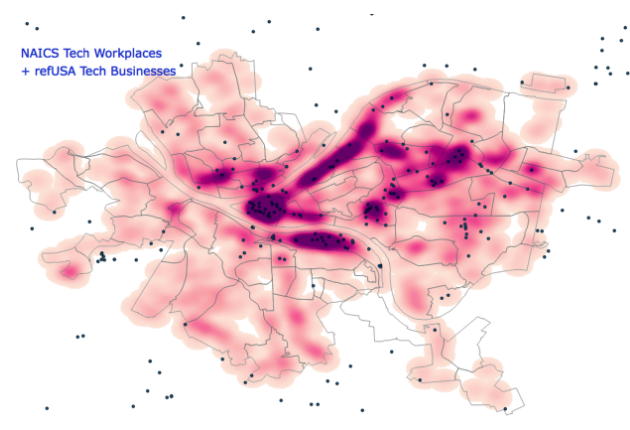
For each of these companies we got location data and date founded, which would allow us to create time-dimensional data visualizations. This was a dataset of around 1200 data points which we felt was adequately curated, but we still did not have meaningful data to compare it against so as to begin to ask questions about the growth of tech as it relates to cultural displacement. Speaking with local filmmaker and community activist Chris Ivey, we got the idea to look into areas with significant racial segregation co-located with areas of tech prosperity. This gave us the idea to layer our tech data with a gradient showcasing blocks with high racial concentration (>90% white & >90% black). We additionally used ArcGIS to calculate tracts of land that exhibited conditions over a 25 year period that are associated with gentrification (>30 percentile median home value increase >25 percentile educational attainment increase from 1990-2014). One thing to note was that the change in block shapes from the Census 2000 to 2010 made the racial concentration by block comparison difficult, as the changing geometry obscured changes in racial consolidation. This required choosing a visual language that could adequately display all the necessary patterns on top of one another–we settled with the dot grid map.
<insert race tech maps>