Project Description
For this assignment I mainly wanted to work with satellite imagery of conflict zones, or borders between countries or neighboring communities. My initial thought was that rendering a few different borders into a standardized format might allow for comparisons between them. Though the data is hard to access, gathering satellite imagery by band (i.e near infrared or panchromatic) would allow me to make comparisons across two sides of the border (i.e. what’s the difference in vegetation or moisture). Turns out that only landsat provides band data for free and landsat data is both harder to use and not at a high enough resolution.
Ultimately, I also ran into a few technical challenges I ran out of time to solve. There is still a lot to improve in this project – in many ways it was only a proof of concept, but one that indicates a clear direction forward should this turn into a final project.
Process
Generating a strip consists of a few steps:
- Finding points along a border – or a series of latitude and longitude points to query
- Downloading Google Satellite imagery for such a series of points at a particular zoom level (Ruby script)
- Aligning all of the image tiles on the screen and saving a temporary combined image of all the aligned tiles (Processing)
- Finding the normal for each of the points along the border to create two offset paths along each side of the border points. (Processing)

- Texture mapping each point along the two offset paths to a long strip of pixels.
Result
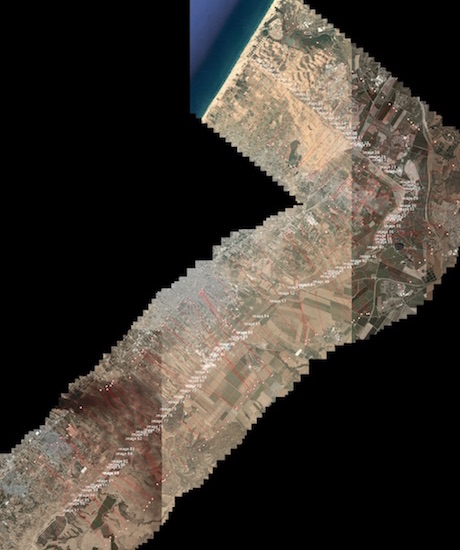
I made the mistake of choosing a particularly curvy and not too interesting strip of land between the U.S. and Mexico to visualize first. The aligned image of a particular part of the border looks like this:
The algorithm i’m using to generate a strip corresponding to a warped and straightened out border is taking points along each side of the border path and texture mapping those points to a row of pixels. It needs some tweaking – at the moment it is calculating the linear distance between points instead of the distance between points along a curve. I could also take a larger chunk of pixels along each side of the border in order to generate a thicker strip.
Problems Encountered
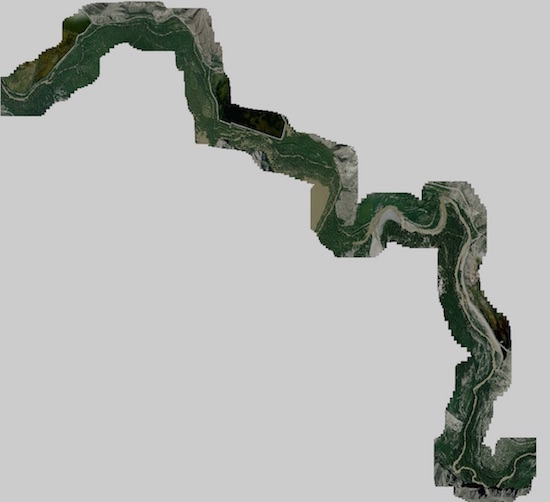
Interpolation: In some cases, the latitude and longitude points I had were too far apart to correspond to overlapping map tiles. This led to holes and gaps in the texture mapping of my strip. In the future, I’d have to interpolate smartly to get just the right amount of latitude and longitude points.
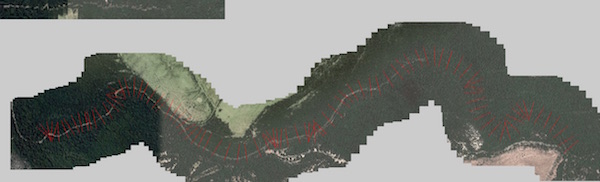
Texture mapping: My texture mapping is not too smart at the moment. As the image below shows, I have too many overlapping points along my offset paths to generate a sharp strip. I have to find a better way of generating an offset path or curve to render the strip correctly. I should also process the images within a graphics object so that I grab high-resolution pixels instead of lower-resolution ones rendered onto the screen.