Facing literally millions of potential source images, distributed across perhaps 100 or so data sources, was a difficult challenge for me at the start of this project. After a few hours of looking, I still hadn’t found anything especially promising.
I started poking around the Metropolitan Museum of Art’s image collection, and coming across many images of candlesticks clustered in the database, I realized that some systematic comparison of the different shapes of these candlesticks might form an interesting basis for a project. Here’s a tSNE overview of some of this collection:
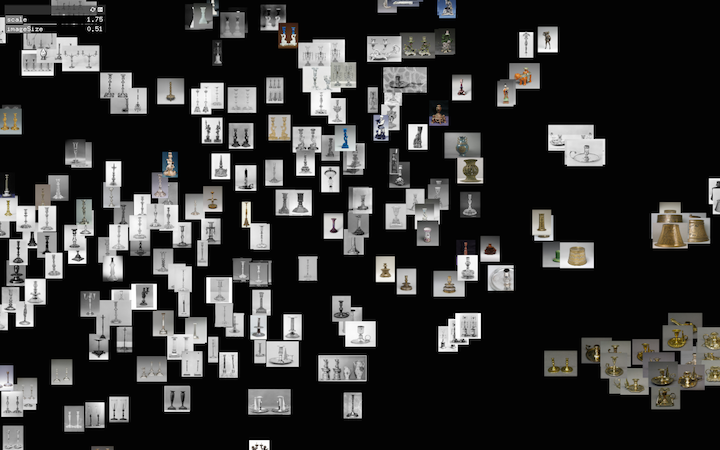
Note the heterogeneity of the collection: many images contain two or more candlesticks; shapes of the candlesticks vary a lot; and colors/framing/etc. are also quite variable.
The real work proceeded in a few distinct steps:
- Pull candlestick images from the complete database
- Build a reliable edge-detection algorithm to extract the candlestick profiles
- Organize, collate, and display the findings
To do #1 I did an fgrep search across all of the JSON descriptors of the Met’s image collection, building a list of every image whose metadata included the word “candlestick.” This was fairly straightforward. Here was the one-line command:
fgrep 'candlestick' data -rli > candlestickFiles.txt
Then I had a .txt with the list of every JSON file describing every image of interest, and did a simple find-replace to turn lines like 1350.json into 1350.jpg, over the whole candlestickFiles.txt document. I now had a list of every image I wanted to analyze.
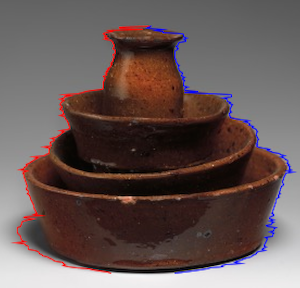
2. The profile extraction was easily the hardest part of this project. The basic algorithm of the detector would start by walking from the left side of the image, stepping one pixel to the right every cycle and comparing the brightness of every pixel with its immediate neighbor. A big jump in brightness value (either up or down) indicates an edge has been reached. This analysis is shown in red for the left side of the candlestick, blue for the right:
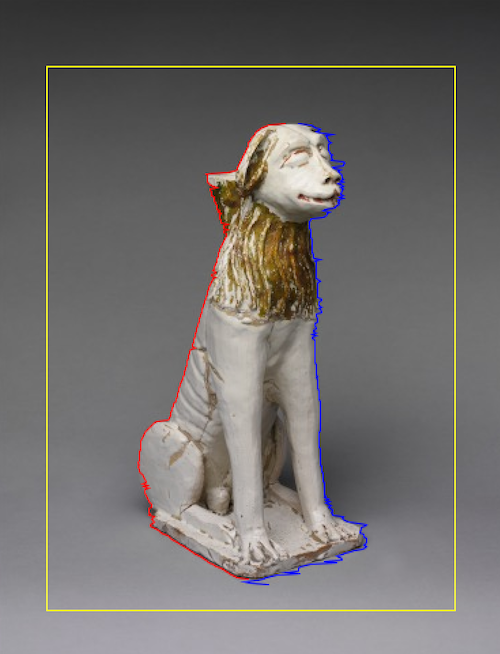
To reduce the jitter of the detection, Golan helped me build in a median filter: then the comparison is of the median of values around a pixel with the median of values around its neighbor. This filtering made for smoother line following, as in this image:
Next, I wrote an automatic threshholder, which would essentially cycle through all of the reasonable threshhold possibilities and select the one that produced the least-erratic line.
I again smoothed that output by running the edge-finding line through a 9-wide median filter, which pulled out many jitters. This served as a sort of second-order filter. The green line in this image was smoothed in this way.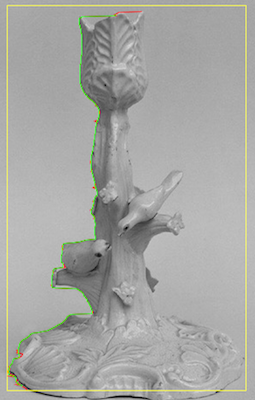
3. Finally, I iterated this same analysis over all candlestick images, arranged the outlines from least jittery to most, and saved the results into an ArrayList. I reordered the list by the jitteryness score for each candlestick line, and generated a PDF with all of the candlestick shapes side by side. A small slice of the PDF looks like this:
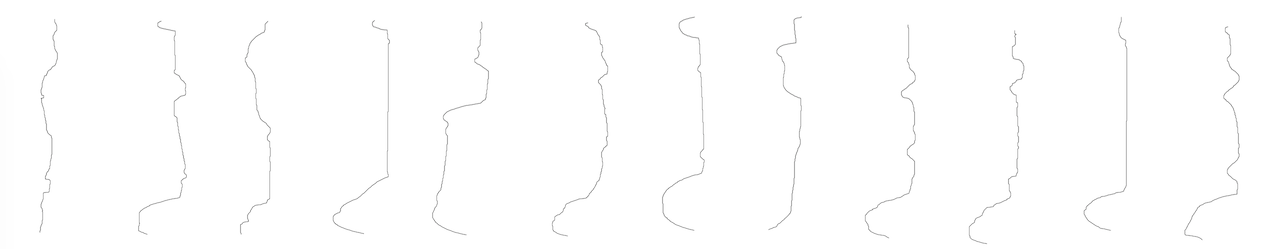
Github, with PDF output the above image is extracted from.
Video to come shortly!