Focus – Eye Tracker Visualization Interface
Focus by Amy Friedman from Amy Friedman on Vimeo.
My project uses the EyeTribe to collect eyetracking data and visualize it. Eyetracking companies have some programs to visualize collected data, but Focus allows for users to change what images are looked at and better understand the differences without limitations. Utilizing clusering algorithms, heat maps and personalized comparisons Focus allows for an at home user experience. Focus emphasizes images from different basketball views to understand where beginners first gaze vs. more advanced players to begin to get small comparisons. Implementing your own images and changing the focal cluster points allows you to customize Focus’ results.
There are two components to my project, which allow the people to create their own data and visually compare it on their own. The first program called FOCUSCollector, I created displays imported images on a timer, and saves the viewers gaze points, image number and time spent per gaze to a .tsv file, at the end of the sequence the program displays the images with the collected data shown in scatter plots, heat maps and clustering map. The second program is a usable visual interface called FOCUSVisualizer takes all of the .tsv created by the FOCUSCollector and allows users to change which image is viewed with their desired visual map. FOCUSVisualizer lets the user learn what they want from their data but giving them options of visualizations. FOCUSCollector and FOCUSVisualizer were both programmed in Processing using Java.
FOCUSVisualizer Interface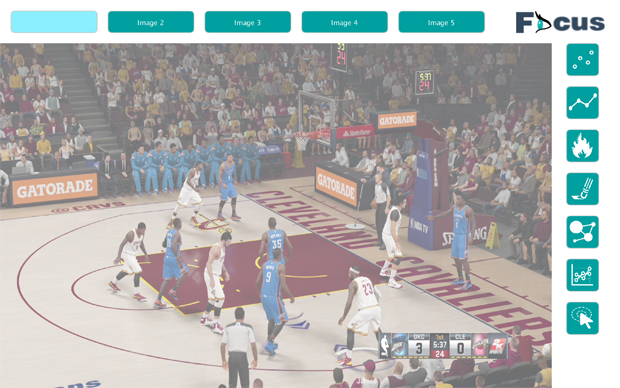
FEATURES
Scatter Plot
Scatter Plot Lines
Heat Map
Reveal Map
Cluster
Clickable Clustering
Advanced vs. Beginner Comparison [coming soon]
Animate Overtime [coming soon]
4 screen comparison [coming soon]
Inspiration – Current Market Eyetracker
I wanted to allow people to have a more readily available interface to visualize eyetracking data. A lot of research has gone into eyetrackers. In my past posts I have mentioned the work done by the UCD School of Psychology to utilize eye trackers to distinguish between beginner and advanced golf & tennis players using the Tobii eye trackers. Tobii has also developed much research to analyze eye tracking data. Most eyetrackers used to run around $3000, but current market trackers have become more affordable. The EyeTribe and developer kit is sold for $99, while the Tobii EyeX Controller Dev Kit is sold for $164.00, which includes shipping. Both of these can be used on Windows compatible devices, but only the EyeTribe can be used with a Mac. The EyeTribe also has a cloud-based eye tracking analytics Beta program called Eyeproof. This system uses the EyeTracker Recorder to record the gaze point which is only compatible with Windows. Eyeproof allows for users to create heatmaps, traffic maps, and burnthrough visualizations of where different participant gazed.
You choose the image or website uploaded and have participants look at the image. The programs I created developed similar features, but also allows you to cluster data in comparison to different points on the screen, and compare the differences between someone who considers themselves an advanced at playing basketball to those who are beginners or lack knowledge.
Reflection
The images range in amount of visual information in them. With more visual information people tended to look at different components, when the images had less information participants focused more on the main attributes of the image. There were many similarities between where people looked. In a game situation one would be more focused on the man youre guarding or how to help optimize a play, when youre watching basketball this detail differs.
I think that FOCUSVisualizer allows people to easily view and understand the gaze points which have been collected from FOCUSCollector. At the exhibition people enjoyed seeing their own visualized data, I think that FOCUSVisualizer could improve if FOCUSCollector was integrated into the program. This would be an issue as not everyone has an EyeTribe, but people enjoy manipulating their own data, it personalized the experience and allows for them to gain information about themselves. Another issue is that most of the maps focus on the collected data as a whole not on individual participants, this would be nice to integrate to allow to better compare specific individuals.
I learned alot while creating the two programs. One of which was how to sort through large amounts of data and even create the files of the gaze points. I didnt find connecting to the Eyetribe to be hard as there was already a Processing import created by Jorge Cardoso allowing me to easily collect the gaze points. It was cool to learn about where one looks compared to where are eyes are located. Our eyes move more than one thinks and I didnt realize this until after. I also learned to work with ArrayList and HashMaps. How I would store the data and then use it was the hardest hurdle to get over because it determined what information I could use. I focused more on the data as a whole rather than individual people but this is something that could be improved as I said before. It was a great experience to create visualizations of peoples data.
Future
My next steps involve allowing users to compare 4 different screens at once, and to allow for the gaze points to be animated over time. The Heat Map and Reveal Map need some adjusting too allow for smoother visualizations which will be done soon.
Program 1 FOCUSCollector: Data collection Java Program can be found here.
Program 2 FOCUSVisualizer: Eyetracking Data Visualization Interface Java Program can be found here.
Images Used in Project come from:
http://hoopshabit.com/2014/12/30/fantasy-basketball-rudy-gobert-shining-utah-jazz/
https://badgerherald.com/sports/2015/03/26/mens-basketball-dekker-koenig-see-familiar-face-in-uncs-j-p-tokoto/
http://www.hawaiiarmyweekly.com/2011/04/28/94th-aamdc-captures-basketball-championship-69-64/