In this project I want to analyse visually the landscape surrounding streets, avenues and highways. In the end of the 1960s, Robert Venturi, Denise Scott Brown and Steve izenour took many students from Yale to understand the emerging urban spaces of Las Vegas. With different resources such as diagrams, maps and pictures they tried to decipher the logic underlying the urban patterns and structures.
Well, with Google large data base it is possible to access a large set of photos based on its coordinates and angles. With Temboo I scraped the data of some directions in Google maps. The resulting file contains coordinates and distances from each node of the path. The next step is to connect these points and distances with the streetview image, what is possible with Google API.
…
},
{
“distance” : {
“text” : “0.5 km”,
“value” : 549
},
“duration” : {
“text” : “1 min”,
“value” : 67
},
“end_location” : {
“lat” : -23.5654915,
“lng” : -46.7118095
},
“html_instructions” : “Continue onto \u003cb\u003eBR-116\u003c/b\u003e”,
“polyline” : {
“points” : “ntxnCfmb|Gh@Ax@CnBEb@AjAAhAArCCjACjACnACnAA~@El@APA”
},
“start_location” : {
“lat” : -23.5605573,
“lng” : -46.71203879999999
},
“travel_mode” : “DRIVING”
},
…
At first sight, there are some challenges, as how to get intermediate coordinates with precision, how to select the angles, etc. In a ordinary trip inside a city, the file contains hundreds of lines and just dozens of nodes. So, I’ll have to choose between creating many paths inside the same city or choosing very long trips between urban centres.
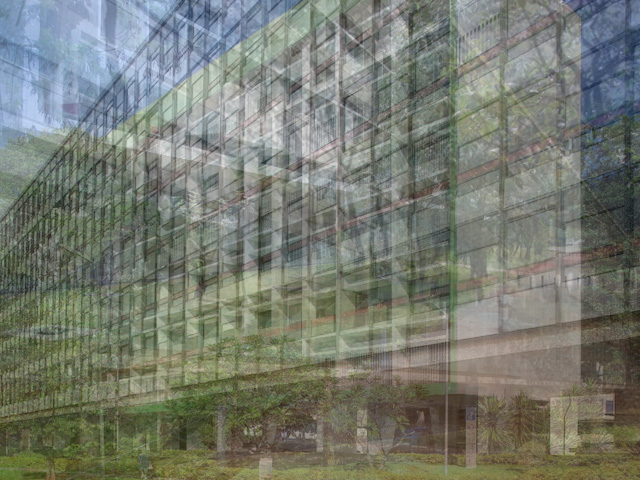
In the end, I would like to use morphing techniques and visual analysis to compress series of images of certain paths in a single image, to understand both the distribution of the buildings, the interface between public and private and also the predominant colours of the environment.