My info visualization will explore the awkward world of crossover fanfiction (a genre of fanfiction that combines characters/words from many different series). I want to be able to see what series are the most popular to combine, but also to discover the most strange and obscure crossovers (for example, this is a crossover between Scooby Doo and Lord of the Rings) with an interactive visualization.
This website has easily scrape-able data for about 30,000 works of crossover fanfiction.
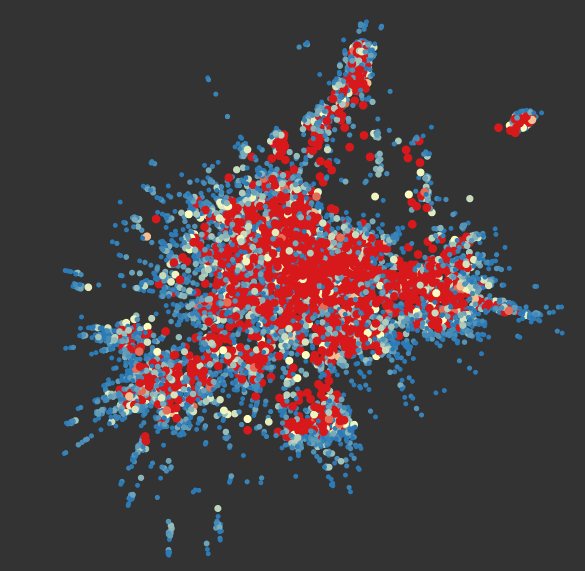
I want to visualize this data as either a scatterplot where each dot represents a series, and the closer together a series is, the more fanctions that combine them exist…
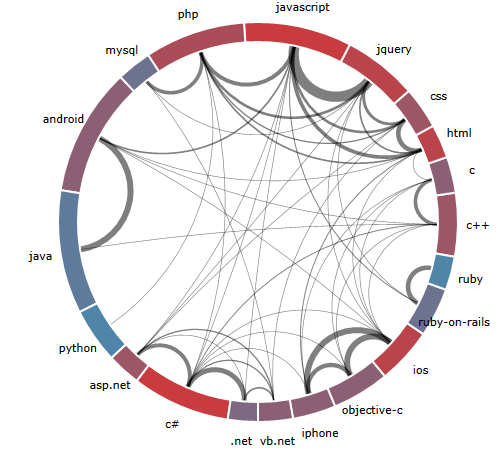
…or as a circular relationship graph where each connection represents one story.