ABSTRACT: The “environment” I’d like to visualize for the Map/Environment/Landscape/Visualization project is my own personal head space. Although this location is abstract, I personally regard it very much so as a physical space (as the term “head space” implies). This is partially due to the fact that I was diagnosed with an OCD and anxiety disorder in my adolescence, and have experienced extensive treatment in controlling the repeated unwanted and anxious thoughts that occur on a day-to-day basis.This treatment has allowed me to develop a firm foundation of mental health strategies that I can use to control these thoughts. One of these strategies is to view my mental health in the same way that I view my bedroom at home – something that needs consistent upkeep to keep clean and inhabitable.
I am now at a point in my personal mental health experience where I’m comfortable discussing my disorders and do so regularly as a way to promote mental health advocacy and understanding. I think this project provides a unique opportunity for me to use information visualization as a way to further explore the manifestation of anxiety and OCD in my daily life. I’d like to do this for my own personal curiosity, but also as a way to communicate a very internal and, at times, abstract concept to the outside world.
PROPOSAL 1: I’d like to use my phone to record the locations and times of my anxious thoughts. Every time I have an anxious thought, I’ll take a record of it using my phone. By the end of the exercise, I will have a few days’ worth of time stamps and GPS points to map when and where my anxious thoughts occurred. I was initially looking into check-in apps such as Swarm and Checkie to do this and planned to either use Temboo or an API for the apps. Then, when watching Eric Fischer talk about how he grabbed location data from Flickr photos, I realized that it’d be a much simpler interaction to just take a screenshot of my phone whenever I have an anxious/OCD thought and use the location and time data from the photo.
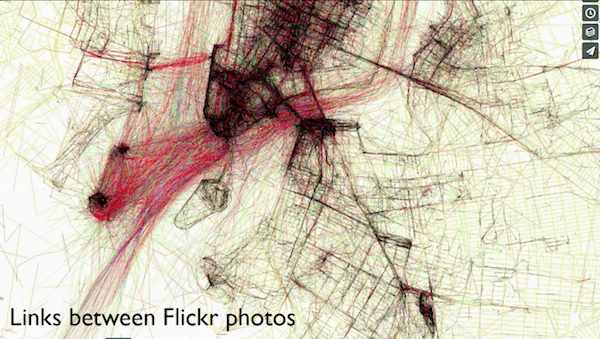
Eric Fischer’s mapped visualization of users’ paths through the city using location data from Flickr photos.
With this data, I can easily use the method Ingrid Burrington taught us at the beginning of the semester to plot my measurements on a map. To make it interactive, I’d like users to be able to hover above locations and view the average number of anxious thought’s I had for that spot. However, I still think this is too simple and would like to enhance it somehow.
PROPOSAL 2: My initial idea for this project was to record every anxious thought as it occurred to me. After a few hours of trying to do this with my phone I realized that it provided inaccurate data due to my personal bias of not wanting to say some thoughts aloud in crowded area, and thus changing the thoughts when I recorded them. However, I would like to take recordings of myself vocalizing a set number of thoughts. I would like to then combine these recordings with the data I gather using the method in PROPOSAL 1. I could measure the average rate of anxious thought per time of day and/or per location. Users could then choose different times and locations, and would hear the recordings of my thoughts at a certain loudness or frequency depending on the rate measurement. I’m most interested in this idea but don’t have a clear theory about how I will build it after gathering the data.