Category Archives: Uncategorized

Nathan

05 Feb 2013

What: I was recently (last 2 months or so) introduced to the tulip mania of the Dutch Golden Age. Tulips, at the peak of the period sold for more than 10 times the wages of a skilled craftsmen in the Dutch empire, or what is today approximately 1 million dollars. One day in February, the prices of tulips fell like a brick: from 100s of thousands to a few dollars. the Dutch, who created capitalism, had the first ever Speculative Bubble and the first ever ‘bubble crash’. I think that this is extraordinarily compelling. That the pitfalls of modern civilizations were realized and forgotten, is something I wish to talk about in my Data-Visualization.

How: I envision a very long flowering bed of tulips installed in a place for everyone to see. I want to plant the tulips according to set intervals during the climactic peak and fall of the Dutch tulip mania.

I believe that this is an interesting subject and I want to create this installation with a mix of beauty and gravity.

Yvonne

05 Feb 2013

Mitosis and Cytokinesis
The process in which cells divide, thereby producing more cells.
“Mitosis is the process by which a eukaryotic cell separates the chromosomes in its cell nucleus into two identical sets, in two separate nuclei. It is a form of karyokinesis, or nuclear division. It is generally followed immediately by cytokinesis, which divides the nuclei, cytoplasm, organelles, and cell membrane into two cells containing roughly equal shares of these cellular components.[1] Mitosis and cytokinesis together define the mitotic (M) phase of the cell cycle—the division of the mother cell into two daughter cells, genetically identical to each other and to their parent cell.”
http://en.wikipedia.org/wiki/Mitosis

This is a data visualization, but it plays on cell division. I just really like this one :3


Neural networks
I’ve always had an interest in nerves, the nervous system, and neural networks in general.
“A biological neural network is composed of a group or groups of chemically connected or functionally associated neurons. A single neuron may be connected to many other neurons and the total number of neurons and connections in a network may be extensive. Connections, called synapses, are usually formed from axons to dendrites, though dendrodendritic microcircuits[2] and other connections are possible. Apart from the electrical signaling, there are other forms of signaling that arise from neurotransmitter diffusion.”
http://en.wikipedia.org/wiki/Neural_network

Below are some pretty cool visualizations. The lower one was done in Processing.


Heliotropism
When a plant moves its flowers and/or leaves to face the sun. Not to be mistaken with Phototropism (or directional growth, in which the plant grows toward the sun).
Heliotropic flowers track the sun’s motion across the sky from east to west. During the night, the flowers may assume a random orientation, while at dawn they turn again toward the east where the sun rises. The motion is performed by motor cells in a flexible segment just below the flower, called a pulvinus. The motor cells are specialized in pumping potassium ions into nearby tissues, changing their turgor pressure. The segment flexes because the motor cells at the shadow side elongate due to a turgor rise. Heliotropism is a response to blue light.
http://en.wikipedia.org/wiki/Heliotropism

Arctic poppies!


Some generative art
While browsing the internet for heliotropism and generative art I found this little piece called Silk.

http://new.weavesilk.com/
http://weavesilk.com/

Caroline

03 Feb 2013

 Dataset Gapminder by Hans Rosling

Okay, so this isn’t one dataset, but it is an awesome place to find the standard reliable datasets and see them visualized over time.

desktop_front


Hans Rosling is my absolute favorite statistician! He has given 4 TED talks, which I think is more than anybody else. His basic argument is that common knowledge is generally 20 to 50 years behind the data. His primary example of this is the idea of the strict divide between the developed and non-developed world. Gapfinder is a simple tool that allows you to pick both your x and y data sets from a list of reliable sources and see how it affects every country over time.

 Provocative: ceibas: sigma fugue by by Evan Meaney

In this piece Meaney combined damaged home videos from recovered hardrives to make ceibas: sigma fugue


As someone who recently lost every last bit of a terabyte hard drive I find this piece by Evan Meaney quite provocative. It is overly simplistic to construct a metaphor between human memory and machine memory, seeing how human memory literally rebuilds a memory every time it is recalled, whereas a machine must simply access the correct memory space. However, Meaney reminds us of the phycological role of forgetfulness and decay.

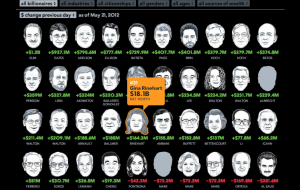
 Well-crafted Bloomberg’s Billionaires Index by Christopher Cannon

This visualization shows the 100 most wealthy billionaires in the world. all the interactions are very elegantly done.

billionaires-01


This data set is certainly not the most creative, however it is very elegantly and intuitively displayed. There are several levels of interaction possible embedded within the visualization; on first view, it is easy to engage because there is a simple grid of numbered faces. You can also easily see the most basic piece of information by hovering over each face. And finally it is also possible to to see more detailled information by clicking into each face. On a side note, I find it very  disturbing that all the women on the list inherited their money and none are self-made.

Elwin

30 Jan 2013

Stopping The Dead // by Richard Johnson and Andrew Barr


Interesting project: I only recently started watching The Walking Dead and I couldn’t help it but to finish watching all 3 seasons in just a couple of weeks because the show is just that awesome. Naturally, finding this infographic immediately caught my attention. The data visualized on the image is very very detailed. The artists captured all on screen zombie kills, linked them to the person who killed it and with which weapon, and even put them in chronological order in which they were killed in all 27 episodes!!!

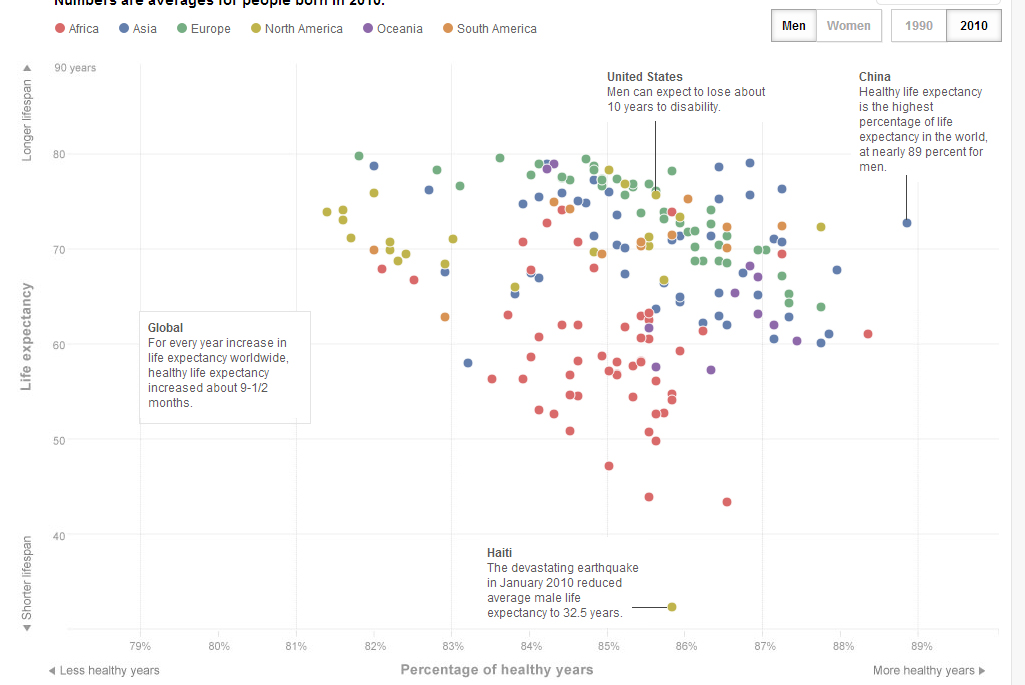
How long will we live — and how well?

life
Provocative: I think this is a very interesting data set which will and has lead to discussion on the internet. Especially when the information is also visualizing “Healthy years” in addition to the Life Expectancy. Men in China have a lower life expectancy of 72.9 years compared to the 75.9 years for men in the US. But what’s interesting is that Chinese men has a higher number of healthy years (64.7) compared to their life expectancy, which results in a difference of 8.2 years. The US men live 65.0 healthy years, which means there’s a discrepancy of 10.9 years. While I’m not certain if this is true, this makes me wonder about the accuracy of the data and the reliability of the data providers. How well is everything documented by researchers, government, medical institutions? To my surprise, they even have results for North-Korea. Entire article link

OrgOrgChart // by Justin Matejka


Well-crafted: A Beautiful visualization with nodes, colors and organic change over time. The OrgOrgChart (Organic Organization Chart) project looks at the evolution of Autodesk’s organizational structure and a snapshot was taken each day between May 2007 and June 2011, a span of 1498 days as data. Each day the entire hierarchy of the company is constructed as a tree with each employee represented by a circle, and a line connecting each employee with his or her manager. Each second in the video is approximately 1 week of data. I wished they could have slowed the video down so analyze and watch the changes in data more carefully.

Dev

30 Jan 2013

Generative Art

Genetic Algorithm

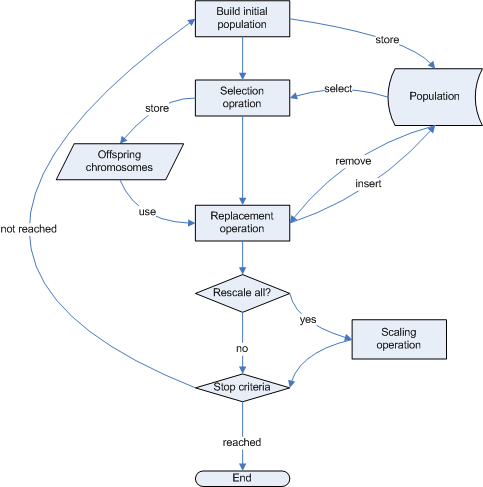
The concept of a genetic algorithm in my opinion is best summarized by “survival of the fittest”. The idea is that you have some heuristic for success for a given task. You spawn a bunch of mutations that try to accomplish the task. The mutations that suck are eliminated  The ones that don’t however, breed, and evolve. Doing this generation over generation can be automated through the computer and will “naturally” optimize the set over time.

Genetic algorithms are not only cool because of how elegantly they solve problems, they somewhat mimic they way nature solves them too. This makes them a very powerful concept.

Genetic AlgorithmFlow Chart

Electric Sheep

Electric sheep lets people leverage unused power of their computers when they are asleep to generate some amazing high-detail animations. These animations are voted on by anyone who is watching them. The top voted animations are bred as per the genetic algorithm process, and thus spawn more and more art that is visually appealing to humans.

I am a big fan of abstract art, and find it interesting that people can judge something so undefined and far from reality. The fact that people can and do do this in electric sheep makes the end goal appealing – an abstract art piece generated by computers that everyone will love. A renaissance in your computer!

BoxCar2d.com

Being an engineer, admittedly this example of generatively is really awesome. When cars are built they are built around a set of requirements. The car must move X mph or the car must have Y mpg. Meeting these requirements takes a long time with trial and error and testing.

BoxCar2d shows how genetic algorithms can be used to solve problems in the physical world. Over the course of time, different variations of cars will evolve over time to go the maximum distance over a rugged course. The simulation relies heavily on physics, and takes into account both structural integrity as as well as specialization in movement. Something I like is that users can also up-vote certain designs to personalize the process.

Ziyun

30 Jan 2013

{20Hz} – by Semiconductor ( Ruth Jarman and Joe Gerhardt )

CARISMA (Canadian Array for Realtime Investigations of Magnetic Activity)

Visualizing the immaterials and invisibles is a fascinating topic. This project turns an scientific data, a radio array captured at 20Hz into audio – “the tweeting and rumbles caused by incoming solar wind”, “a geo-magnetic storm occurring in the Earth’s upper atmosphere”.

They did both data sonification ( which interests me a lot) and sound visualization beautifully.

And the universe, universe, universe…


{Getting Lost} – by Marco Bagni

Not much to do with information, but very very eye-catching “infographically-stylized” animations.


{MTA.me} – by Alexander Chen

An old project in 2011, visualizing the NYC subway system into interactive musical instrument. Turning lines ( the subway routes) to strings is a very intuitive musical thinking. Simple idea but was very nicely done. And I can watch the lines growing for hours..

Ersatz

29 Jan 2013

Deb Roy – The Birth of a Word

MIT researcher Deb Roy, wanted to understand how his infant son learned language,
so he wired up his house with cameras and microphones and for 3 years, he recorded almost every moment of his life. After processing 90.000 hours of video, his team extracted information and data about how a child tend to learn new words or where are their house social hotspots. It’s a really astonishing data-rich research about how we learn and interact.

Evan Roth – Multi Touch Paintings

http://www.evan-roth.com/work/multi-touch-paintings/

Could anybody steal your username and password by taking finger prints from your multi touch device, apparently not, if you play a lot of Angry Birds. Evan Roth created a series of provocative paintings with finger prints taken from his iPhone.

Skataviz by Theo Watson

Skataviz is an experiment using an iPod touch, attached to a skateboard, to visualize it’s movement in 3d space. I really love this project, because it shows how beautiful and complex skateboard tricks and movement can be.

Bueno

28 Jan 2013

rainbowVomit from Andrew Bueno on Vimeo.

After talking about my old waterboarding clock processing app in class the other day, I got a bit nostalgic for that old, lo-fi aesthetic. Thus, the crapsaccharine rainbow vomit app. I hooked up the FaceOSCSyphon app to Dan’s FaceOSC template for processing. I kept track mainly of the mouth. When its tracking points become wide enough apart, the vomit begins. It quite a bit of figuring out – Caroline Record was a huge help. Another source of help was a fellow on openProcessing – he is properly credited in my code. Without him, the app wouldn’t have that special brand of ridiculous.

https://github.com/buenoIsHere/RainbowVomit

 
//
// a template for receiving face tracking osc messages from
// Kyle McDonald's FaceOSC https://github.com/kylemcdonald/ofxFaceTracker
//
// 2012 Dan Wilcox danomatika.com
// for the IACD Spring 2012 class at the CMU School of Art
//
// adapted from from Greg Borenstein's 2011 example
// http://www.gregborenstein.com/
// https://gist.github.com/1603230
//
// Addendum from Bueno: Thank you florian on openFrameworks for the code!
import codeanticode.syphon.*;
import oscP5.*;

SyphonClient client;
OscP5 oscP5;
float[] rawPoints = new float[131];
float cWidth; 
float cHeight; 
PImage img;
Wave wav;

// num faces found
int found;

// pose
float poseScale;
PVector posePosition = new PVector();
PVector poseOrientation = new PVector();

// gesture
float mouthHeight;
float mouthWidth;
float eyeLeft;
float eyeRight;
float eyebrowLeft;
float eyebrowRight;
float jaw;
float nostrils;

void setup() {
  size(640, 480, P3D);
  background (random (256), random (256), 255, random (256));
  smooth();
  frameRate(30);

  oscP5 = new OscP5(this, 8338);
  oscP5.plug(this, "found", "/found");
  oscP5.plug(this, "rawDataReceived", "/raw");

  client = new SyphonClient(this, "FaceOSC");

  colorMode(HSB);
  wav = new Wave(width/2, height/2, 25, PI/18, 0);
}

void draw() {  
  if (client.available()) 
  {
    // The first time getImage() is called with 
    // a null argument, it will initialize the PImage
    // object with the correct size.
    //img = client.getImage(img); // load the pixels array with the updated image info (slow)
    img = client.getImage(img, false); // does not load the pixels array (faster)
    image(img,0,0);
    //background(255,0,0,0);
    if(found > 0) {
      float lastNum = 0; 
      int Idx = 0; 

      noFill();
      noStroke();
      if(dist(rawPoints[122], rawPoints[123], rawPoints[128], rawPoints[129]) > 25)
      {
        wav.paint = true;
      }
      else
      {
        wav.paint = false;  
      }

      wav.offsetX = (rawPoints[120] + rawPoints[124])/2;
      wav.offsetY = (rawPoints[121] + rawPoints[125])/2;
      wav.amplitude = rawPoints[124] - rawPoints[120] - 40;
      wav.display();
      wav.update();
   // ellipse (rawPoints[130],rawPoints[131], 2,2);  

    }
    else
    {
      println ("not found");
    }
  }
}

void mousePressed() {
  background (random (256), random (256), 255, random (256));
}

// OSC CALLBACK FUNCTIONS

public void found(int i) {
  println("found: " + i);
  found = i;
}

public void rawDataReceived(float [] f){
    for (int i = 0; i < f.length; i++)
    {
      rawPoints[i] = f[i];
    }
}

// all other OSC messages end up here
void oscEvent(OscMessage m) {
  if (m.isPlugged() == false) {
    println("UNPLUGGED: " + m);
  }
}
 
/* OpenProcessing Tweak of *@*http://www.openprocessing.org/sketch/46795*@* */
/* !do not delete the line above, required for linking your tweak if you re-upload */
/* Some fun with the sin function
 once you press the left button of the mouse, you can modulate
 the scale and the frequency of a  sine wave*/

// I tried to keep things clean, using OOP
//i'm 100% not sure about the grammar and the vocabulary in the comments

//this script is inspired by the awesome book "PROCESSING a Programming Handbook for Visual Designers and Artists"
// written by  Casey Reas and Ben Fry

class Wave {

  float offsetX; // this will position our wave on the X axis
  float offsetY;
  float amplitude;// this is for the wave height
  float frequency;//this will set the frequency(from batshit fast to insanely zoombastic)
  float angle;// it's an angle, every body knows that!
  boolean paint;

  //constructor
  Wave(float offX, float offY, float amp, float fre, float ang) {
    offsetX = offX;
    offsetY = offY;
    amplitude = amp;
    frequency = fre;
    angle = ang;
    paint = false;
  }

  void display() {

    // for each pixel on the x axis, A.K.A: on all the width of the screen
    for (float y = offsetY; y < = height ; y+=.2) {   

      /*So this is when it's getting all maths and stuff
       it's a neat formula that updates the y position of the ellipse you'll draw
       so, after some movement, it will look like a wave*/
      float posx = offsetX + (sin(angle)*(amplitude + map(y, offsetY, height,20,100)));

      /*you draw an ellipse
       the y position is increasing everytime you loop
       the x position is going up and down and up and down, and...
       my ellipse is 5 pixel high and 10 pixel width. this is how I like my ellipse*/
      ellipse(posx, y, 10,10);

      /* a nice and easy way to get RAINBOW colours
       (don't forget to set the colorMode to HSB in the setup function)
       h will set the hue
       the h value is calculated wirh a sin function and is mapped in order to get a value between 0 and 130*/
      float h = map(sin(angle), -1, 1, 0, 130);
      //here is our h again, for hue. saturation and brightness are at 255

      if(paint)
      {
        fill(h, 255, 255);
      }
      else
      {
        noFill();  
      }

      //don't forget to increase the angle by adding frequency
      // or your wave will be flat; you don't want that
      angle += frequency/2;
    }
  }

  /*this function will be called each frame
   it modifies amplitude and frequency, depending on the x and y coordinates of the mouse,
   once you press the left button*/
  void update() {
  }
}

Alan

28 Jan 2013

Screen Shot 2013-01-28 at 9.24.01 AM

The Github Repo: https://github.com/chinesecold/Rock-Scissor-Paper


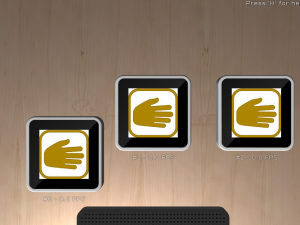
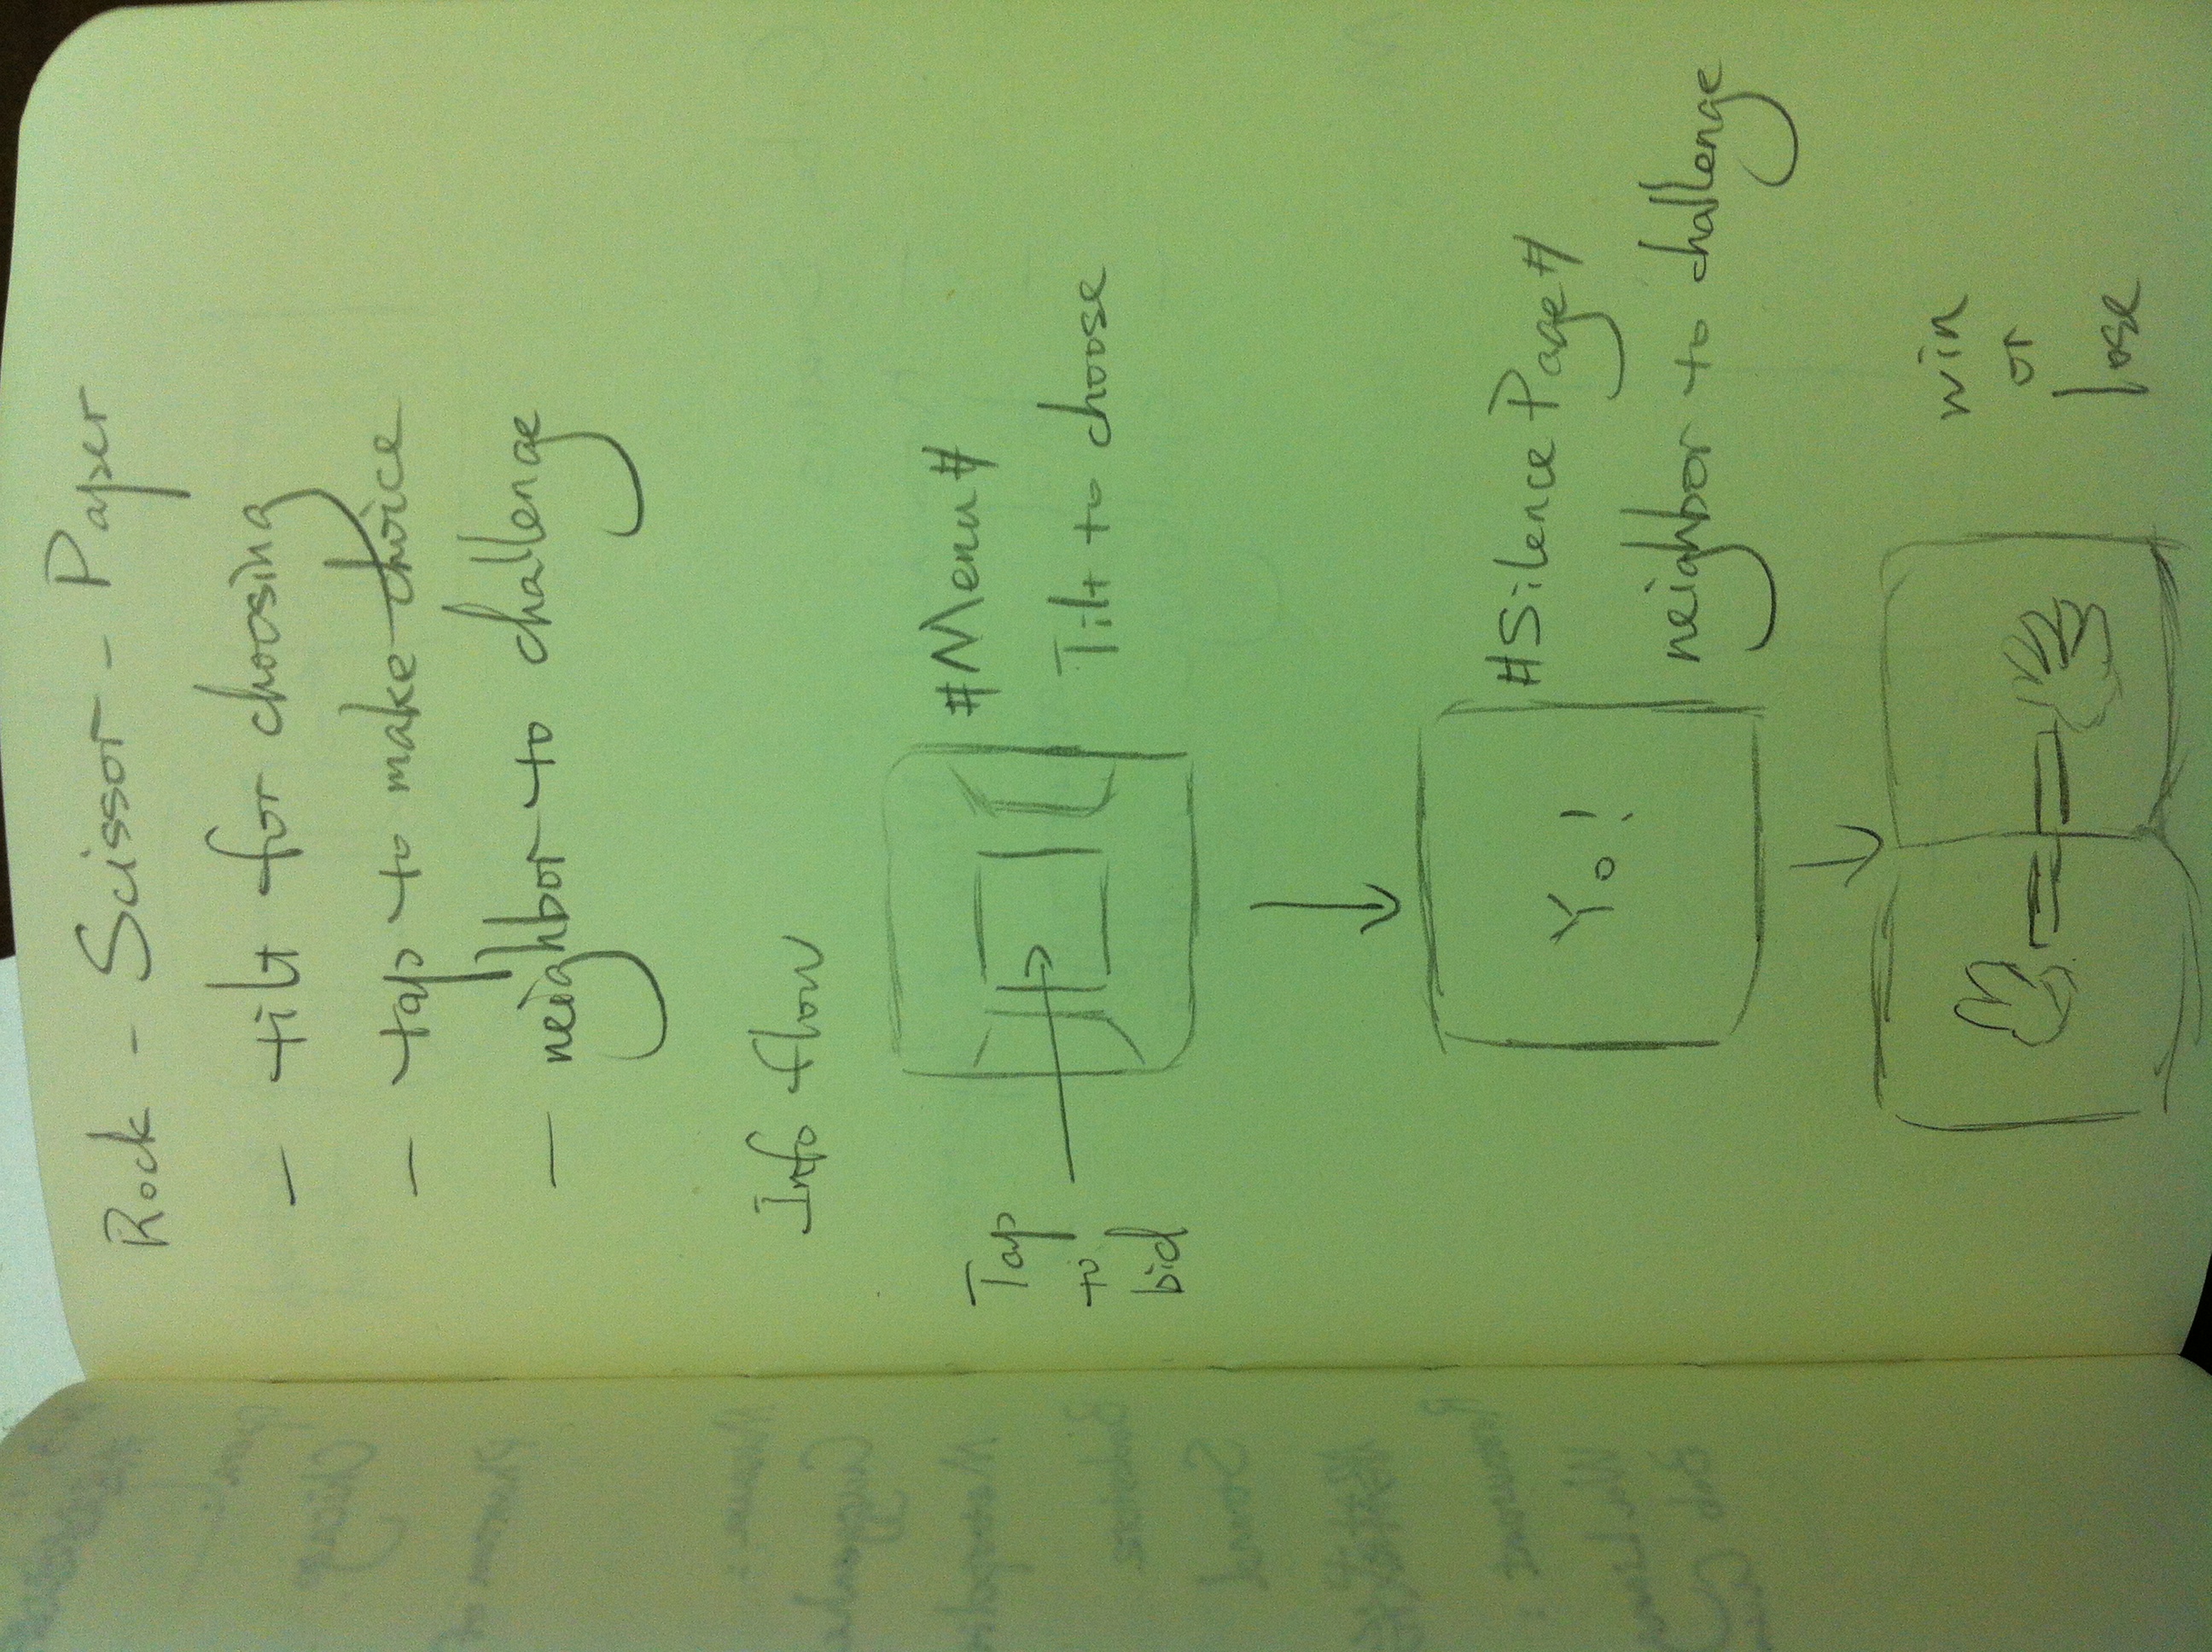
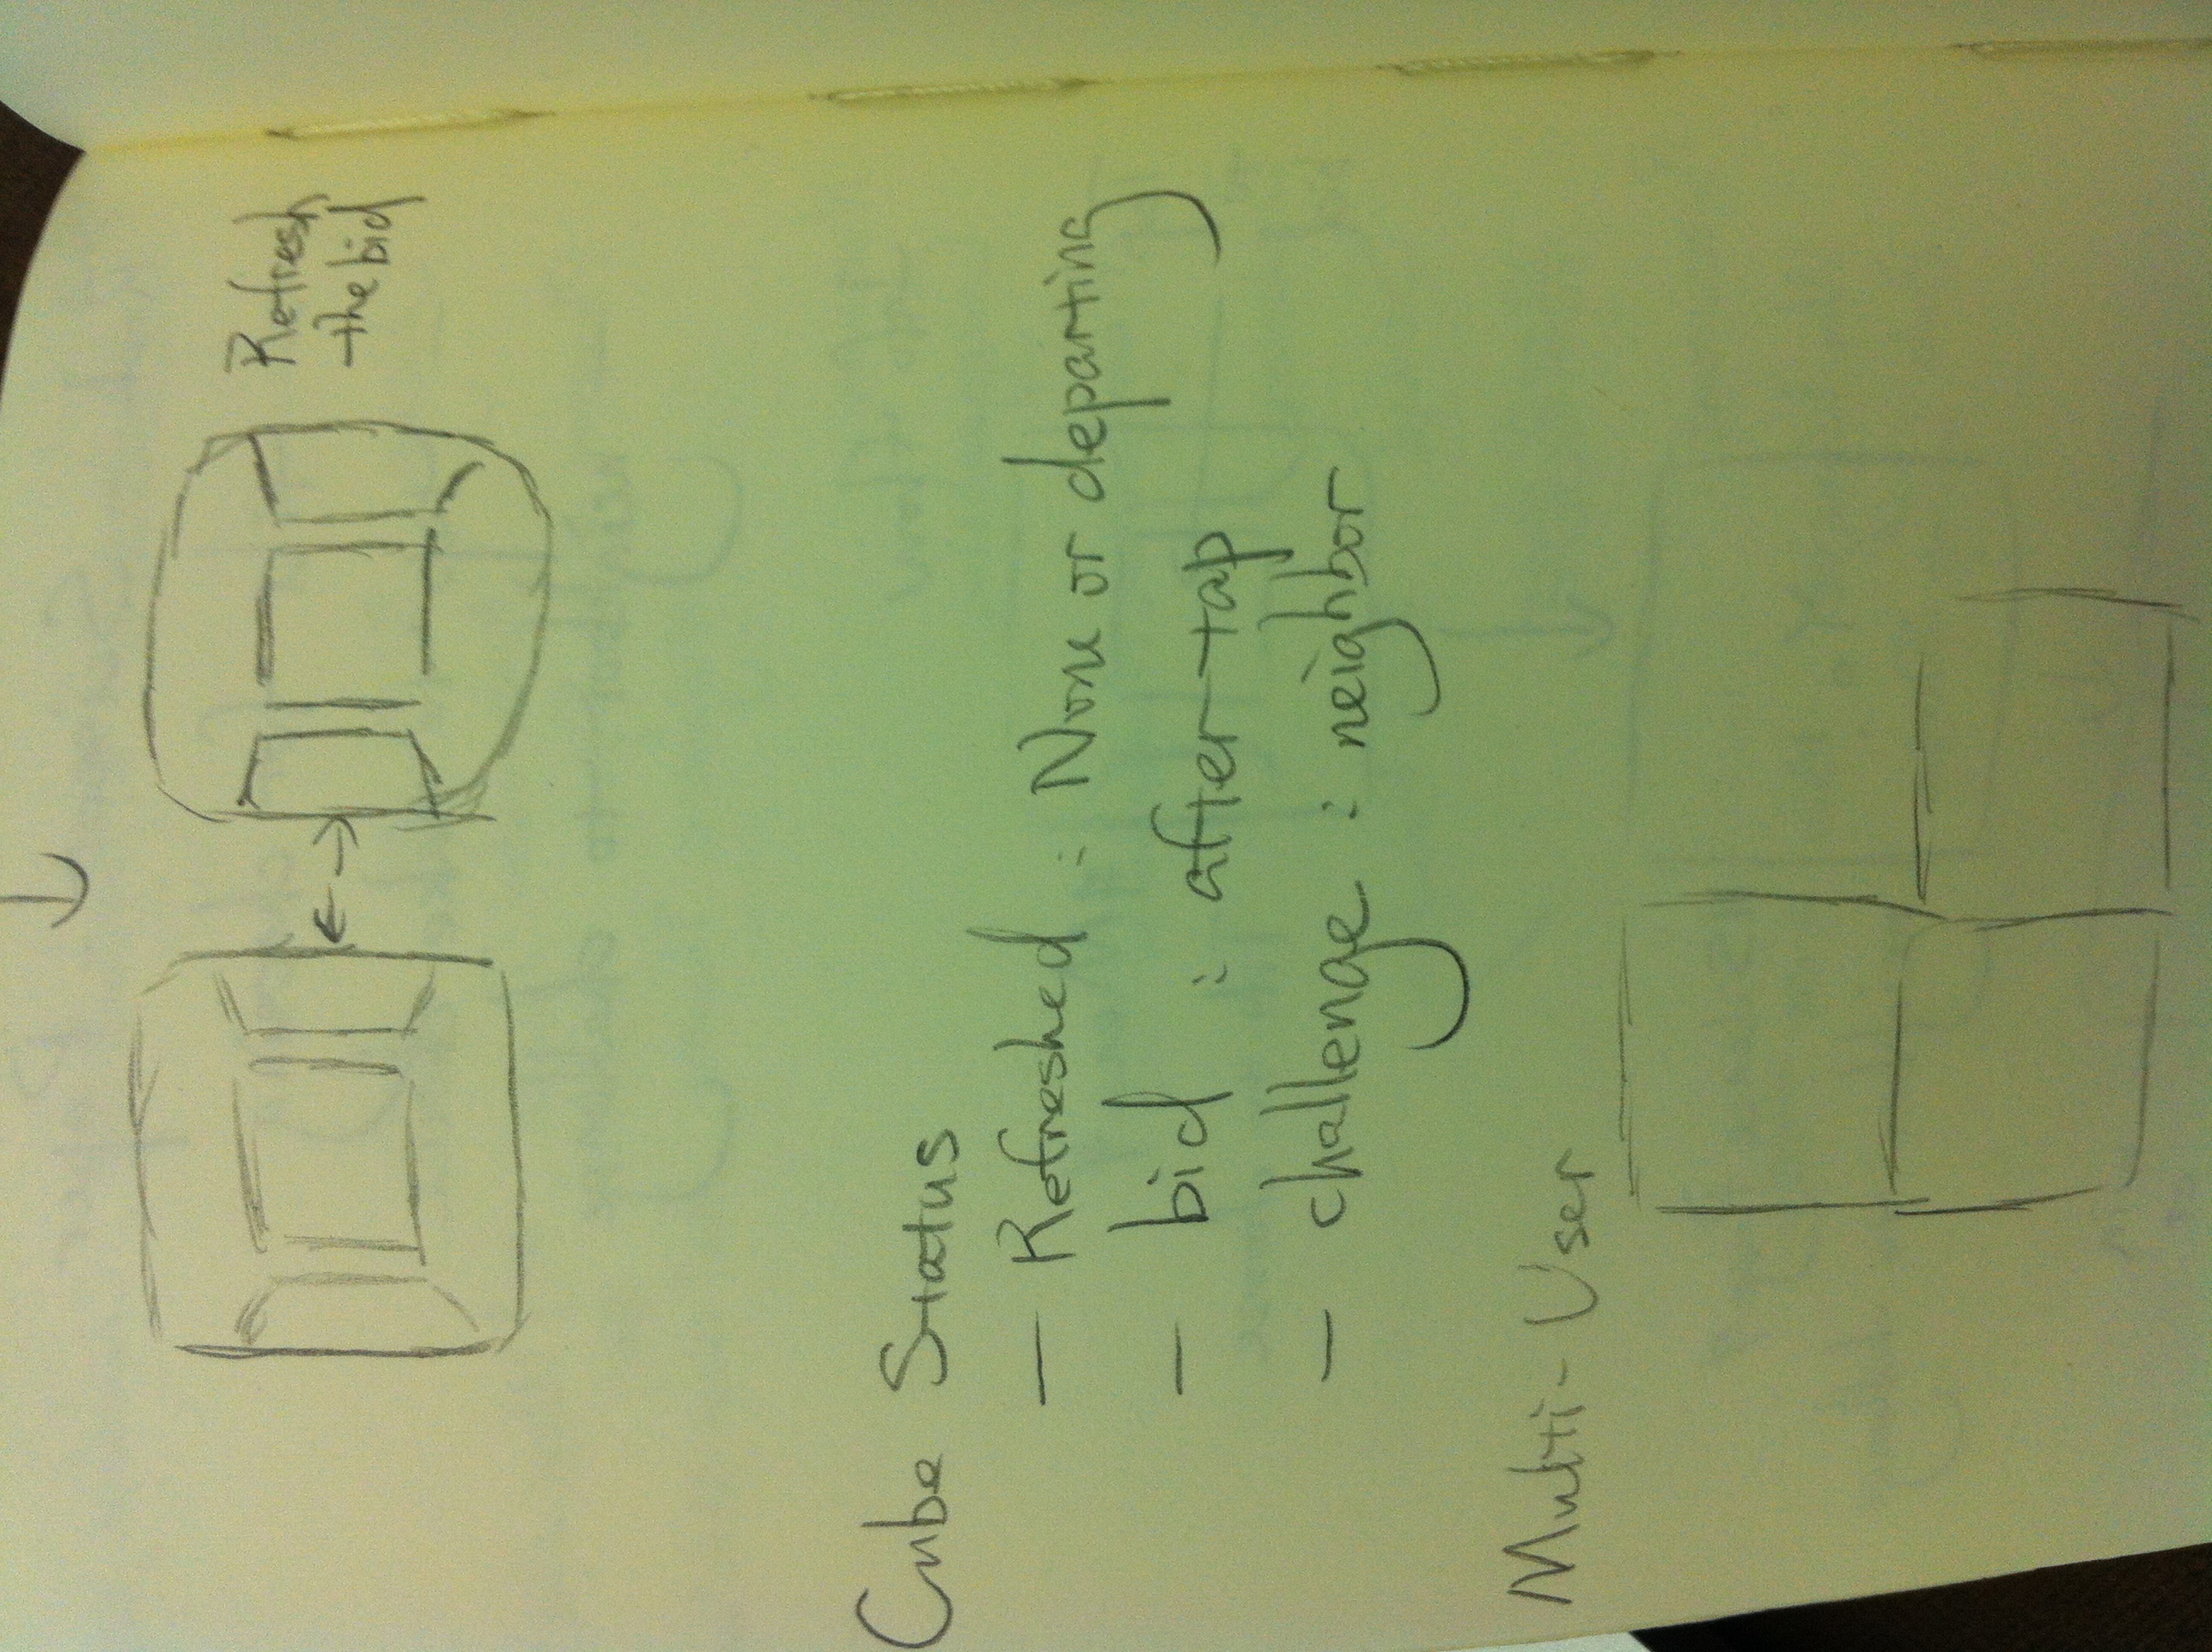
This project is designed to implement Rock-Paper-Scissor game on Sifteo devices. With each user using one cube, it allows users to bid their choices by tilting and tapping and to challenge other players by neighboring others’ devices.

sifteo1sifteo2

Bueno

28 Jan 2013

Screen Recording 3 from Andrew Bueno on Vimeo.

I happen to take my webcam wiggling very seriously, thank you very much. I managed to get a pretty decent psychedelic effect with extremely minimal effort – basically I took the ofxOpticalFlowFarneback example and mixed it with the example for ofxBlur. The result is cool, though I wish the blur wouldn’t gray out as much as it seems to. My original plan was to utilize ofxAsciiArt as a filter for the colorful effects of ofxOpticalFlowFarneback, but the creator of it had a rather strange set of dependencies going on.

https://github.com/buenoIsHere/ofxAddonsExample

 
#include "testApp.h"

//--------------------------------------------------------------
void testApp::setup(){

    vidGrabber.initGrabber(640, 480);
    flowSolver.setup(vidGrabber.getWidth()/2, vidGrabber.getHeight()/2, 0.5, 3, 10, 1, 7, 1.5, false, false);
    ofEnableAlphaBlending();
    blur.setup(vidGrabber.getWidth(), vidGrabber.getHeight(), 4, .2, 4);
}

//--------------------------------------------------------------
void testApp::update(){
    vidGrabber.update();
    if(vidGrabber.isFrameNew()){
        flowSolver.update(vidGrabber);
    }

    blur.setScale(ofMap(mouseX, 0, ofGetWidth(), 1, 10));
	blur.setRotation(ofMap(mouseY, 0, ofGetHeight(), -PI, PI));
}

//--------------------------------------------------------------
void testApp::draw(){

    ofSetColor(255, 255, 255);

    blur.begin();
    vidGrabber.draw(0, 0);
    flowSolver.drawColored(vidGrabber.getWidth(), vidGrabber.getHeight(), 10, 3);
    ofSetCircleResolution(64);
	ofCircle(mouseX, mouseY, 32);
	blur.end();

    blur.draw();

}

//--------------------------------------------------------------
void testApp::keyPressed(int key){
    if(key == 'p') { flowSolver.setPyramidScale(ofClamp(flowSolver.getPyramidScale() - 0.01,0.0,1.0)); }
    else if(key == 'P') { flowSolver.setPyramidScale(ofClamp(flowSolver.getPyramidScale() + 0.01,0.0,1.0)); }
    else if(key == 'l') { flowSolver.setPyramidLevels(MAX(flowSolver.getPyramidLevels() - 1,1)); }
    else if(key == 'L') { flowSolver.setPyramidLevels(flowSolver.getPyramidLevels() + 1); }
    else if(key == 'w') { flowSolver.setWindowSize(MAX(flowSolver.getWindowSize() - 1,1)); }
    else if(key == 'W') { flowSolver.setWindowSize(flowSolver.getWindowSize() + 1); }
    else if(key == 'i') { flowSolver.setIterationsPerLevel(MAX(flowSolver.getIterationsPerLevel() - 1,1)); }
    else if(key == 'I') { flowSolver.setIterationsPerLevel(flowSolver.getIterationsPerLevel() + 1); }
    else if(key == 'a') { flowSolver.setExpansionArea(MAX(flowSolver.getExpansionArea() - 2,1)); }
    else if(key == 'A') { flowSolver.setExpansionArea(flowSolver.getExpansionArea() + 2); }
    else if(key == 's') { flowSolver.setExpansionSigma(ofClamp(flowSolver.getExpansionSigma() - 0.01,0.0,10.0)); }
    else if(key == 'S') { flowSolver.setExpansionSigma(ofClamp(flowSolver.getExpansionSigma() + 0.01,0.0,10.0)); }
    else if(key == 'f') { flowSolver.setFlowFeedback(false); }
    else if(key == 'F') { flowSolver.setFlowFeedback(true); }
    else if(key == 'g') { flowSolver.setGaussianFiltering(false); }
    else if(key == 'G') { flowSolver.setGaussianFiltering(true); }
}

//--------------------------------------------------------------
void testApp::keyReleased(int key){

}

//--------------------------------------------------------------
void testApp::mouseMoved(int x, int y ){

}

//--------------------------------------------------------------
void testApp::mouseDragged(int x, int y, int button){

}

//--------------------------------------------------------------
void testApp::mousePressed(int x, int y, int button){

}

//--------------------------------------------------------------
void testApp::mouseReleased(int x, int y, int button){

}

//--------------------------------------------------------------
void testApp::windowResized(int w, int h){

}

//--------------------------------------------------------------
void testApp::gotMessage(ofMessage msg){

}

//--------------------------------------------------------------
void testApp::dragEvent(ofDragInfo dragInfo){ 

}