Category Archives: 23-parametricobject

pedro

10 Feb 2015

lamptree

Let the light grow is a generative system by @pveloso13 that enables the creation of a tree lamp for your room.

treelr

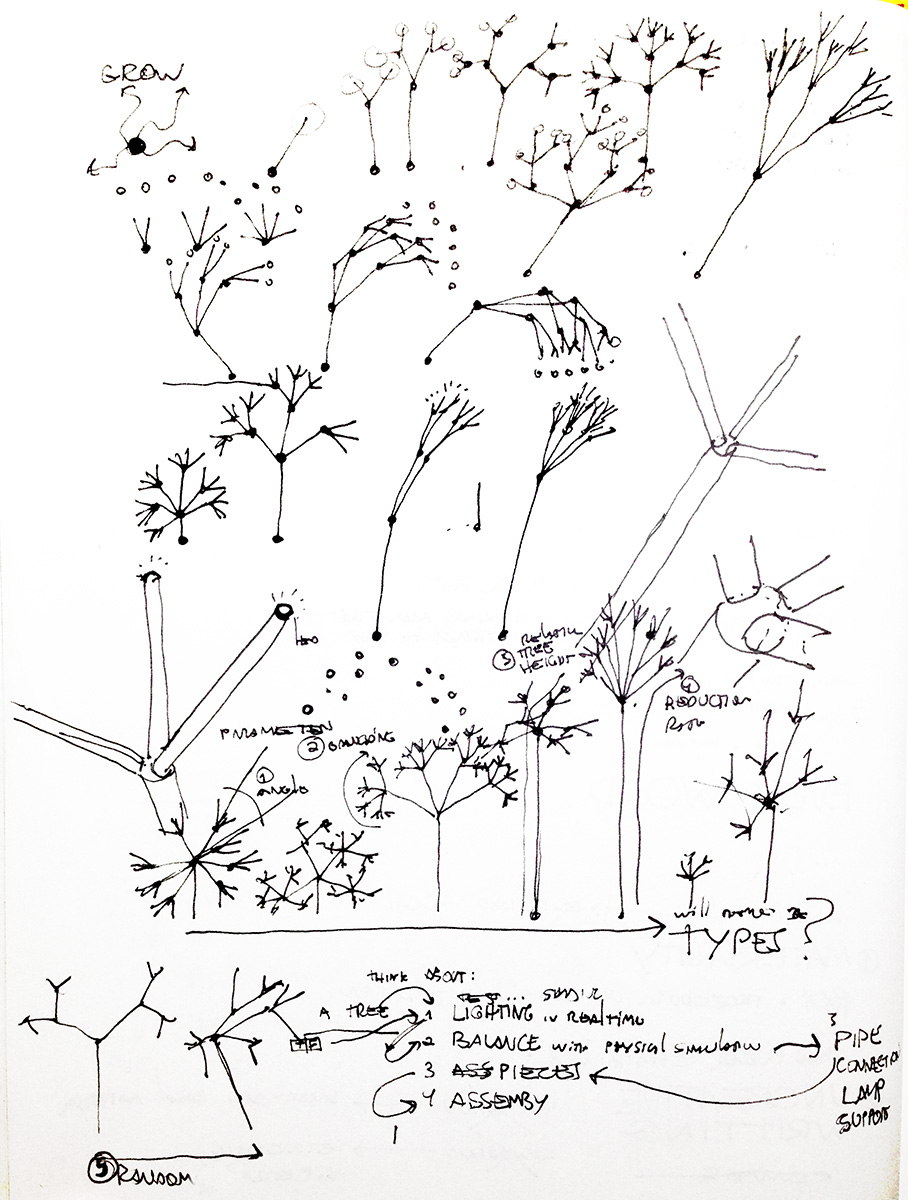
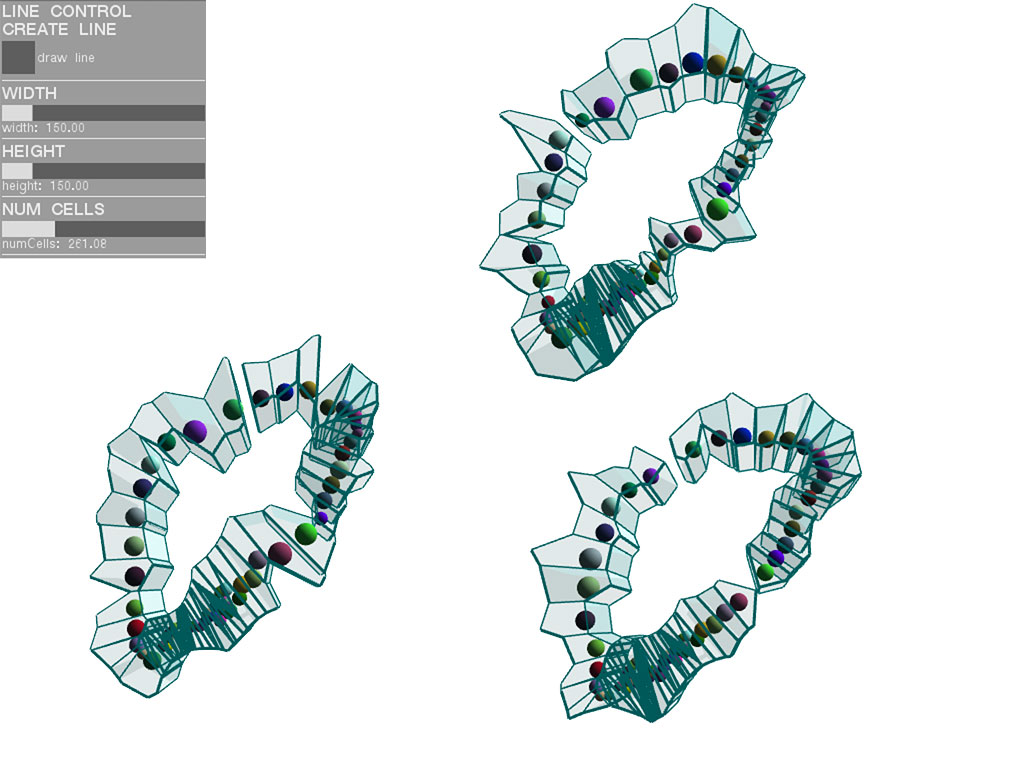
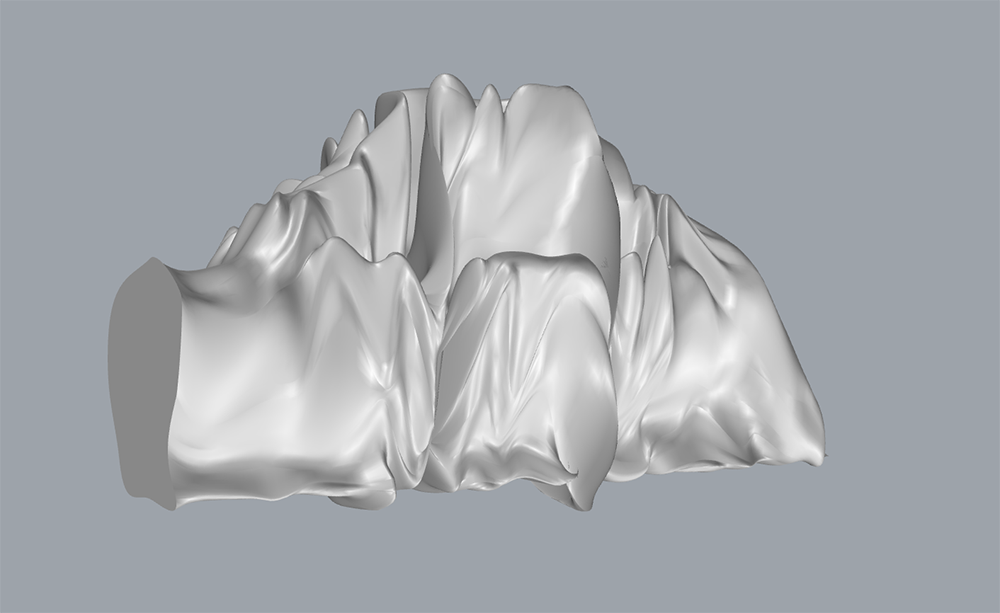
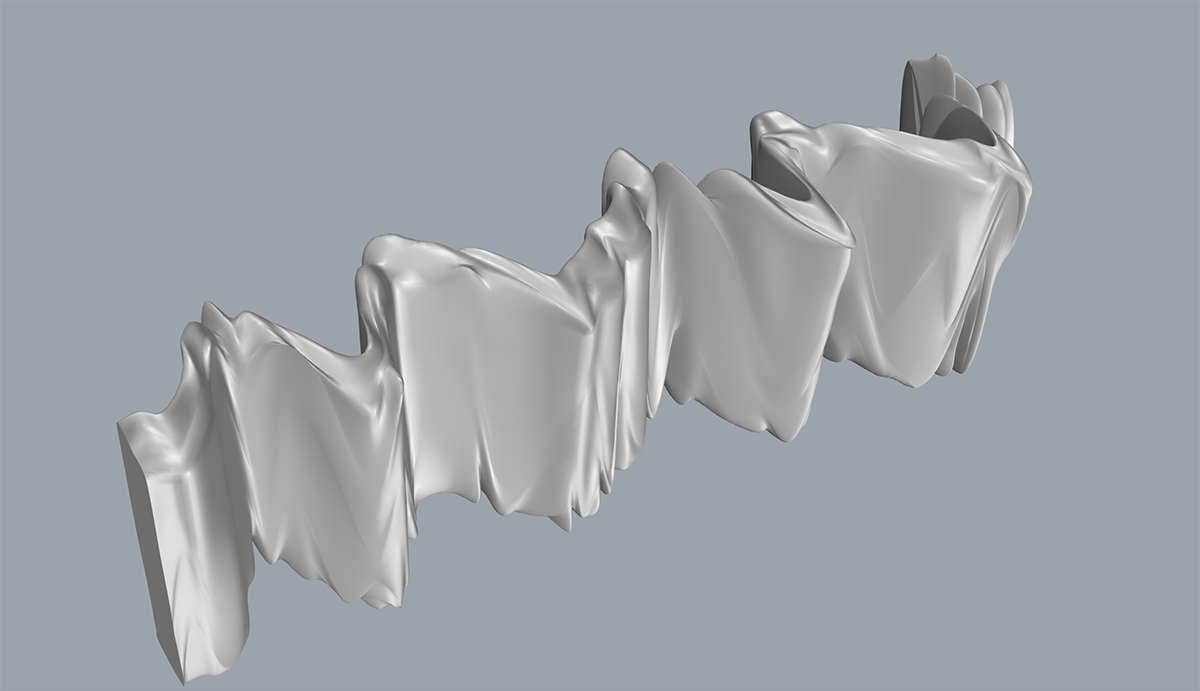
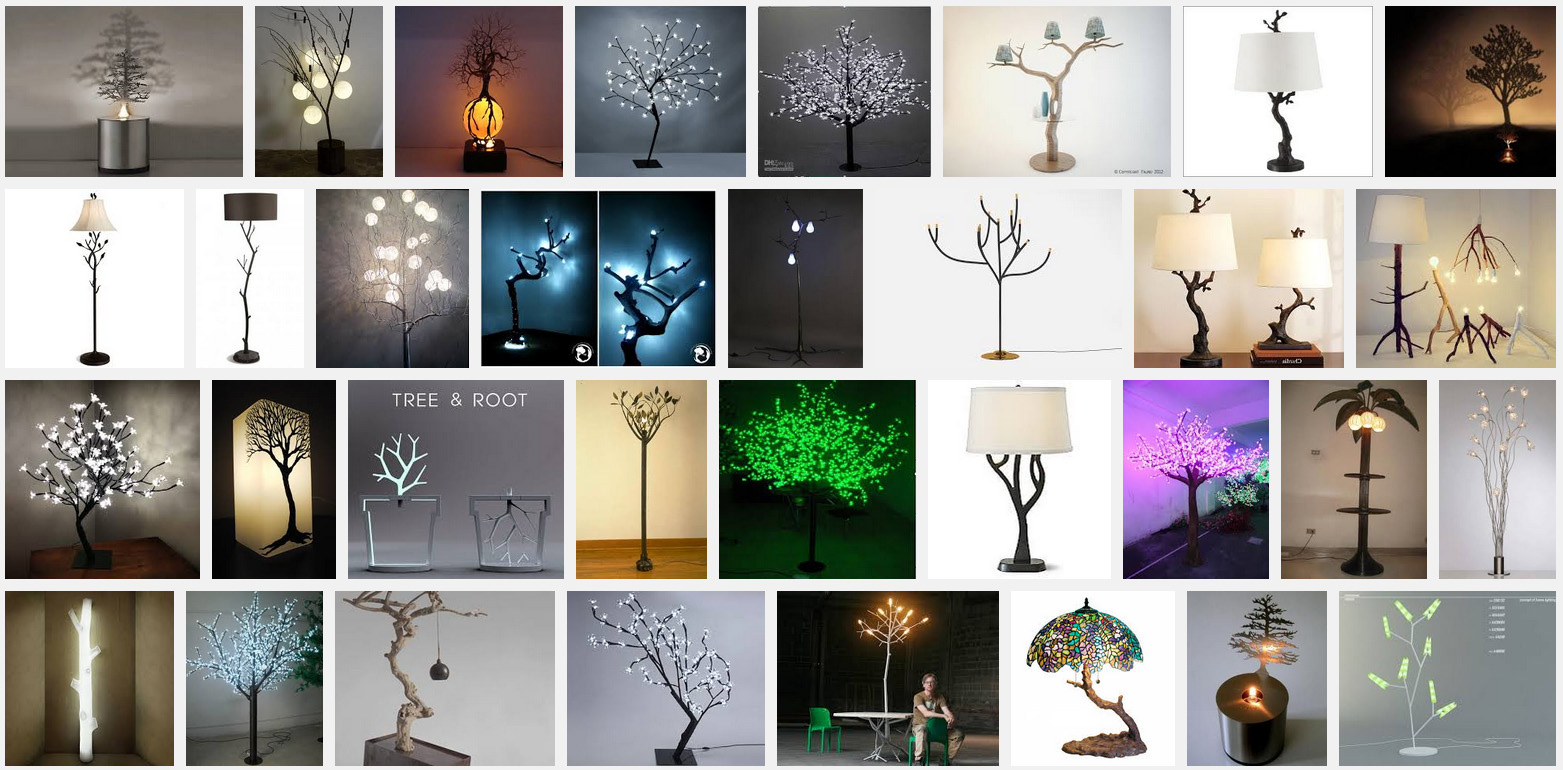
A tree is a very meaningful thing. It grows, it adapts to the environment and at the same time that it is part of a large family, it is unique. One one hand, it seems to be a very great idea to have a tree in your room as a lamp. On the other hand, Google search shows that you can find many lamps inspired by trees. But why choose if you can design a tree lamp that fits perfectly to your needs? Besides, what is the value of having a unique design, customized and assembled by yourself? This lamp is produced by based a tree fractal controlled by specific parameters such as angle of the branches, branch division, reduction between branches, size, generations and a random factor. After defining  the basic type of the tree, the user can choose optional features, such as the type of illumination, the optimization of the branches (string and repulsion algorithms) or the simulation of the light. Them, let the program calculate the material and (dis)assemble the parts.

Some of the problems you had to solve in developing it;
-Hardware limited to deal with the combined transformations, what demanded a more linear customization of the tree.

What you think you did well:
-I believe that the tree is a very intriguing object and it fits perfectly for a parametric lamp.

What you could have done better:
-as Golan and Google said, a fractal tree is not the most original object… but with more time, I would like to break the topology of the fractal tree and develop more details for joints and installation.

The system was developed with Rhino + Grasshopper + GHPython + Kangaroo. Below (or in GitHub) is the GHPython base algorithm for the tree:

import rhinoscriptsyntax as rs
import Rhino.Geometry as rg
import random
import rhinoscriptsyntax as rs
from Grasshopper.Kernel.Data import GH_Path
from Grasshopper import DataTree

lights = []
base_tree.Clear()
tree = base_tree

def createBranch(base_branch, cur_len, max_ang, num, ang):
    ang_cone = max_ang + random.randrange(-10, 11) / 10 * rand_factor * max_ang / 2
    ang_plane = num * ang + random.randrange(-10, 11) / 10 * rand_factor * ang / 2
    old_vector=rs.VectorCreate(base_branch.To, base_branch.From)
    new_vector = rs.VectorUnitize(old_vector)
    new_vector = rs.VectorScale(new_vector, cur_len)
    MutationPlane = rs.PlaneFromNormal((0,0,0), new_vector)
    new_vector = rs.VectorRotate(new_vector, ang_cone, MutationPlane.YAxis)
    new_vector = rs.VectorRotate(new_vector, ang_plane, old_vector)
    return rg.Line(base_branch.To, new_vector)
    #return rs.AddLine(base_branch.To, base_branch.To + new_vector)

root_branch = rg.Line(rg.Point3d(0,0, -10), rg.Point3d(0, 0, 0))
base_branches=[]
cur_branches=[]
all_branches=[]
total_fac = 0
for i in xrange(gen):
    total_fac += factor ** i
cur_len = max_len / total_fac
first_branch = createBranch(root_branch, cur_len, rand_factor * random.random() * 20, 0, 360 )
all_branches.append(rs.coerceline(first_branch))
base_branches.append(rs.coerceline(first_branch))
path = GH_Path(0)
tree.Add(first_branch, path)

for i in xrange(1,gen):
    cur_len *= (factor + factor * random.randrange(-2, 2) / 10 * rand_factor)
    path = GH_Path(i)
    for j in xrange(0,len(base_branches)):
        new_range = max(1, max_branch + random.randrange(-2, 2) * rand_factor)
        for k in xrange (0, new_range):
            ang = 360 / max_branch
            new_branch = createBranch(base_branches[j], cur_len, max_ang, k, ang )
            if i == gen - 1:
                lights.append(new_branch.PointAt(1.0))
            cur_branches.append(new_branch)
            tree.Add(new_branch, path)
    base_branches = cur_branches
    for branch in cur_branches:
        all_branches.append(branch)
    cur_branches=[]

mmontenegro

09 Feb 2015

Voro Snake

I had a lot of trouble with this assignment. I struggled coming up with an idea that would actually work. After doing some research for inspiration, i decided to do something abstract.

I was looking at some very cool stuff done with voroni cells and decided to give them a try.
I wanted my object to be as closed to the user as possible, so i decided to allow the user to create it by drawing a shape with the mouse. After the shape was draws, a voroni cell pattern will simulate the shape the user did.

To be able to manipulate it, I added three main constraints: width, height and number of subdivisions. The interface has an UI that allows the user to easily change this parameters to construct their shape.

parametric_3parametric_1

You can rest it at any point and re draw another line or keep changing the parameters of the objects. I called it Voro Snake because I realized that most of the shapes end up looking like a very abstract snake :)


The code can be found here: https://github.com/mariale888/AbstractParametric

chen

09 Feb 2015

Twittable summary: What I image my donut would be before opening my oven. Created by @chen.

Get github code: OpenSCAD code

I create a donut which is baked in a very weird way. I chose donuts to model because I was eating donuts when I started to think what to create. Donuts are easy to model but I still need a good idea to modify the shape of donuts.

In the beginning, I used Rhino + Python to randomly modify the control points of perfectly baked donuts according to the ScrewUpRate.

Here are the result:

Low ScrewUpRate

oie_1034940t2F8Iuxr

It seems good, but…

At high ScrewUpRate:

oie_1034913YK3XRwNj

:)

So I wisely choose to move the platform from Rhino to OpenSCAD–Rhino is hard to digest for me.

Fortunately, OpenSCAD is beginner friendly, so I continued my journey to screw up donuts.

Here is the perfect donut:

0 ScrewUpRate
by chenlian
on Sketchfab


Here is when 0.5 ScrewUpRate is applied:

0.5 Rate
by chenlian
on Sketchfab


And here is the complete failure donut:

1 Rate
by chenlian
on Sketchfab


At this point, I should say I was not trying to make donuts–what I secretly tried is alien ship.

Here is the scratch:

oie_1041634LHfk4CYw


module whoScrewedUpMyDonut(screwUpRate)
{
	R = 179;
	G = 97;
	B = 28;
union(){
	color([(1-screwUpRate)*R/255, (1-screwUpRate)*G/255, (1-screwUpRate)*B/255]){
	
		rotate_extrude(convexity = 10, $fn = 100)
			hull(){
				translate([15, 0, 0])
 					circle(r = 10); 
		
				translate([screwUpRate*25+20, screwUpRate*(-5), 0])
					circle(r = 5);
			}
    }

	for ( i = [0 : 9] )
	{
    rotate( i * 360 / 10, [0, 0, 1])
    translate([(35+screwUpRate*25)/2, 0, 0])
    sphere(r = (screwUpRate*25+25-(35+screwUpRate*25)/2)/2, $fn = 50);
	}
}
}

// choose a screwUpRate from 0-1
whoScrewedUpMyDonut(0);

dantasse

09 Feb 2015

CheeseHoods: a block of Swiss cheese as dense as your neighborhood. By @dantasse.

CheeseHoods are blocks that look like Pittsburgh neighborhoods. They have holes in them like Swiss cheese. The denser the neighborhood is, in terms of dwellings per acre, the fewer holes it has.

Why neighborhood blocks? I thought it’d be fun to have a jigsaw puzzle of Pittsburgh, really. Plus, just as playing with world maps helps kids learn country names, playing with your city might help you learn more about it.

Why the holes? Density is important. Jane Jacobs wrote about it as one of the four most important characteristics in creating vibrant neighborhoods. Dwelling density, in particular, is quite important; human density can just indicate overcrowding, but dwelling density indicates vitality. I was interested to explore what density looks and feels like in 3D. Putting holes through a neighborhood seemed like an easy way to do so. Plus, it gives the least dense neighborhoods a rather icky pock-marked feel, while thriving denser ones are pleasantly solid, so this gives a really visceral feel to “density is good”.

Pictures

bloomfield

just Bloomfield, above.

Below, all of Pittsburgh.

pittsburgh

central oakland

Central Oakland is a shining example of density, but you can see right through Greenfield (below).

greenfield

Code’s on github. Not embedding it here because there’s a lot. I used some tools from another repo (get_dwelling_densities.py) plus some census data to calculate dwelling density for each neighborhood, then computed a json file of all the borders of each neighborhood and random hole locations (nghd_to_shape.py), then finally slurped those into a last script that created objects in Rhino (rhino_script.py).

Play with ’em:

Bloomfield by dantasse on Sketchfab

Pittsburgh by dantasse on Sketchfab


Sketches

IMG_20150209_212039

Alex Sciuto

09 Feb 2015

parametric-top

Tweetable summary: OpenFrameworks + Python + Rhino by Alex Sciuto: A physical trace of an object’s previous positions. Record an object’s movement over time and extrude it.

I was at a loss for what to turn into a parametric object. No objects were coming to me that announced, “this could be parametrized in a meaningfully interesting way.” So I expanded my thinking around what a parameter could be. Could it be my own data? Could I give the program I was going to make my location data, and it would output a parametrized shape of my previous month’s location data? This line of thinking intrigued me, but the location data didn’t feel right. My ideas for converting location data into an object were all very abstract and data-vizzy. One interesting idea I did have was to create little objects that could attach to shoe strings that would show off how much I walk.

So I went looking for other unconventional sources of data that could be provide the inputs for a parametrized object. For the ofxAddons assignment, I had wanted to do something with computer vision, but since it was a pre-installed addon, adding in computer vision would just make that assignment more difficult. But in exploring the ofxOpenCV addon, I had seen the cool blob detector example that detects the outlines of objects in the field of vision. I was mesmerized by how they morphed and changed as I moved and twisted my hand. I decided that taking this cool undulations and turning them into a 3d object would be a cool experiement that would allow me to play with ofxOpenCV.

What worked well? I got a printable object. I was able to combine openFrameworks with Rhino using Python scripting. What didn’t work well? The concept was a lot less exciting that I originally thought. Most objects just produce non-descript blobs. If I were to take this project further, I’d need to come up with a better setup for recording blobs.

3D model:

Some Photos:

cvAbove: screen grabs from the hand-tracking application.

Screen Shot 2015-02-09 at 11.18.24 AMAbove: A scissor opening and closing.

Screen Shot 2015-02-09 at 11.21.41 AMAbove: The top of a plate.

Screen Shot 2015-02-09 at 11.24.40 AMAbove: Another view of a hand.

Screen Shot 2015-02-09 at 11.46.46 AMAbove: A ruler waving back and forth.

Github Repo. And finally the RhinoPython script:

#!/usr/bin/env python

import rhinoscriptsyntax as rs
import random
import math
import json


# load the json file that inclues all the points
filePath = "/Users/alex/Documents/of/apps/myApps/opencvexport/bin/data/opencvtest.json"
f = open(filePath, 'rw');
jsonData = json.loads(f.read());


# Get the bounding points for the object, so we can center it later.
minx = 99999
maxx = -999999
miny = 99999
maxy = -999999
for obj in jsonData["data"]:
    for i in obj:
        if(i[0] > maxx):
            maxx = i[0]
        if(i[0] < minx):             minx = i[0]         if(i[1] > maxy):
            maxy = i[1]
        if(i[1] < miny):
            miny = i[1]
        

# Set up the spacing variables
offset = 10
length = offset*len(jsonData["data"])
initialOffset = -.5 * length

width = maxx - minx
print maxx
print minx
widthOffset = -.5 * width


# iterate through the frames and create points from blob points. This implementation
# assumes one blob for one frame. I belive Rhino could handle multiple blobs, but I didn't explore this.

planeList = [];
for frame in jsonData["data"]:
    
    blobList = [];
    
    for i in frame:
        pt = (initialOffset, i[0] - widthOffset - 240, 320-i[1] - miny)
        blobList.append(pt)
    
    #close the curve. There is no closeCurve command. You just have to end the curve
    #at the same spot where you began.
    pt = (initialOffset, frame[0][0] - widthOffset - 240, 320-frame[0][1] - miny)
    blobList.append(pt)
        
    planeList.append(blobList)
    
    initialOffset+=offset
        

# Draw the curves and store their IDs in a list.
curvelist = []
for plane in planeList:
    crv = rs.AddCurve(plane)
    curvelist.append(crv)

#These are the methods for creating the lofted shape and removing the unnecessary curves,
#I found I needed to do some editing of the initial and end frames, so I mostly did these commands manually

#loft = rs.AddLoftSrf(curvelist, 0, 2, 1);
#rs.CapPlanarHoles(loft)
#
#rs.DeleteObjects(curvelist)