Daily Archives: 07 Feb 2013

Marlena

07 Feb 2013

http://infosthetics.com/archives/2012/12/bomb_sight_mapping_the_ww2_bombs_that_fell_on_london.html

Screen Shot 2013-02-07 at 12.21.03 PM

I grew up learning about the Battle of Britain in just about every history class I took. As school history books don’t usually focus on conveying the feeling of an event so much as the sequential events, it never really occurred to me how many bombs were actually dropped on London. Seeing a map of all of the bombs dropped mad me pause for a while–it doesn’t show the effects of the bombs, the million of English homes destroyed, and the 40,000 civilians killed but it shows the carpeting of the London map with bombs. Just by looking at the amount of red on the page gives you a little bit more insight into this aspect of World War II that you may not have previously been able to fully grasp.

http://number27.org/assets/work/extras/maps/transportation-big.jpg

Screen Shot 2013-02-07 at 12.33.07 PM


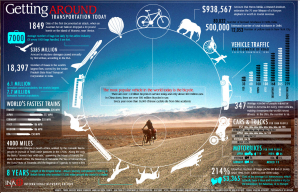
This is a very beautiful infographic by Jonathan Harris about the most common forms of transportation around the world. It does not contain a huge amount of information–it gives the reader a tidbit of information about each type of transportation. This is actually a good design choice: the more information about each form of transportation was present, the more the focus would be drawn away from the main focus: the variety of transportation methods available in the world today and by extension the enormous range of what constitutes “everyday life”. This infographic elegantly reminds us that there are other people living out there in the world by using a human tool, transportation, as its proxy.

http://www.guardian.co.uk/world/interactive/2012/may/08/gay-rights-united-states

Screen Shot 2013-02-07 at 12.52.17 PM

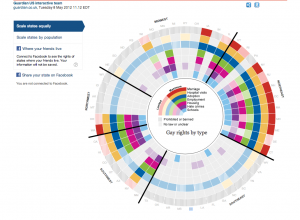
Here’s an infographic by the Guardian that shows the various gay rights related laws by region and state in the United States. Upon clicking on a state the reader gets a more detailed description of the rights available to members of the LGBT community such as rights to marriage, protection from discrimination, and the right to adopt. It really brings to light the division across the country on the issue of gay rights as well as the broad range of issues that members of the LGBT community has to face in everyday life. We hear about gay rights all the time but this infographic really helps to organize the facts in a reasonable, easy to read, and easy to compare manner.


Ersatz

07 Feb 2013

Twitter Faces

Does social networks have emotions? For this project, I would like to experiment and try to put a face and extract expressions from Tweets around the world. The idea is to get a decent amount of recent tweets around the center of a big city, for example New York, do a basic sentiment analysis and extract an average mood of the people posting. The application will run in real time and I will query for new tweets every 5 or 10 minutes, this way I could create a lively face, that constantly changes mood and expressions. I think it will be really interesting to see the overall mood of people in a certain city, are they happy when there is a big event coming up, or are they sad, if something bad has happend. For the moment, I will use a really basic sentiment analysis, using only dictionaries with positive and negative words, but along the way, I could switch to a more complex method, if I find something suitable for real time processing.

Here is just a quick sketch I did in Illustrator, just to show how the application might look. The idea is that the face and expression changes will be animated, so we could get that lively feel. Also, I could list the most mentioned positive or negative words.

Twitter Faces

I will probably implement the app in Openframeworks, but I am also thinking about doing an online version, probably using Processing.js

Any comments are welcomed!

~Taeyoon

07 Feb 2013

1. They Rule (voted for interesting dataset)

theyrule_01Josh On’s ‘They Rule’ visualizes interconnectedness of corporations that govern commerce and politics in the US. It is based on LittleSis. (LittleSis is a free database detailing the connections between powerful people and organizations.) While They Rule does not promise accurate representation of the major figures in the US, it does portray honest picture of stakeholders at work. It is true that the dataset available on LittleSis is interesting and resourceful, however it is only when they are visualized on ‘They Rule’ that the power structure becomes visible.


2. Valse Automatique (voted for provocative)

VALSE AUTOMATIQUE PROJECT| MADE from MADE on Vimeo.

Screen Shot 2012-12-08 at 8.59.45 AM5476622411_cc92d0385f_b

This project combines experimental rapid prototyping with music via data visualization. I think of this project as a provocative example of working with data because of it’s technical ambition. The symbiosis between sound and material (wax) is achieved by data transformed through various software platform (SuperCollider-Rhino/Grasshopper) and executed for fabrication by a giant robot arm. Additional visualization was created to help audience understand the process.

3. 3D printed disc for Fisher Price Toy Record Player (voted for well crafted)


This instruction by a maker named Fred is an interesting approach to materializing musical data. He wrote a software (windows only) which wraps musical notes to Fisher Price record. With data ready for OpenScad software, (which I have grown more interested about recently) you can make a STL file to 3D print your record. I love the way the project is documented and made available online. There are participants 3d prints of the records.

http://www.instructables.com/id/3D-printing-records-for-a-Fisher-Price-toy-record-/?ALLSTEPS

I guess the next step is 3D printed record.