Eye Tracker Display Interface
Where do people look when given different images dealing with basketball? Does this relate to where one looks during a real basketball game? How do people change where they look based on their knowledge base of the game of basketball?
What Ive done:
Part 1: Created program to save data from eyetracker from several participants, also created the display of images shown to participants on timer. Finally created a survey to better understand the demographics and basketball background of each participant.
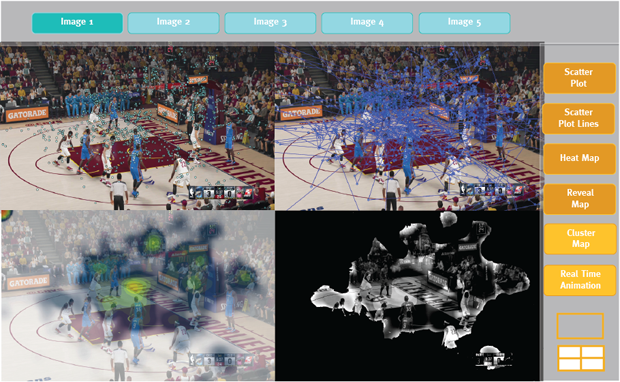
Part 2: Created program to aggregate all of the participants eyetracker data, and create different analysis charts based on which images were shown on the current screen. Currently I have Scatter Plot, Scatter Line Plot, Heat Map. Working towards Revealing Map, other comparisons.
Scatter Plot Map 
Lined Scatter Plot Map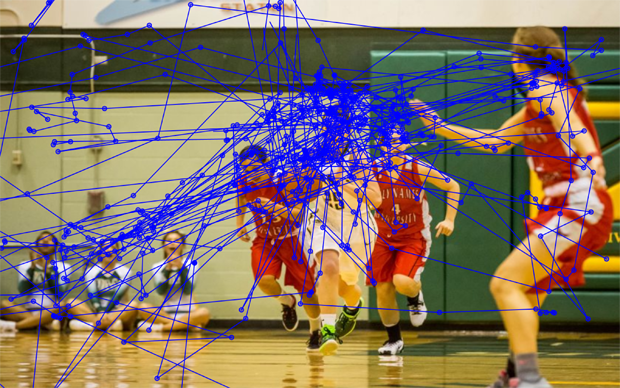
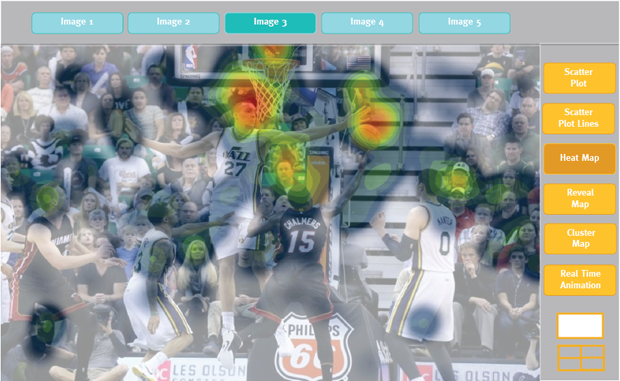
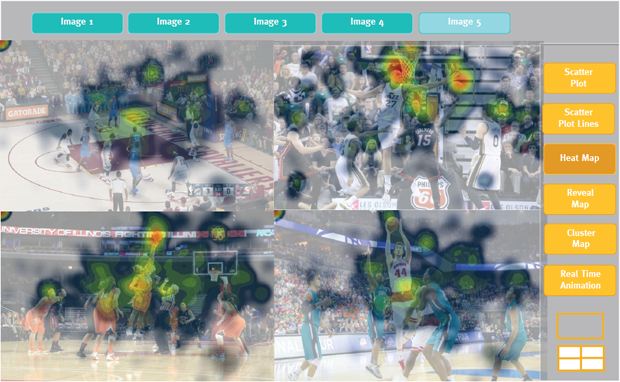
Heat Map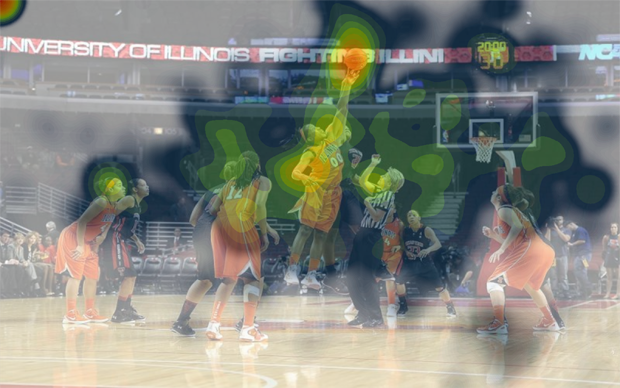
Reveal Map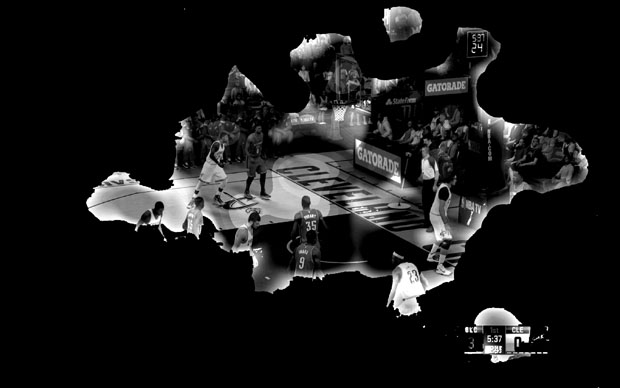
Next Steps
Next steps include finishing creating a usable interface that people can click through to compare images and the different mapping systems I created. I need to edit the reveal map, cluster map and real time animation as they are currently having issues. Other issues include the time length to show the heat maps.
Designs of Interface To be Created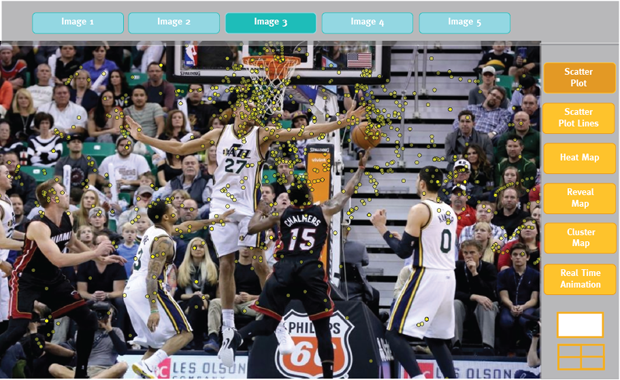
Questions:
-suggestions on best way to reveal information comparisons
– what other comparisons should be made?
– what else should be shown?