Proposed Project: Seeing Watermark
Thanks to Zachary Rappaport’s ongoing Water Walks project, I recently learned about the importance of watersheds to our own health and wellbeing and to that of the environment.
Think about a hill with water rolling down it on both sides. The water that rolls down one side of the hill is a watershed. The water that rolls down the other side is another watershed. A watershed is, technically, an area in which all the water (streams, pipes, ponds…) flows to the same place. It might collect there, like when water forms a pond at the bottom of Schenley Park, or it might move on and be a part of a larger watershed, like when the water from Squirrel Hill ultimately flows into the Allegheny.
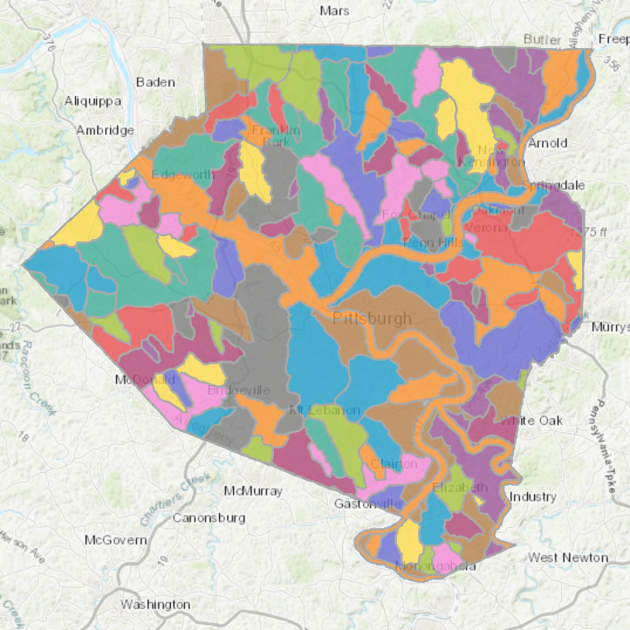
As you can see below, Allegheny County has many large watersheds.
Visualizing the flow of water through a community is a powerful tool to raise awareness of water issues, because this flow is mostly invisible to us, except when we cross a bridge or turn on our faucet, and even then, we don’t really see a holistic picture of where our water comes from and where it goes.
The stakes are also pretty high: Millvale, on the north side of the Allegheny, is at the bottom of its watershed, named Girty’s Run. Because there’s been a lot of development upstream from Millvale, including a lot of parking lots, water has had an easier time flowing down into the town. This has been disastrous for them, since the town frequently floods. Helping citizens understand how development causes harm to a watershed and the people living in it might change policy and plans around construction.
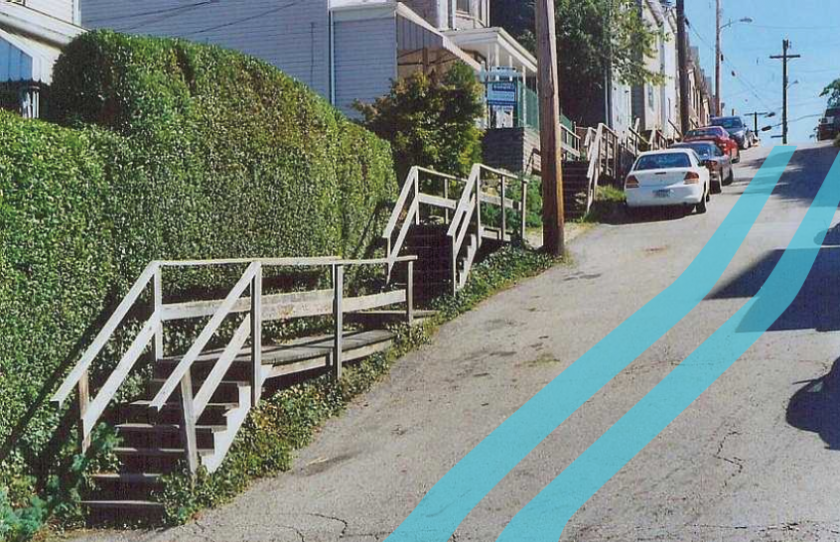
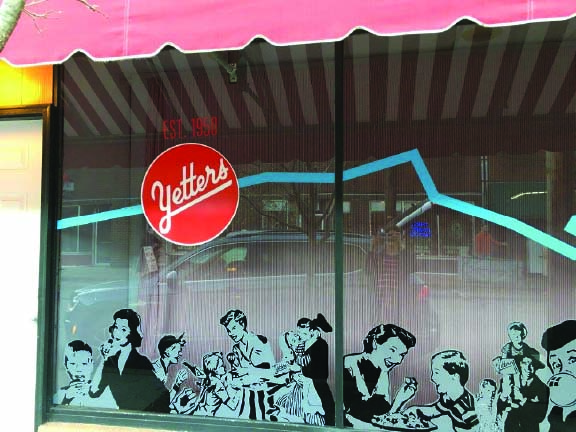
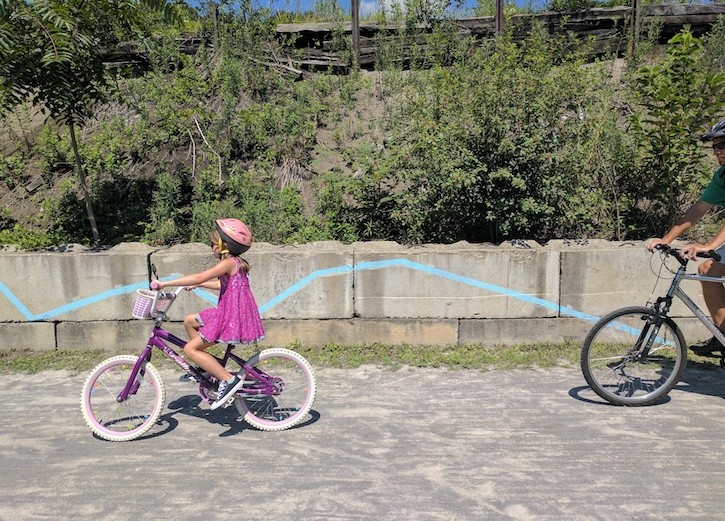
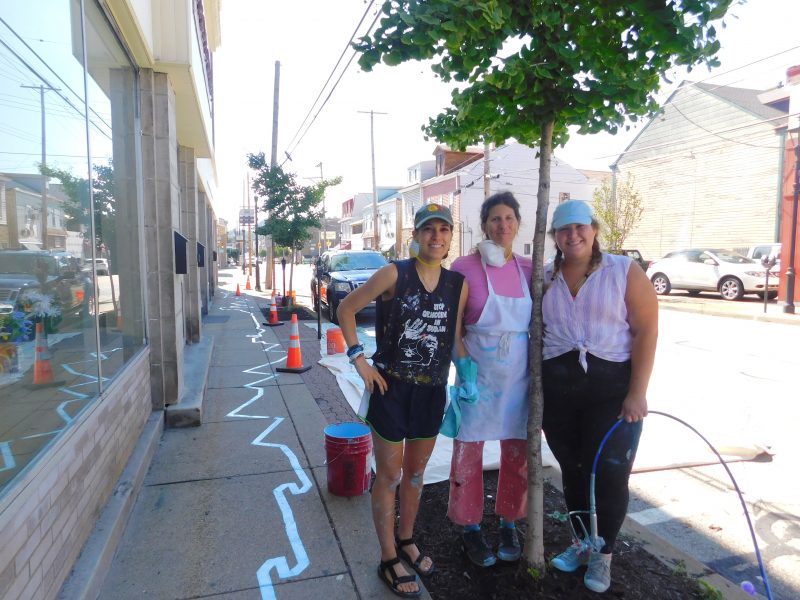
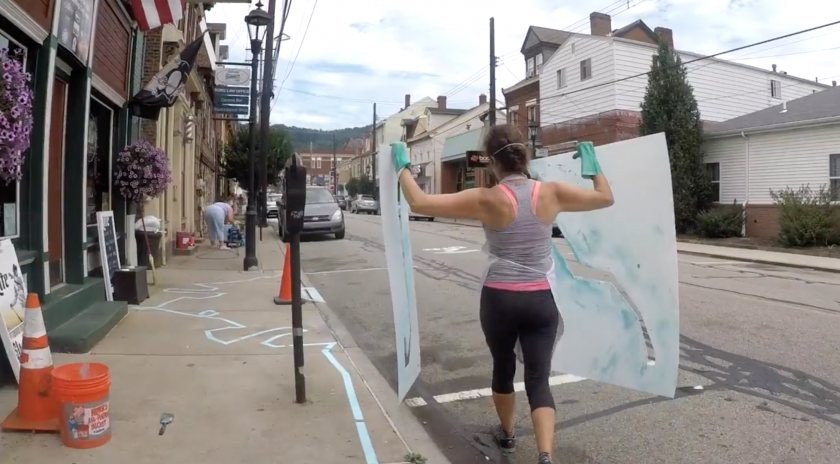
Ann Tarantino’s project, Watermark, in Millvale, was one such effort to visualize the flow of water. It’s an abstraction of Girty’s Run as a painted blue line that runs through the town center and down to the river.
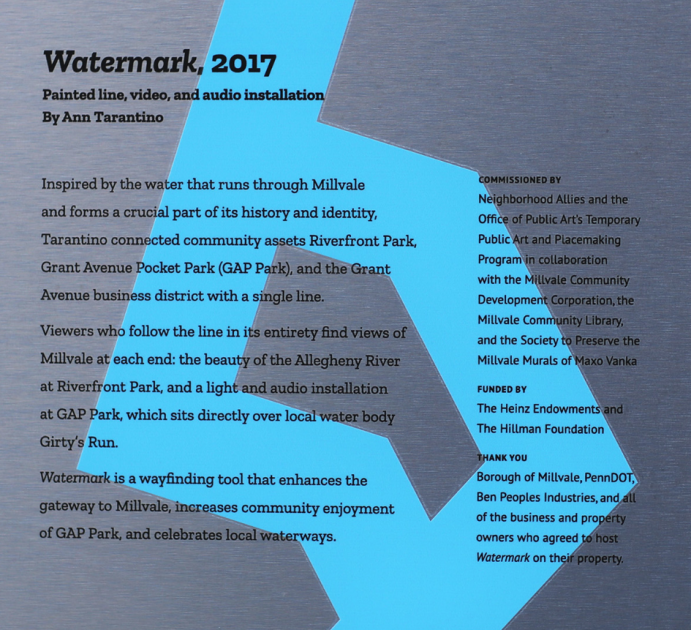
It runs through stores and streets alike, as a reminder of the powerful presence of Girty’s Run, even under the pavement.
Okay, my project:
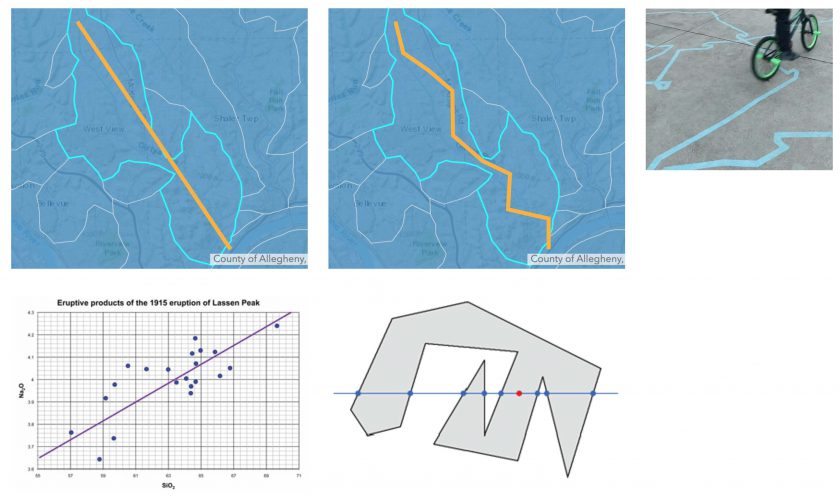
Watermark was removed last year. I want to bring it back in AR. And to expand on the idea of showing who’s downstream of who, I want to develop a feature that lets you pick two or more points on a map of Pittsburgh and draws a line flowing down your respective watersheds and shows where your flows of water meet:
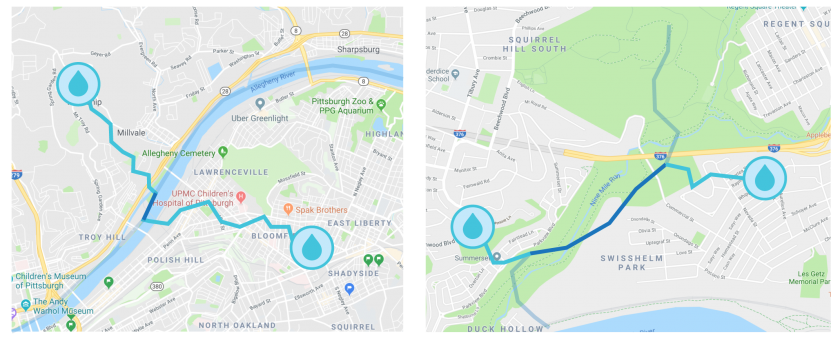
This begins to let you visualize how the runoff from your house, for example, affects a point along Nine-Mile-Run.
Just like Tarantino’s work, my lines will only be abstractions of the literal flow of water. Here’s my plan in this picture: On the far right you can see how Tarantino’s blue line is very expressive, designed to playfully attract attention. I want to imitate that when I calculate a flow line for each watershed in Allegheny County, beginning with a line of best fit, and adding some randomness, while keeping the line within the GPS-defined boundaries of the watershed:
Some technical problems foreseen:
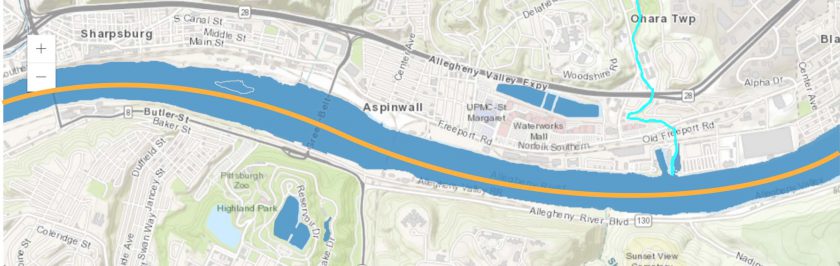
To calculate the flow of water along the major rivers, I won’t use GPS data, I’ll just create a series of points by hand.
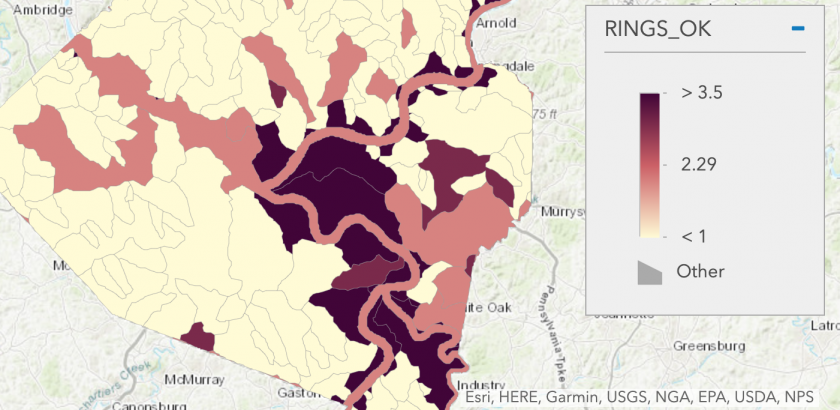
Also, the watershed API lists watersheds with multiple sections. Here’s a heat map of the watersheds with the most sections:
The Allegheny River basin, in this dataset, has something like 13 sections:
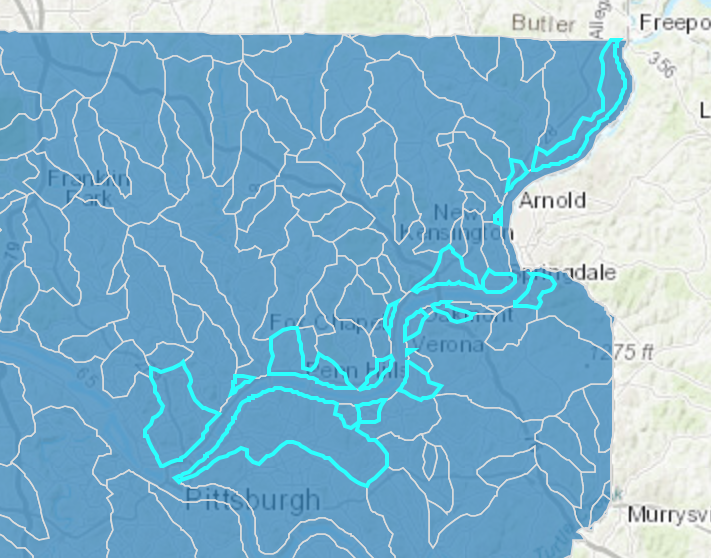
I think I can break these up and treat them each like their own distinct area and calculate a line of best fit for each of them.
Technical Update:
I’ve begun building this project in Unity, using the powerful Mapbox SDK.