Daily Archives: 30 Jan 2013

Erica

30 Jan 2013

self-organizing-map

Self Organizing Map

optical-flow

Optical Flow

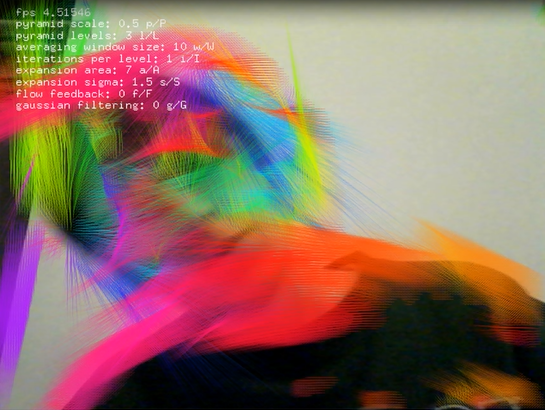
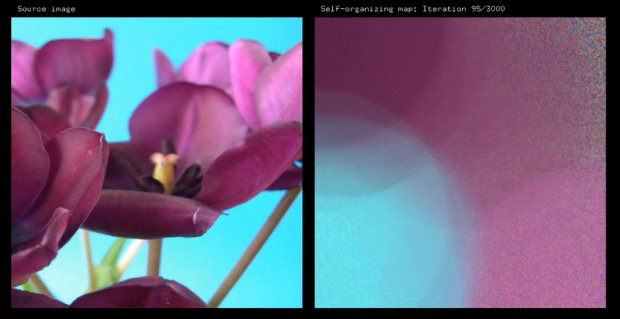
I chose to try to include optical flow and a self-organizing map in the same of application. I picked these two in particular because I thought it could be really engaging to interact with such a map using the optical flow grid implemented by Denis Perevalov that I posted about here. This would allow the user to highlight different aspects of the map to get a better idea of how the values are interacting and influencing each other. I think that combining these two addons in this way could be an interesting approach for our data visualization project, but for the purposes of the Upkit Intensive I only got as far as compiling the two addons in the same project. I did test out each of the addons’ examples and will post videos of both below for anyone who is interested in a visual explanation of what each one does. Although it is unnecessary for me to post the example code as it is already on github for both addons, I have posted the code for self-organizing map here and for optical flow here.

Self Organizing Map from Erica Lazrus on Vimeo.

Optical Flow from Erica Lazrus on Vimeo.

Erica

30 Jan 2013

textRainTo implement Text Rain in Processing, I created a few helper classes. First, I create a Character class that draws a character at its current x and y location and detects whether or not the character is free falling or if it landed on a dark spot. It does so by checking the brightness of the pixel directly below it and setting a boolean within the class. I also created a camera class so that I could test the application out with different types of cameras, namely black -and-white and grayscale. I had some issues with thresholding background brightness so I tried mapping each pixel’s brightness to an exponential function to create a bigger differentiation between light and dark values but I still find that I need to adjust the threshold based on the location in which I am running the project.

Text Rain from Erica Lazrus on Vimeo.

Below is my code which can also be downloaded here:

Main text rain class:

import processing.video.*;

Capture camera;
CameraBlackWhite bwCamera; 
CameraGrayscale gsCamera;

color bgColor;

String text;
Character[] characterSet1;
Character[] characterSet2;
Character[] characterSet3;

public void setup() {
  size(640, 480, P2D);
  smooth();

  int threshold = 50;

  gsCamera = new CameraGrayscale(this, threshold);
  gsCamera.startVideo();

  bgColor = color(#ffffff);

  text = "We are synonyms for limbs' loosening of syntax, and yet turn to nothing: It's just talk.";
  characterSet1 = new Character[text.length()];
  characterSet2 = new Character[text.length()];
  characterSet3 = new Character[text.length()];
  for (int i=0; i < text.length(); i++) {
    char c = text.charAt(i);
    color col = color(random(255), random(255), random(255));
    float speed = random(1, 6);
    characterSet1[i] = new Character(c, col, 14, 5 + i*7.25, speed, threshold);
    characterSet2[i] = new Character(c, col, 14, 5 + i*7.25, speed, threshold);
    characterSet3[i] = new Character(c, col, 14, 5 + i*7.25, speed, threshold);

    characterSet1[i].start();
  }
}

public void draw() {
  background(bgColor);
  update();
  render();
}

public void update() {
  gsCamera.update();

  for (int i=0; i < text.length(); i++) {
    characterSet1[i].update();

    if (characterSet1[i].getCurYPos() > height/2) {
      characterSet2[i].start();
    }
    else if (characterSet2[i].getCurYPos() - textAscent() >= height || characterSet2[i].getCurYPos() < 0) {
      characterSet2[i].setCurYPos(0-(textAscent() + textDescent()));
      characterSet2[i].stop();
    }

    characterSet2[i].update();
  }
}

public void render() {
  for (int i=0; i < text.length(); i++) {
    characterSet1[i].render();
    characterSet2[i].render();
    characterSet3[i].render();
  }
}

Abstract camera class:

public abstract class Camera {
  private Capture video;
  private int numPixels;
  
  private int threshold;
  
  public void startVideo() {
    getVideo().start();
  }
  
  public abstract void update();
  
  public abstract void render();
  
  public Capture getVideo() {
    return this.video;
  }
  
  public void setVideo(Capture video) {
    this.video = video;
  }
  
  public int getNumPixels() {
    return this.numPixels;
  }
  
  public void setNumPixels(int numPixels) {
    this.numPixels = numPixels;
  }
  
  public int getThreshold() {
    return this.threshold;
  }
  
  public void setThreshold(int threshold) {
    this.threshold = threshold;
  }
}

Black and white camera class:

public class CameraBlackWhite extends Camera {
  private color BLACK = color(#000000);
  private color WHITE = color(#ffffff);

  public CameraBlackWhite(Text_Rain_2_0 applet, int threshold) {
    setVideo(new Capture(applet, width, height));
    setNumPixels(getVideo().width * getVideo().height);

    setThreshold(threshold);
  }

  public void update() {
    if (getVideo().available()) {
      getVideo().read();
      getVideo().loadPixels();

      loadPixels();

      float pixelBrightness;
      for (int i=0; i < getNumPixels(); i++) {
        int pixelX = i % width;
        int pixelY = i / width;

        pixelBrightness = brightness(getVideo().pixels[i]);
        pixelBrightness = pow(pixelBrightness, 3);
        pixelBrightness = map(pixelBrightness, 0, 16581375, 0, 255);

        if (pixelBrightness > getThreshold()) {
          pixels[(width-1-pixelX) + pixelY*getVideo().width] = WHITE;
        }
        else {
          pixels[(width-1-pixelX) + pixelY*getVideo().width] = BLACK;
        }
      }

      updatePixels();
    }
  }

  public void render() {
  }
}

Grayscale camera class:

public class CameraGrayscale extends Camera {
  private color BLACK = color(#000000);
  private color WHITE = color(#ffffff);

  public CameraGrayscale(Text_Rain_2_0 applet, int threshold) {
    setVideo(new Capture(applet, width, height));
    setNumPixels(getVideo().width * getVideo().height);

    setThreshold(threshold);
  }

  public void update() {
    if (getVideo().available()) {
      getVideo().read();
      getVideo().loadPixels();

      loadPixels();

      float pixelBrightness;
      for (int i=0; i < getNumPixels(); i++) {
        int pixelX = i % width;
        int pixelY = i / width;

        pixelBrightness = brightness(getVideo().pixels[i]);
        pixelBrightness = pow(pixelBrightness, 3);
        pixelBrightness = map(pixelBrightness, 0, 16581375, 0, 255);

        if (pixelBrightness > getThreshold()) {
          pixels[(width-1-pixelX) + pixelY*getVideo().width] = WHITE;
        }
        else {
          pixels[(width-1-pixelX) + pixelY*getVideo().width] = color(pixelBrightness);
        }
      }

      updatePixels();
    }
  }

  public void render() {
  }
}

Character class:

public class Character {
  private char c;
  private color col;
  private int sz;

  private float xPos;
  private float curYPos;
  private float ySpeed;

  private int threshold;
  private boolean falling;

  public Character(char c, color col, int sz, int threshold) {
    setC(c);
    setCol(col);
    setSz(sz);

    setXPos(0);
    setCurYPos(0-(textAscent() + textDescent()));
    setYSpeed(0);

    setThreshold(threshold);
    setFalling(false);
  }
  
  public void start() {
    setFalling(true);
  }
  
  public void stop() {
    setFalling(false);
  }

  public Character(char c, color col, int sz, float xPos, float ySpeed, int threshold) {
    setC(c);
    setCol(col);
    setSz(sz);

    setXPos(xPos);
    setCurYPos(textAscent() + textDescent());
    setYSpeed(ySpeed);

    setThreshold(threshold);
    setFalling(true);
  }

  public void update() {
    if (getCurYPos() < 0 || ceil(getCurYPos() + 1) >= height || isLocationBright((int)getXPos(), (int)getCurYPos() + 1)) {
      setFalling(true);
    }
    else {
      setFalling(false);
    }
    
    if (isFalling()) {
      textSize(getSz());

      float newYPos = getCurYPos() + getYSpeed();
      setCurYPos(newYPos);

      if ((newYPos - textAscent())> height) {
        setCurYPos(0-(textAscent() + textDescent()));
      }
    }
    else {
      setCurYPos(findFirstBrightSpot((int)getXPos(), (int)getCurYPos()));
    }
  }

  public void render() {
    fill(getCol());
    textSize(getSz());
    textAlign(CENTER, BOTTOM);
    text(getC(), getXPos(), getCurYPos());
  }
  
  public boolean isLocationBright(int x, int y) {
    int testValue = get(x, y);
    float testBrightness = brightness(testValue);
    return (testBrightness > getThreshold());
  }
  
  public int findFirstBrightSpot(int x, int y) {
    int yPos;
    for (yPos = y; yPos > 0; yPos--) {
      if (isLocationBright(x, yPos)) break;
    }
    return yPos;
  }

  public char getC() {
    return this.c;
  }

  public void setC(char c) {
    this.c = c;
  }

  public color getCol() {
    return this.col;
  }

  public void setCol(color col) {
    this.col = col;
  }

  public int getSz() {
    return this.sz;
  }

  public void setSz(int sz) {
    this.sz = sz;
  }

  public float getXPos() {
    return xPos;
  }

  public void setXPos(float xPos) {
    this.xPos = xPos;
  }

  public float getCurYPos() {
    return this.curYPos;
  }

  public void setCurYPos(float curYPos) {
    this.curYPos = curYPos;
  }

  public float getYSpeed() {
    return this.ySpeed;
  }

  public void setYSpeed(float ySpeed) {
    this.ySpeed = ySpeed;
  }

  public int getThreshold() {
    return this.threshold;
  }
  
  public void setThreshold(int threshold) {
    this.threshold = threshold;
  }

  public boolean isFalling() {
    return this.falling;
  }

  public void setFalling(boolean falling) {
    this.falling = falling;
  }
}
Erica

30 Jan 2013

For this project, I collaborated with Caroline Record and Andrew Bueno to make a sifteo alarm clock. For full details and a video demonstration, click here.

Andy

30 Jan 2013

It’s my generative music post!

1. Technique – Cellular Automata in Wolfram Tones (http://tones.wolfram.com/about/how.html). Wolfram Tones is a generative music application which uses simple rules to create complex structures. Based on Wolfram’s work “A New Kind of Science”, all the possible cellular automata are lined up in the program, and each time a score is generated the program picks one. That automata is then drawn in Mathematica, turned on its side, and then more Mathematica functions decide how to convert the drawing into notes. I played around with Wolfram Tones for a bit and I was very impressed! The computational power of simplicity is astounding.

2. Something cool – Sonar by Renaud Hallee.

Sonar from Renaud Hallee on Vimeo.

Sonar is a beautiful animation accompanied by a program which generated the score from the animation. I looked pretty hard to find a paper which could explain how such great music was generated from an animation like they claim, but alas I couldn’t find an explanation. The simplicity of the project again, and the timbre and selection of the tones really makes for a beautiful experience.

3. Another cool thing – Max/MSP Generative MIDI Patch by Fletcher Patch

This is a ridiculously unnecessarily complicated structure which generates MIDI from a MAX/MSP patch. I really like the orchestration of this piece in particular. No matter what was played by these instruments, it always sounded good and had a very nice and soothing yet intricate and complex texture to it. I think I want to make some generative music in my next project, and I don’t know whether Max, Pd, or even something else will be the platform of choice, but by looking at this patch I can definitely at least start with something that should sound good

Alan

30 Jan 2013

Aaron Koblin

I can’t say he is not the most creative guy for visualization art. This is a TED Talk for briefing his collection of works. It is important to notice the medium of art is transforming from novel to movie, and movie to interface. Below I will show two projects by him with different ideas.


Johnny Cash Project

Johnny Cash Project is a visual project for recollection of Johnny Cash and his spirit. It allows global collaboration to share fans’ vision of Johnny Cash by recreate frames of MV “Ain’t no Grave”. Below is how it works.


The Wilderness Downtown

Instead of the case of Johnny Cash Project in which people globally together complete a work, The Wilderness Downtown is a project where a small group of people generate video art for different users based on their places of birth using HTML5 experimentation. You may check the link.

Hans Rosling – GapMinder

Hans Rosling is a world-known Swedish educator and data visualization expert. Above is a TEDx Talk he made in Doha, where TEDxSummit happens. In the video, he is using the software Gapminder made by himself. The gapminder has an advantage to represent data in more dimensions than originally tools can do. It is later developed by Google into Google public Data Explorer, which I used in my degree thesis.

Bueno

30 Jan 2013

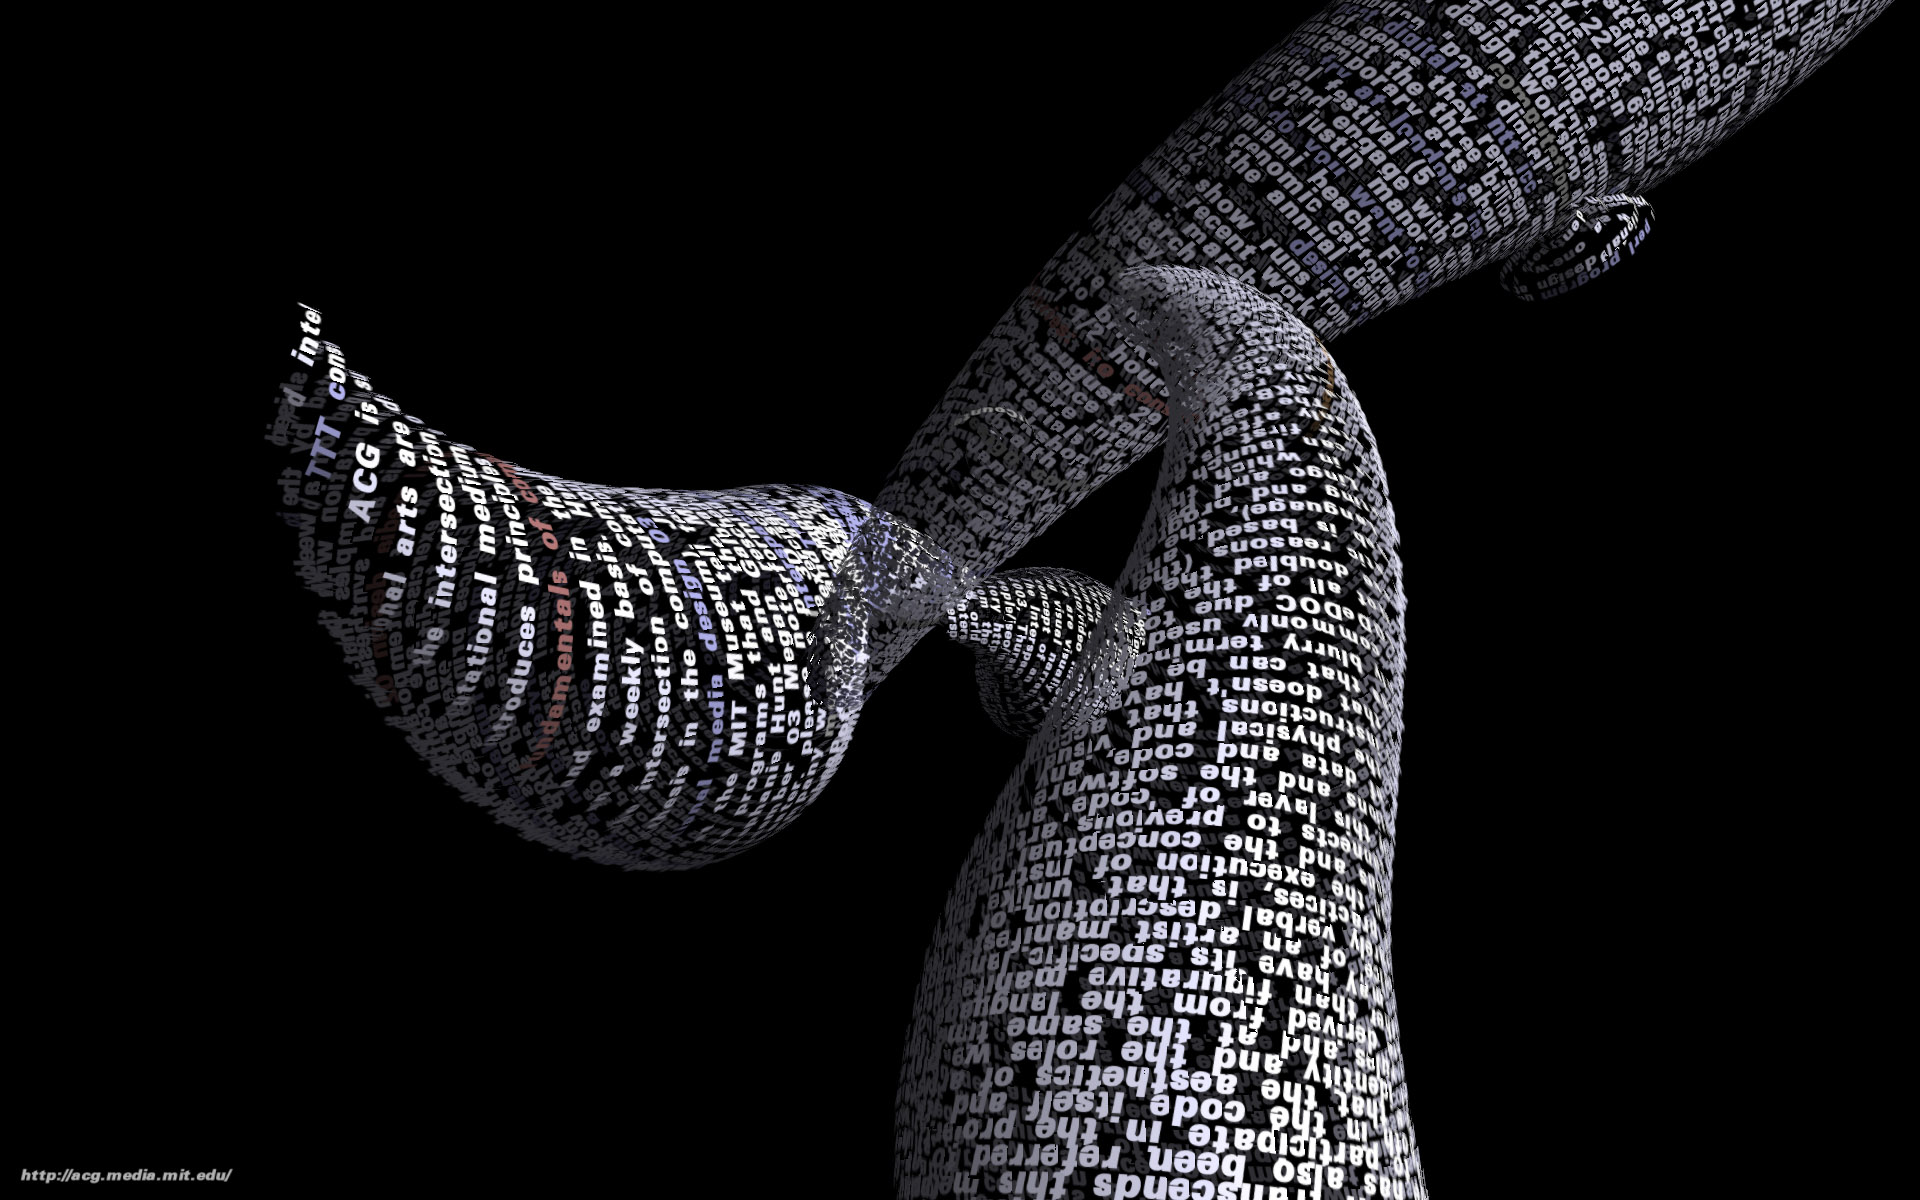
Okay, so I’ll start off this post with an ancient little something from Ben Fry himself, a web browser called tendril. It’s a wonderful little piece of software and a great reminder that our desire and overriding concern for functionality can prevent us from examining just what forms our tools can take. This web browser generates typographic structures from the words on web pages. These digital sculptures resemble, appropriately enough, tendrils or thick roots. Any links on the web page are colored differently and may be clicked, spawning a new tendril-page off of the old one. As an intersection between information visualization and generative form, I feel this is an important (relatively old) exploration of just what was possible.

http://benfry.com/tendril/movie.html


Next up I figured I would mention Entropy, the spawn created when esoteric programming languages meet the glitch aesthetic. For those unaware, esoteric programming languages seek to utterly subvert typical programming language conventions (and logic) while remaining Turing complete. You can certainly program in such languages, but they would be impossible to use on a regular basis.

Entropy fucks up your years of imperative programming use by forcing you to let go of the rigid assumption that your data is relatively stable barring some terrible mistake or accident. See, in Entropy, values change as they are accessed in small increments. The result is the eventual breakdown of a program’s output.This is fascinating, as it is generative whether or not the programmer wants it to be – he or she doesn’t even get to set any baseline parameters like in other conventional generative works.

See more here: http://esolangs.org/wiki/Entropy


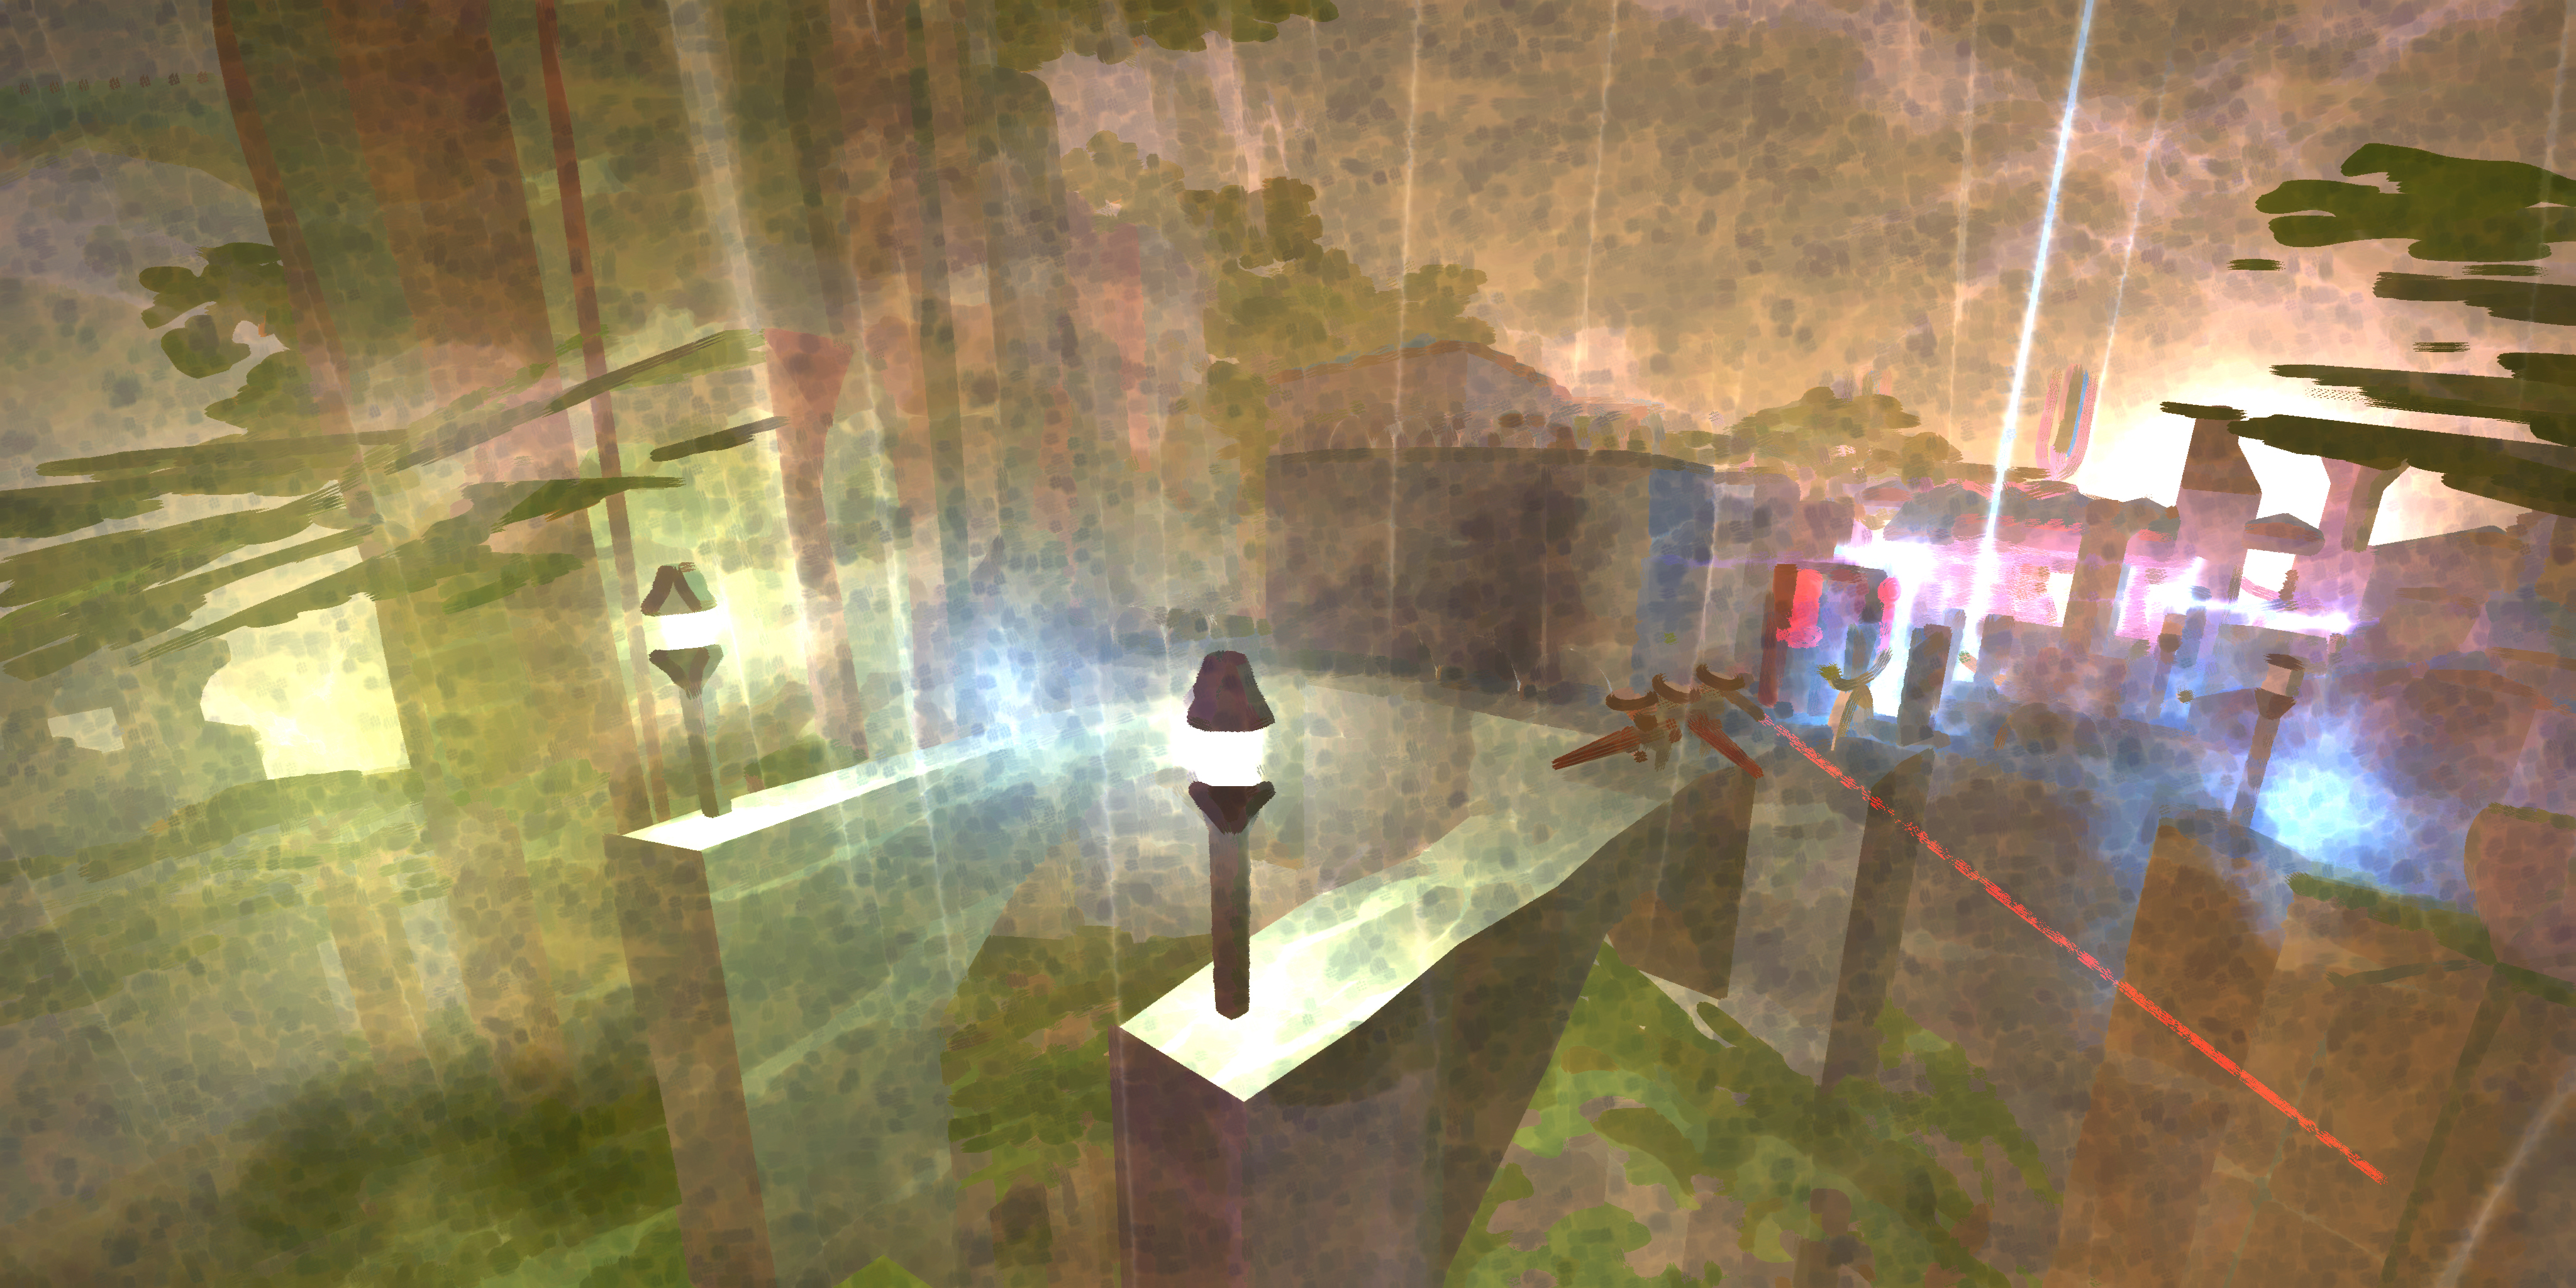
Probably the best way I could describe the game Love is to compare it to Minecraft, although that would be short-selling it greatly. Made by Eskil Steenberg, the game is for the most part entirely procedurally generated, down to the animations. It is an MMO where the gameplay is primarily cooperative – players seek to work together to defeat enemies and build settlements, and in addition there are AI groups to interact with as you see fit. It differs from Minecraft in aesthetic considerations, certainly. It’s freaking beautiful. Go play it.

http://www.quelsolaar.com/love/video.html

Elwin

30 Jan 2013

Stopping The Dead // by Richard Johnson and Andrew Barr


Interesting project: I only recently started watching The Walking Dead and I couldn’t help it but to finish watching all 3 seasons in just a couple of weeks because the show is just that awesome. Naturally, finding this infographic immediately caught my attention. The data visualized on the image is very very detailed. The artists captured all on screen zombie kills, linked them to the person who killed it and with which weapon, and even put them in chronological order in which they were killed in all 27 episodes!!!

How long will we live — and how well?

life
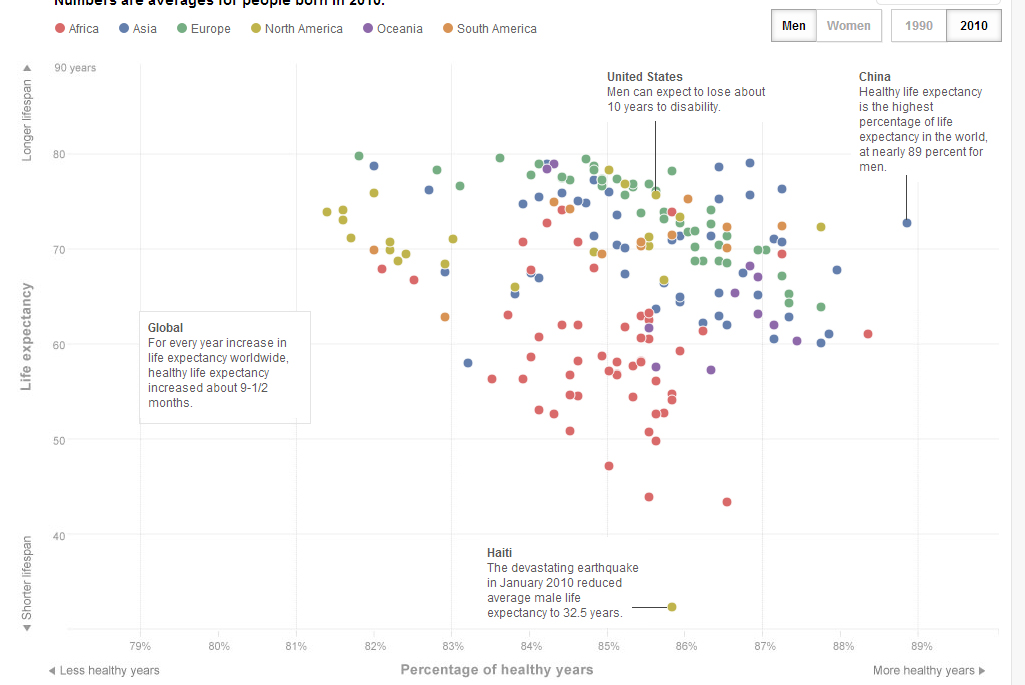
Provocative: I think this is a very interesting data set which will and has lead to discussion on the internet. Especially when the information is also visualizing “Healthy years” in addition to the Life Expectancy. Men in China have a lower life expectancy of 72.9 years compared to the 75.9 years for men in the US. But what’s interesting is that Chinese men has a higher number of healthy years (64.7) compared to their life expectancy, which results in a difference of 8.2 years. The US men live 65.0 healthy years, which means there’s a discrepancy of 10.9 years. While I’m not certain if this is true, this makes me wonder about the accuracy of the data and the reliability of the data providers. How well is everything documented by researchers, government, medical institutions? To my surprise, they even have results for North-Korea. Entire article link

OrgOrgChart // by Justin Matejka


Well-crafted: A Beautiful visualization with nodes, colors and organic change over time. The OrgOrgChart (Organic Organization Chart) project looks at the evolution of Autodesk’s organizational structure and a snapshot was taken each day between May 2007 and June 2011, a span of 1498 days as data. Each day the entire hierarchy of the company is constructed as a tree with each employee represented by a circle, and a line connecting each employee with his or her manager. Each second in the video is approximately 1 week of data. I wished they could have slowed the video down so analyze and watch the changes in data more carefully.

Dev

30 Jan 2013

Generative Art

Genetic Algorithm

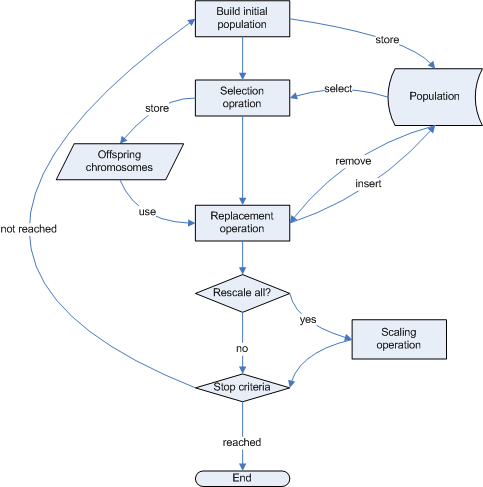
The concept of a genetic algorithm in my opinion is best summarized by “survival of the fittest”. The idea is that you have some heuristic for success for a given task. You spawn a bunch of mutations that try to accomplish the task. The mutations that suck are eliminated  The ones that don’t however, breed, and evolve. Doing this generation over generation can be automated through the computer and will “naturally” optimize the set over time.

Genetic algorithms are not only cool because of how elegantly they solve problems, they somewhat mimic they way nature solves them too. This makes them a very powerful concept.

Genetic AlgorithmFlow Chart

Electric Sheep

Electric sheep lets people leverage unused power of their computers when they are asleep to generate some amazing high-detail animations. These animations are voted on by anyone who is watching them. The top voted animations are bred as per the genetic algorithm process, and thus spawn more and more art that is visually appealing to humans.

I am a big fan of abstract art, and find it interesting that people can judge something so undefined and far from reality. The fact that people can and do do this in electric sheep makes the end goal appealing – an abstract art piece generated by computers that everyone will love. A renaissance in your computer!

BoxCar2d.com

Being an engineer, admittedly this example of generatively is really awesome. When cars are built they are built around a set of requirements. The car must move X mph or the car must have Y mpg. Meeting these requirements takes a long time with trial and error and testing.

BoxCar2d shows how genetic algorithms can be used to solve problems in the physical world. Over the course of time, different variations of cars will evolve over time to go the maximum distance over a rugged course. The simulation relies heavily on physics, and takes into account both structural integrity as as well as specialization in movement. Something I like is that users can also up-vote certain designs to personalize the process.

Sam

30 Jan 2013

OrgOrgChart (Justin Matejka)

OrgOrgChart visualizes the growth and restructing of an organization as a circular tree, charting the movements of employees into, out of, and through the company. I find particularly compelling the elastic motions of the tree as changes are made, which, combined with the cellular appearance of the graphic, really communicates the story of the organization as an organism, rather than the stiff bureaucracy traditionally associated with an organizational hierarchy chart. The project currently only maps data from AutoDesk, where it was developed, but it would be interesting to see an entire industry presented in this way, and watch the flow of personnel and the cycles of many different companies alongside each other. This project reminds me of a project I wrote about earlier, gource, which produces a similar tree-based animation of source control repositories, with a similarly-surprising organic feel.

On the Origin of Species: The Preservation of Favoured Traces (Ben Fry)

benfry_traces

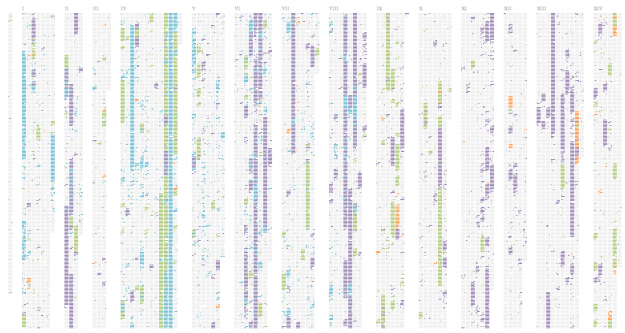
In Traces, Ben Fry presents the evolution of evolution, diagramming the editing made to Darwin’s The Origin of Species as it progressed from the first to sixth addition, over a span of 14 years. The degree of detail in the dataset is what blows me away for this project, considering that the records of Darwin’s drafts are from the late 19th century, and yet we are able to see small changes of even only a few words as they were worked into the text by Darwin. Interestingly, with the rise of Google Docs and version tracking in a variety of forms, we are almost at a point where a visualization like this could be easily generated for any work, even as it is being created.

STYN (Sam van Doorn)

svd_styn

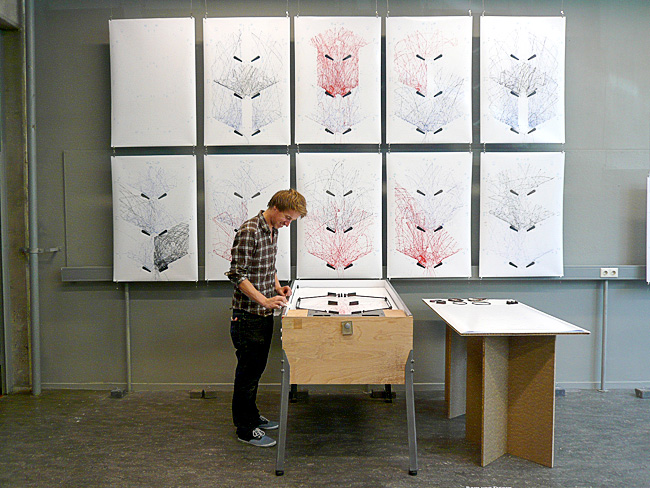
STYN traces the path of a pinball through the pinball machine surface simply by applying paint to the ball and letting the trail evolve. This project stands out from the others because it doesn’t rely on fancy computer transformations of the data; everything is generated simply by playing the pinball game. Because of this, anybody can walk up and be directly involved in creating the visualization, as opposed to the passive, after-the-fact involvement in other projects. One component that I feel is missing from the documentation of this project is video of the tracings actually being produced, somewhat like the iQ Font project shown during lecture. This would add another dimension to the visualization, showing its evolution through time.