Daily Archives: 13 Jan 2013

Caroline

13 Jan 2013

I am currently a junior double majoring in Art and Human Computer Interaction, so this class it right up my ally. My interests include: making the tactile visual, large quantities of malleable materials (such as corn starch, wax, ferrofluids etc.), and TED talks. In this semester I am interested in expanding my tool set, pushing my existing interactive software based projects forward, and doing at least 3 completely new things.

Website (just redesigned it. Yay!): http://www.carolinerecord.com/                                         GitHub: https://github.com/crecord                                                                                             Twitter: @recordcaroline

Stained Sheets: 

collab4

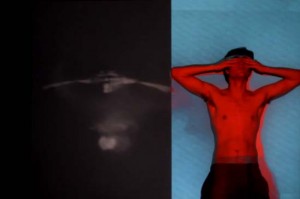
Heat has been an ongoing project that translates temperature into light and color. There have been three previous iterations of this projects: a series of 18 black and white video pieces exploring an intimate connection with landscape, a live interactive installation and a music video made in collaboration with cmu film club.

Currently I am working on Stained Sheets which uses the medium of heat to explore movement and the physical act of mark making. My collaborators include Geoffrey P. Morgan (Computer Science Ph.D candidate at CMU) and The Pillow Project (experimental dance company). Our funding is provided by the Carnegie Mellon School of Art Interdisciplinary Grant and equipment from Professor Yang Cai.


Present Project:


http://prezi.com/oguoxeilgdyd/copy-of-stained-sheets-lecture/?kw=view-oguoxeilgdyd&rc=ref-12152630

Erica

13 Jan 2013

Hi guys, I’m a senior pursuing a Bachelor’s of Computer Science and Art.  I’m most interested in working on art-related projects in the virtual spectrum, particularly games.  I don’t have so much formal training in human-computer interaction but I would love to gain more experience and knowledge in that arena.  In this class I hope to learn about a lot of new digital tools and am really excited to meet and work with new people who share some of my interests and bring totally new perspectives and ways of thinking to my attention.

Twitter: https://twitter.com/elazrus

GitHub: https://github.com/elazrus

snowglobeImageThe above screen shot is from a game I created last semester for Paolo’s Experimental Game Design class.  The game’s icon is a tiny snow globe and the game itself is meant to sit on your desktop the same way that a snow globe would sit on your shelf.  However, unlike a normal snow globe which only allows you to shake and observe, Snow Globe (the game) gives you the opportunity to affect what goes on inside the snow globe.  At the beginning of the game, you control a girl that lives in the initial empty landscape within the snow globe.  Given that it is a snow globe, this is a very cold environment for her to be living in, so you need to build her some shelter in order to keep her alive.  The snow globe has a small ecosystem which you must learn and navigate in order to do so, namely involving picking up object to plant and cut down trees, build a fire, and build a permanent shelter.  However, there is a small catch: you can only see and pick up these objects when the snow has not settled over top of them.  Therefore, you must constantly shake the snow globe by closing and re-opening the game to continue the game.  The game will end in one of two ways, and once it does, you will no longer be able to play, you can simply observe (unless you restart the game).

I’m pretty happy with the way the game turned out; I think I succeeded in created a coherent world both in terms of the graphics and the ecosystem.  If I were to go back and improve upon it, I would focus mostly on timing and pacing; I was working on the game up to the last minute so I made decisions about these things based on guesses and didn’t have so much time to test them out.  I also might rework the tutorial somewhat, it’s a bit wordy.

If you’re interested in playing the game you can download it here: http://www.andrew.cmu.edu/user/elazrus/Games/SnowGlobe2/.  I’m using this site temporarily store some of my work online while I am working on my website so I made update this link in the near future.

You can also see a video working through the tutorial portion of the game here:

Snow Globe from Erica Lazrus on Vimeo.

John

13 Jan 2013


GO HERE


Here’s my little profile:

I’m a 2nd year IxD  masters student. Before coming back to school I designed websites, built props and taught. I’m interested in making things that make noise [possibly instruments, possibly not], things that make people work together, and things that look very very nice. I’ve got a lot of experience in HTML/CSS, JS, Processing and Max/MSP, and Adobe CS. I’m generally much more comfortable with software than with hardware and I’d like to change that.

Twitter:johnmgruen

GitHub: johngruen

Here’s my little project description:

Dr. Dummy is multi-user, web-based drum machine designed to allow many people to create music collaboratively. Dr. Dummy is built using node.js, socket.io and the audiolet audio library. The basic idea is simple. Users go to the site, select an instrument and are then given a single track of sixteen switches representing drum beats. Users can toggle beats off and on and as multiple users do this, complex rhythms are created by the drum machine.

This was a really fun project and it pushed my abilities with Javascript quite a lot. I was really impressed [and pleasantly surprised] at how fast node and websockets function even across remote networks/hosts.

This project is still a work in progress. I’m currently adding voices which can be controlled through accelerometer events on smartphone clients. Unfortunately, the project doesn’t exist on the web right now though it’s easy to run it on your local network. You can download the entire thing here. You’ll need to install node.js (from the link above) and review the readme.txt file which explains how to launch and use the project. It sounds much better if your machine is hooked up to real speakers. Don’t forget to dance!

I’m really looking forward to the semester. See you soon!

Anna

13 Jan 2013

Hey! I’m Anna: a second year master’s student in the school of design. I’d say I’m about 2 parts bio-engineer, 3 parts visual designer, and 5 parts creative writer. You will [quickly, I imagine] find that I am enthusiastic about medical technology, healthcare, typography, colors, novels, characters, metaphors, words, and words.

I know a thing or two about code from my time moonlighting as an engineer, but for the most part I’ve kept programming tied to left-brain projects like bio-transport models, and made art the old school way—physical objects, pen on paper, and crayons on walls.

I’m excited about this class because I’m hoping to break down some of those barriers.

Website: avreden.com (in the process of being updated!)
Twitter: @AvReden
GitHub: aredenigma

A Dozen Reams of Nonsense : an XML data visualization
In case you didn’t believe me when I claimed to be enthusiastic about words, here’s a [very] modest flash project I made for a prototyping course last year.

nonsense

‘A Dozen Reams of Nonsense’ pulls in XML data about all of the creative writing text files I have on my computer, dynamically draws triangles, fills them to a percentage that corresponds to a value judgment about the words inside the file—obviously, I was the one who made the judgments, not the program, although that would be pretty nifty.

As you can read if you visit the live version [ http://avreden.com/wordcount.html ], my goal in visualizing all the words I’ve written was to quantify exactly how much useless stuff writers produce before they ever come up with something they like. So many people become frustrated when they sit down in front of a blank page because they have a ‘one shot at glory,’ do-or-die mentality. It would be fascinating to see what the percentages would look like for various famous authors in today’s society, and through history. I expect it would feel cathartic to everyone.

If I were ever to return to this project, I have a laundry list of things that I’d like to improve. For one, I’d love for the code to be more dynamic and rely less upon a static XML file—i.e. to continually add new triangles every time I start a new word file, to count the words itself, and to keep track of how many words I delete and never bother saving. I also wish that the fill animation on the triangles would stop at the correct percentage when you hover over them. And, lastly, it would be neat to introduce more interactivity into the visualization; maybe I could let the audience look at the actual documents and provide their own value judgments…

… that sounds a bit scary though.

Michael

13 Jan 2013

Hi All,

My name is Mike Taylor.  I’m a PhD student in the Robotics Institute under Professor Illah Nourbakhsh.   I’m a bit slow at typing and many other things because I shattered my dominant right arm at the beginning of 2013, and as of now I’m effectively one-handed.  I don’t expect to regain full use before 2014.  Please bear with me; It’s going to be a bit of a rough semester as I relearn to do everything with my left hand.  On the plus side, my right elbow is now mostly stainless steel plates and lag bolts, and I think that’s a little cool.

My bones

I’m interested in creating new ways to extract and convey meaning from large amounts of non-homogeneous data.  In my free time, I like to make shiny things and unicycle (though neither of those things are what took my arm).  Through this course, I’m hoping to develop my skills across a wider range of software while exploring new ways to effectively communicate complex ideas through diverse media.


In the Fall of 2011, I stayed at a rural hospital in Haiti to asses the post-earthquake rubble moving problem.  I found that the lack of energy infrastructure is not only a hindrance to removing rubble, but is a much deeper and difficult problem to approach.  I established a goal of creating tools to provide quantitative information regarding electricity usage and generation to hospitals, schools, etc. while also providing a qualitative understanding of energy to the population (especially children).

Energy Monitor

This device is a prototype energy monitor built using readily available hardware and open-source software that monitors power usage through three different electrical circuits and measures voltage across one 48v battery bank.  I installed this at the hospital in June of 2012, and to my knowledge it has functioned without interruption.

Energy Monitor Guts

I used an Arduino to convert the pulses from the power monitor to usable values.  These are logged to a microSD card every second.  The device exports this data in several ways for redundancy.  By serial link, the data can be viewed live on-site through a small netbook computer.  The netbook can be accessed remotely by a 3G USB modem.  Because the 3G network is less than a year old in Haiti and prone to failure, the Arduino also communicates via SMS through a gsm modem and SIM card.  Twice daily, the device sends a text with hourly power usage to a google voice number which archives the data.  Any user at the hospital can also send a text to the device in order to receive an instantaneous power usage update, giving nurses, patients, teachers and students access to the information at any hour.

One feature I am rather proud of is the way in  which the device synchronizes the time and date without a real-time clock.  Whenever the device receives a text, it scrapes the time and date.  If it is within a certain tolerance of the last known date and time, the device updates its clock.

Energy Monitor Installed

I hope to return this summer, arm permitting, to improve the user interface and to scale out to more locations.  While the hardware integration went remarkably well for having to design and test remotely, the interface fails at being an effective educational tool insomuch as it is primarily textual. I believe I can use my experience in this class to significantly improve the long-term educational benefits of this project.

My Twitter

My Github

Thanks for reading, and I look forward to meeting you all!

Meng

13 Jan 2013

This is Meng Shi! I am a tangible interaction design master student. Prior to CMU, I majored in industrial design. I used to design user interface, design and prototype product, make gadgets, and build a formula car in team.

Now I want in exploring different interactions.  I take this course because I want to use digital media to express my thoughts and emotion, and to work with cool kids like you : )

This is my story: Rabbitman and Humanbot.

We made humanoids. We make robots according to human feature, because we want more natural communication experience with robots. Usually ,we make commands, while robots listen. But this is not communication. It is a one way communication about passive control.

I wonder if there is a more emotional way to communicate with man-made creatures. So I make an interaction prototype which is about adding a roboccessory to human. When you approach the rabbitman, s/he will be shy while your ears will spin. It was built with sensors and Arduino.

Website: http://immengs.com/
Github: https://github.com/mengs
Twitter: https://twitter.com/MengsMeng

Elwin

13 Jan 2013

My name is Elwin Lee, from the Netherlands, and I’m currently a 2nd year master student at the Entertainment Technology department. I have a background in Industrial Design and I’m very interested in designing games and interactive products/systems.

Website: http://www.elwinlee.com/
Twitter: @BlueSpiritbox
Github: https://github.com/BlueSpiritbox

Space Invaders on 8×8 LED Matrix
Last year I took the class Gadgets, Sensors and Activity Recognition at the HCI department given by Scott Hudson. The first project was to design an game for an 8×8 LED Matrix display using an Arduino. I thought it would be interesting to create a mini-sized Space Invaders game for the LED display. To build the game, I used an Arduino Nano, a potentiometer for moving left and right, a button to fire missiles, and a piezo speaker for some very basic sound effects.

The game consists of 3 levels, each level increasing in difficulty (static enemies; moving enemies; boss fight). There’s a win and lose state condition, missile firing mechanism with collision detection, and the enemies move in a pre-determined pattern and will fire at you randomly.

Hullo

My name is Josh Lopez-Binder. I am studying mechanical engineering and art.  I am interested in kinetic art, sculpture, the immense power of computational methods, bloopy things, and biology.  I hope to learn more about programming and its applications, and I want to simulate the growth of coral and other colonial organisms.

twitter account:      https://twitter.com/jlopezbi

github account:     https://github.com/jlopezbi

frameLinkage-1156

Over break I got curious about four bar linkages (simple mechanical linkage for producing various motions).  I made a simple simulation in processing so that I could fiddle with the ratios of the linkage and see what kind of paths would result.  Kinda like a spirograph.  So far I have just played with different configuration of points that trace paths.  Next I am going to overlay a bunch of slightly different linkages with the same point tracing a path (relative to each linkage).

http://www.openprocessing.org/sketch/85327

Kyna

13 Jan 2013

I’m Kyna, a junior in BCSA. I’m really interested in game design/interactive software, and taxidermy. I don’t know how those two things work together yet, and I don’t really have much experience in either. Hopefully this class will allow me to explore one of these in more depth, or even find a way to cohesively combine them.

Twitter: https://twitter.com/KynaPM

Github: https://github.com/kyna

Last semester, I worked on a project called Drink Bot.

tweets-page

go

https://twitter.com/SonofaDrinkBot

http://www.flickr.com/photos/90787080@N06/sets/72157632174450103/

It’s a twitterbot, written in processing, that when executed searches for tweets containing the phrase ‘i need a drink,’ compiles a random drink from a database of ingredients, creates an image of it and tweets the image at the user who made the post.

It’s currently in its second incarnation, because retweeting images very quickly tends to result in immediate banning. It’s currently dormant for reference purposes, but I can run the program to start it up again whenever I choose.

Keqin

13 Jan 2013

My name is Keqin Dou. I’m from China. I’m the first year MTID student. My undergraduate background is computer science. I want to make cool things to help people’s life or influence people. It’s a long road for me to learn and make.

Here are my Twitter and Github links.

Github: https://github.com/doukooo
Twitter: @doukoooo


STORY-CUBE

This is my first tangible user interface research project. It’s a tangible storytelling system for children. Story-Cube is a storytelling system which has good benefits for the improvement of children’s language, cognitive and social abilities. Many tangible storytelling systems have been developed in the past few years. We proposed a storytelling system that integrate tangbile user interface into the software.

This is the video http://www.youtube.com/watch?v=hGOSWbEKSsQ

WALL-F

Wall-f is a Facebook Robot. I used Facebook API to update status on your Robot page. People always express their emotion by things around. And different action usually represents different emotion. So when you’re very angry today and sit in the front of the computer. When you see your robot, you may hit it heavily. And then the Robot will update a status which is “Master is angry, I must careful about what I say.” After a period time, you will check the robot page and see your mood in this period of time. Then you can make some changes on it.

13-2