blue-Final

body, my body is both the title of my final project, and a song by the Pittsburgh-based dance/music duo, slowdanger, for which I’ve made the music video, in addition to a VR dance piece.

For much of the semester, I’ve been working with as many methods of motion capture as I could get access to. At Carnegie Mellon, I’m fortunate enough to have at my fingertips multiple motion capture research labs, as well as many other methods for capturing bodies in space and motion. I began to collaborate with slowdanger in March, as we are collectively interested in sensory perception, kinesthetic experience and understanding, and ways to imbue and express feelings of embodiment in visual, digital, and mixed reality experiences. This project has allowed me to further investigate my core research questions of human perception, representation, and communication within experiences with evolving technology – specifically focused on the notion of embodiment, as experienced by a performer and translated to (sensed by, interacted with, responded to by) a user/audience/witness.

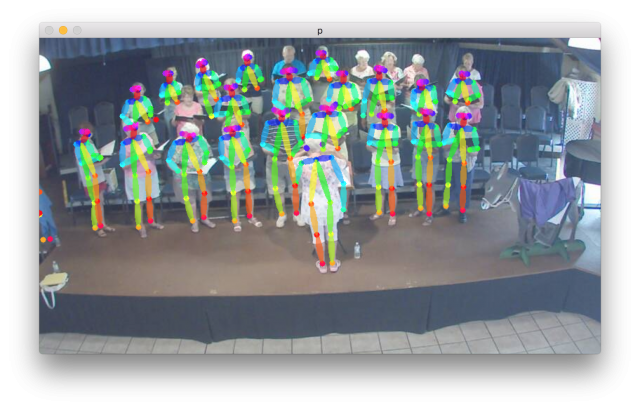
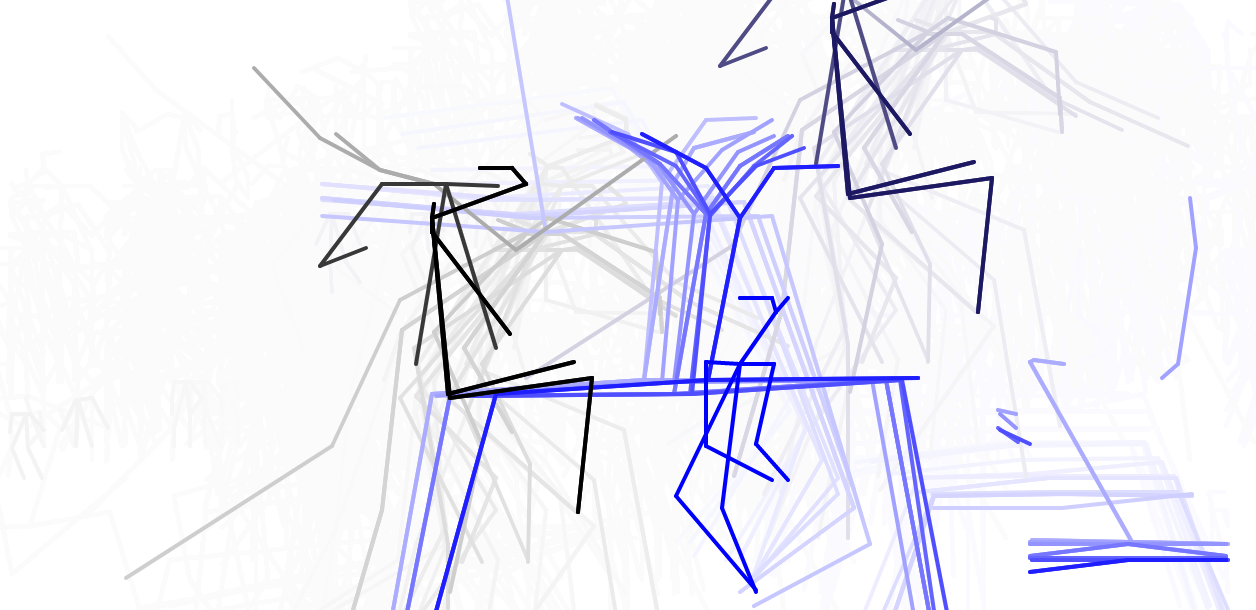
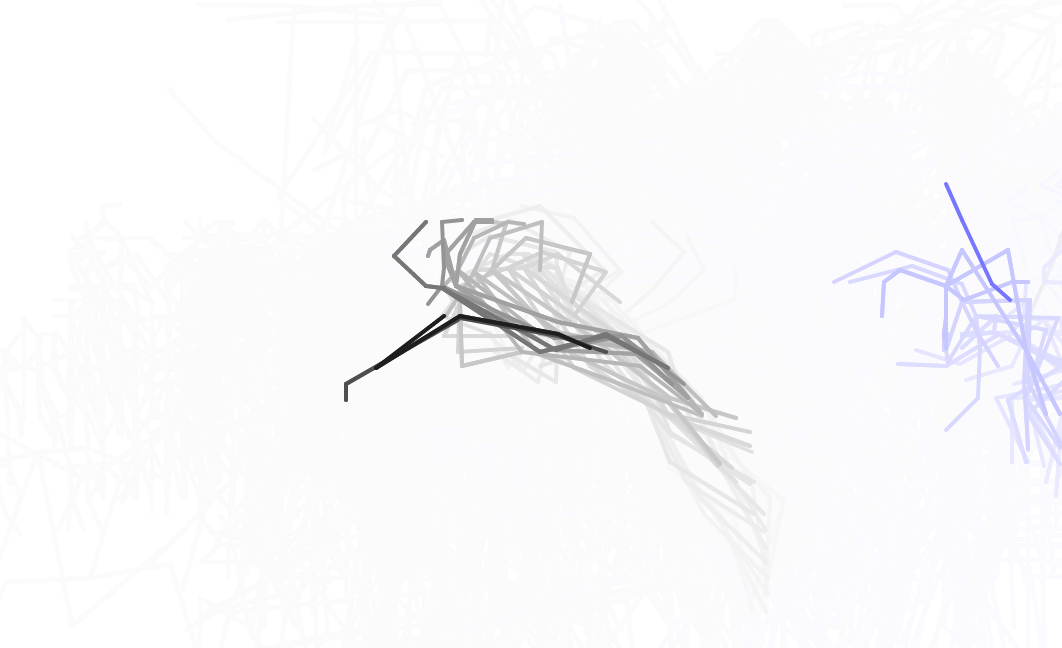
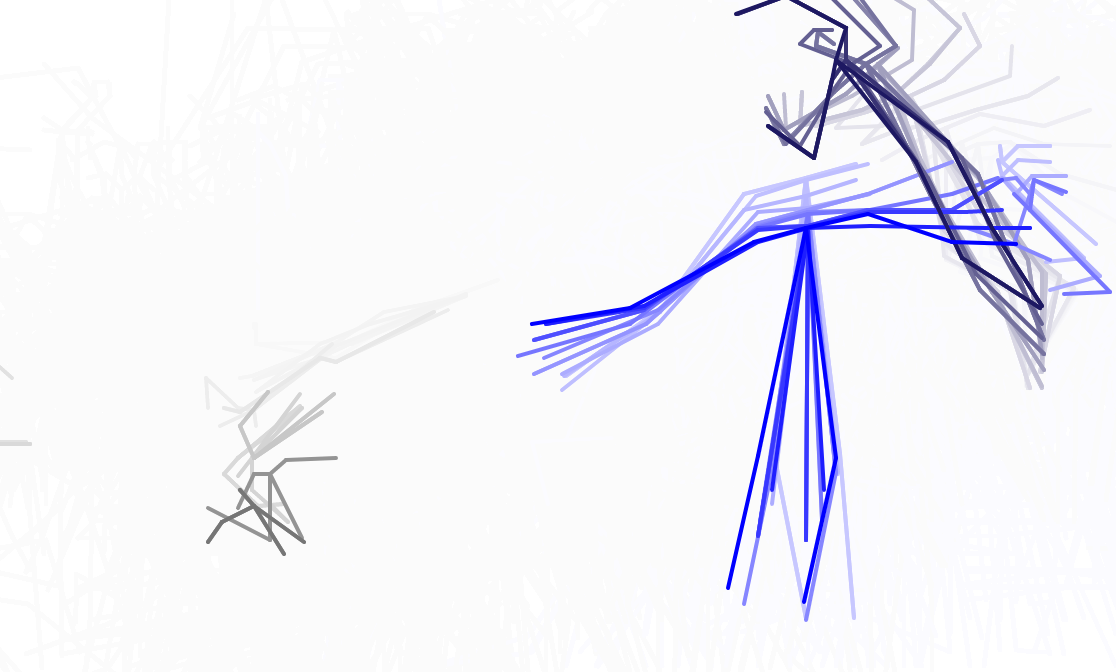
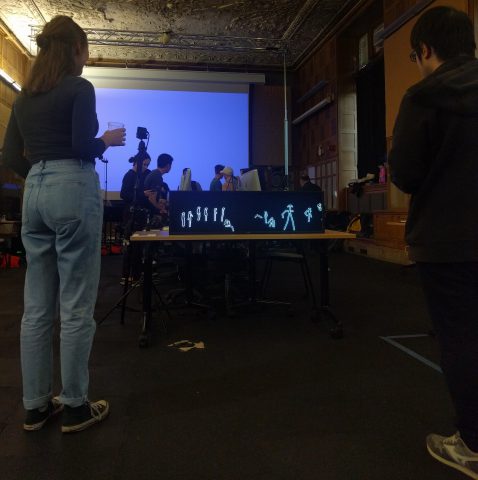
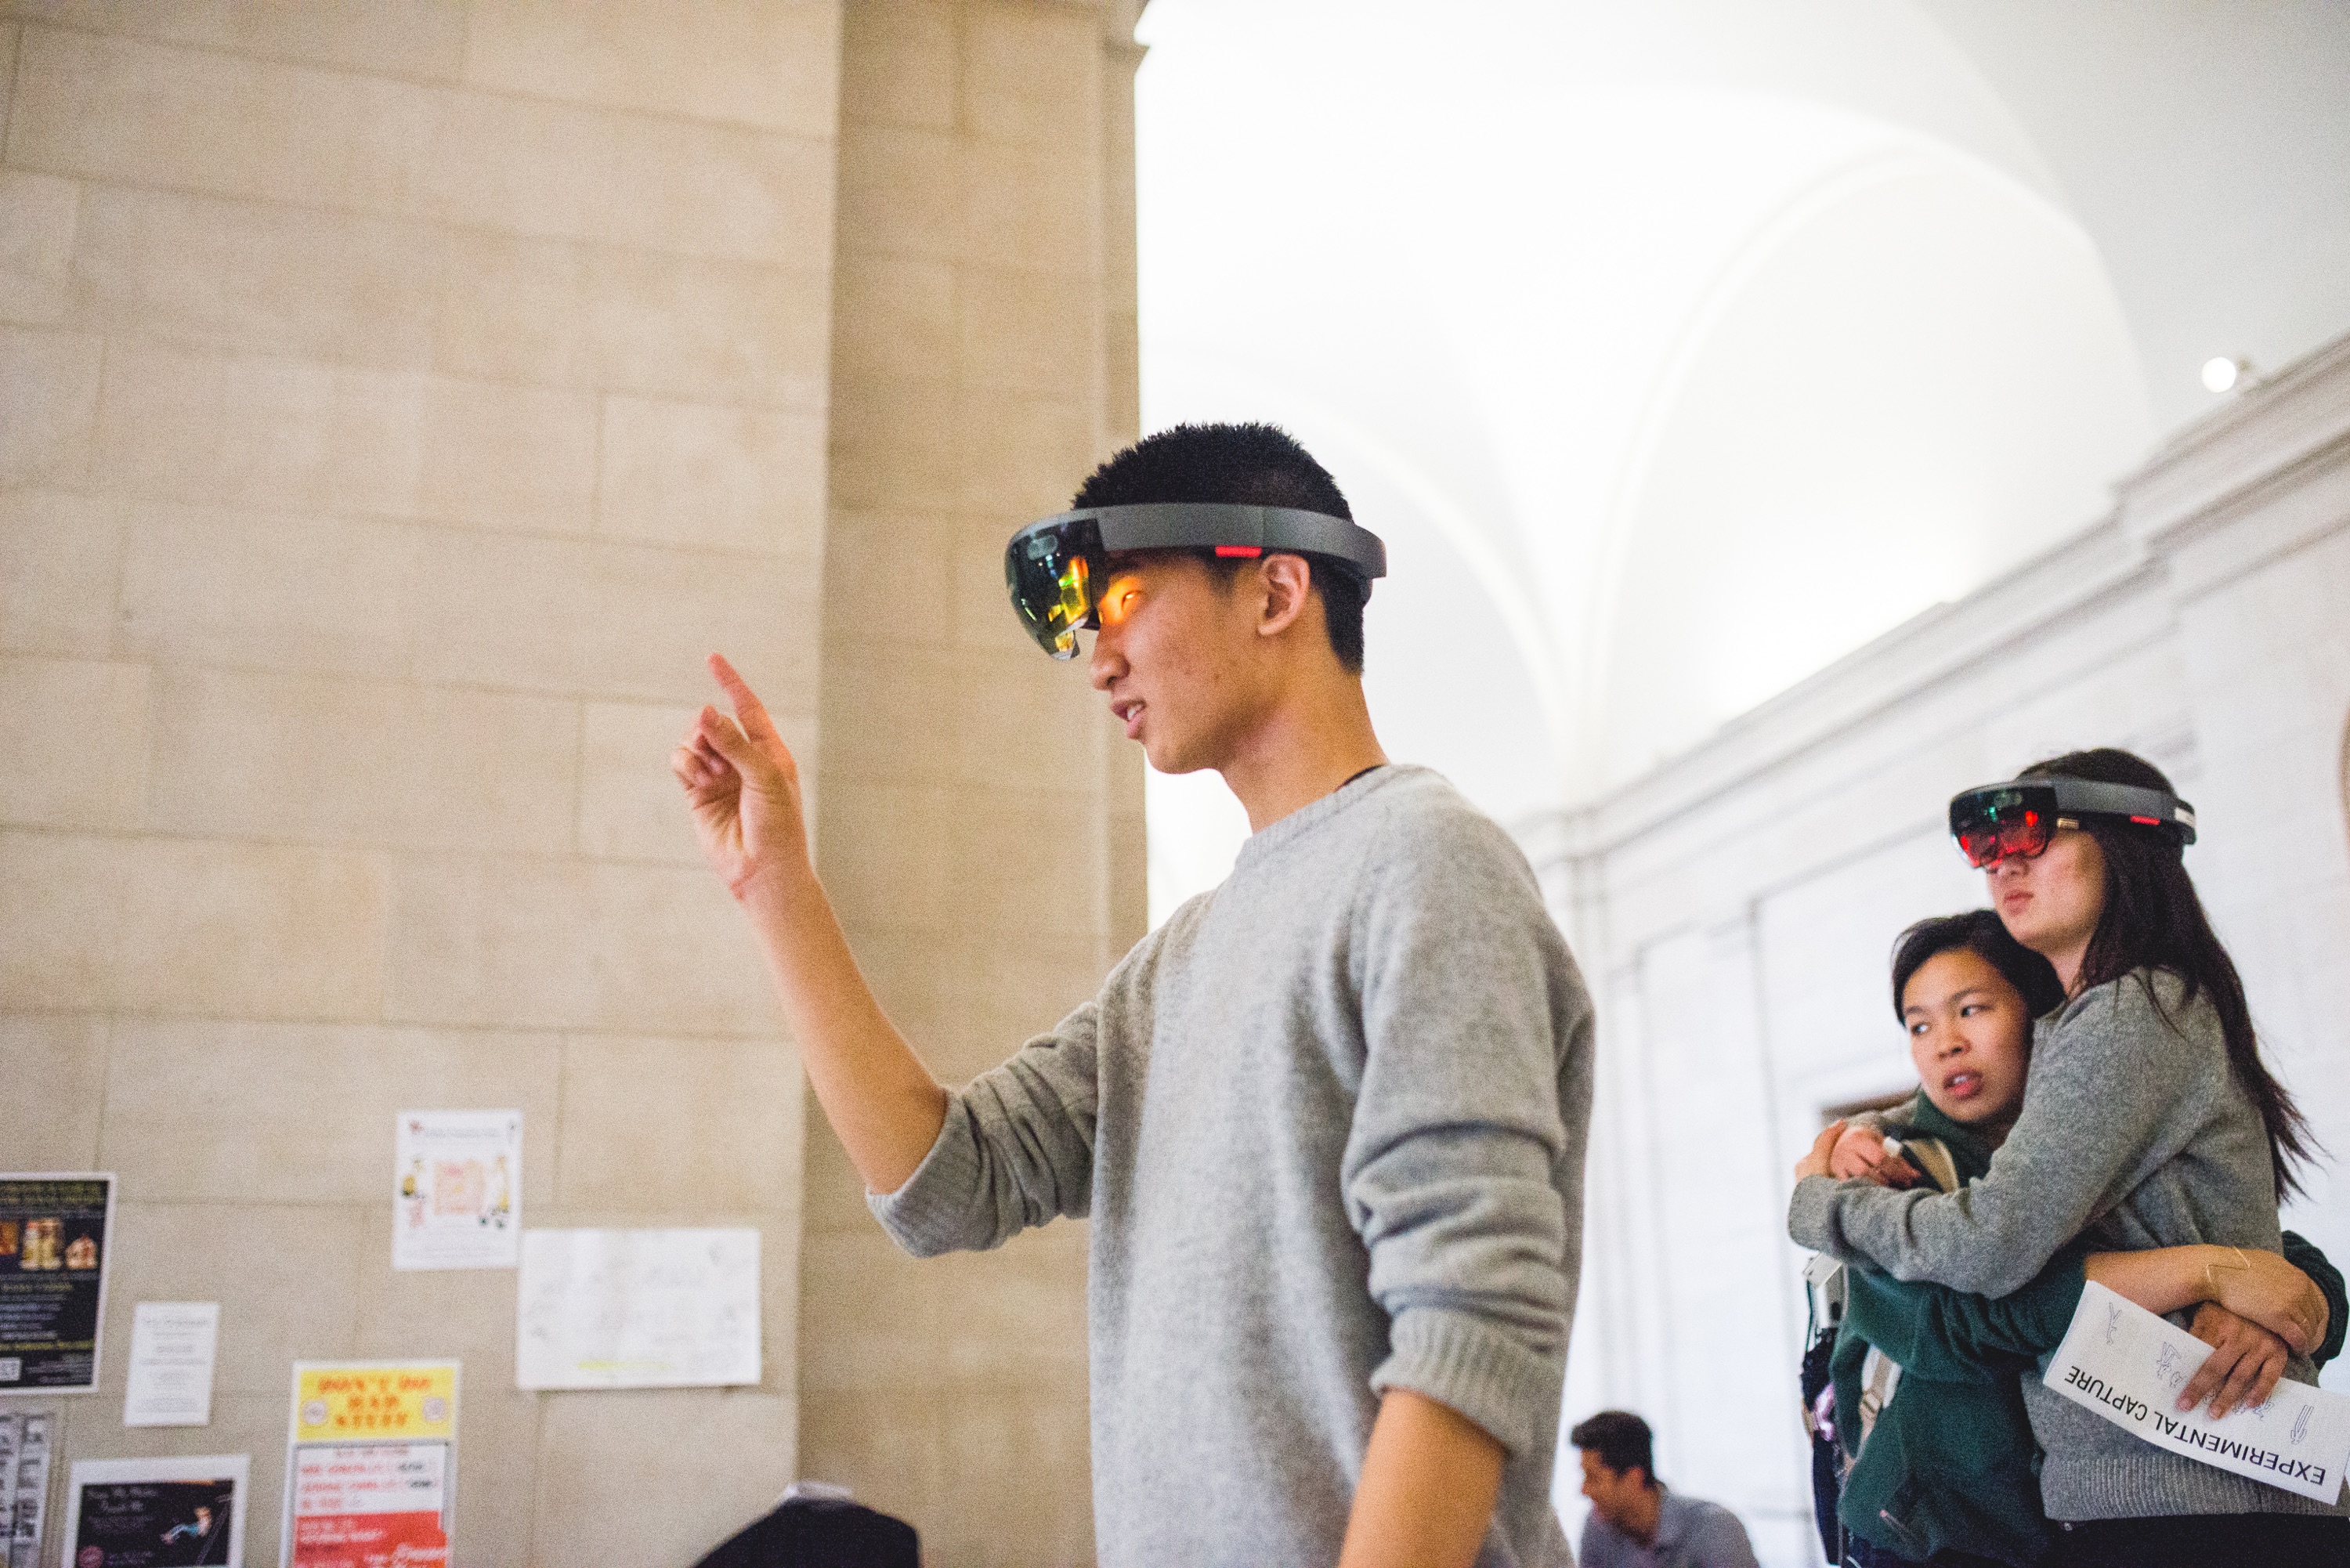
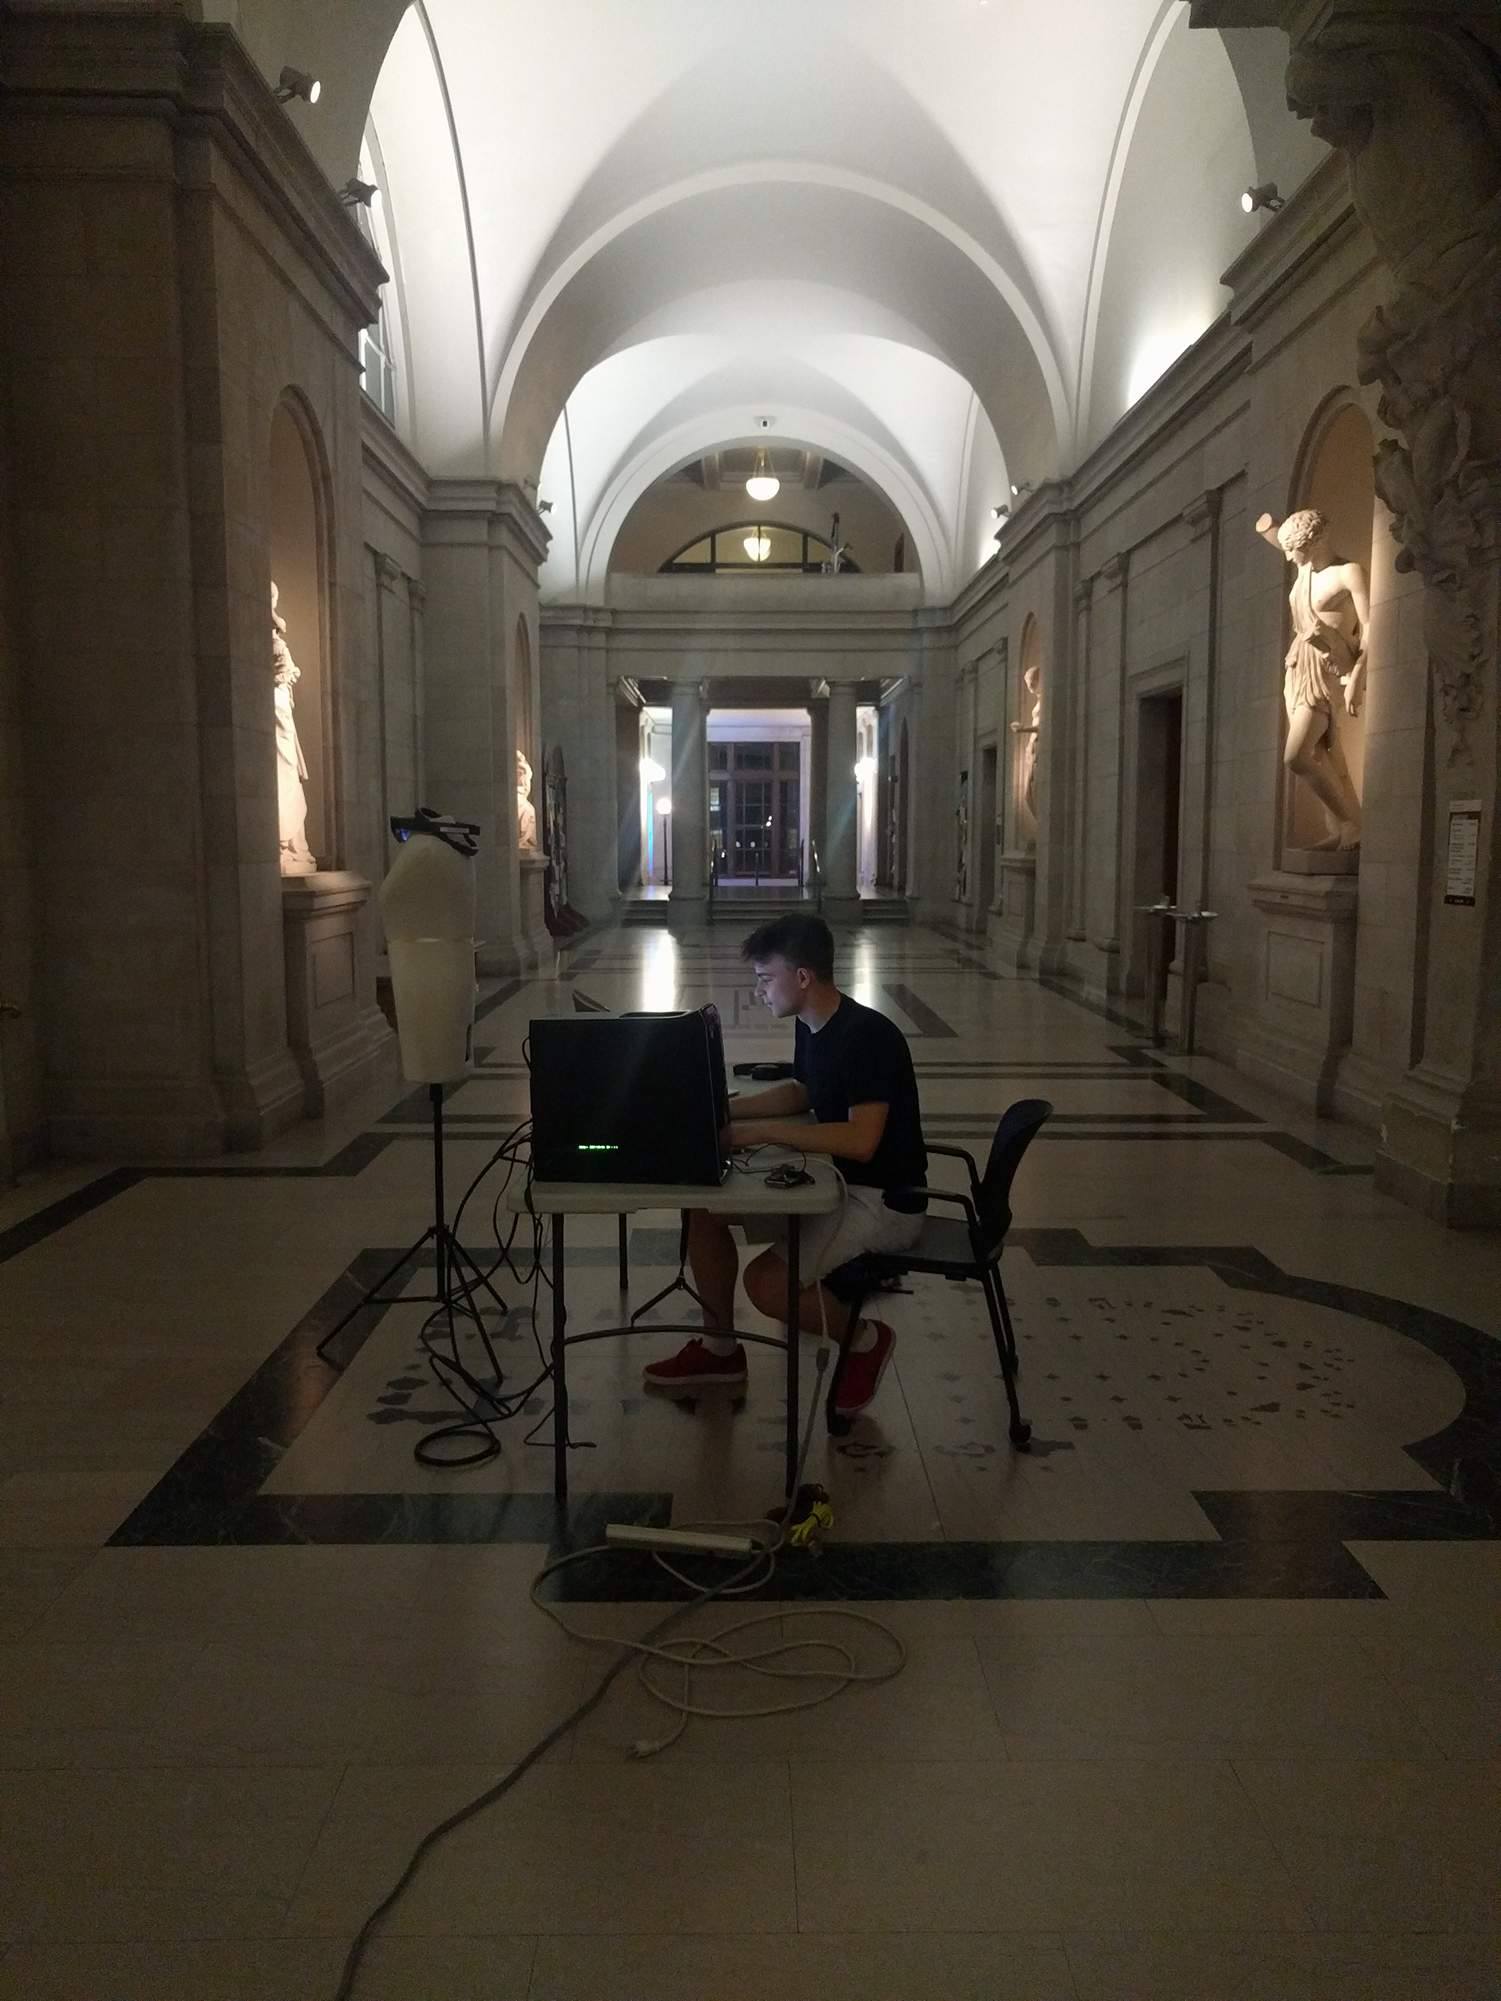
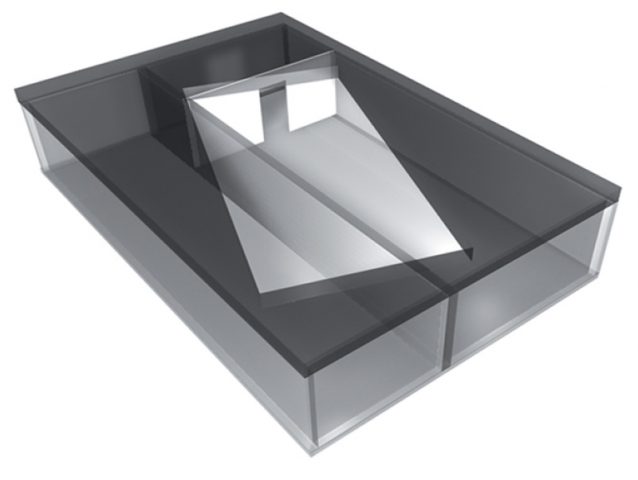
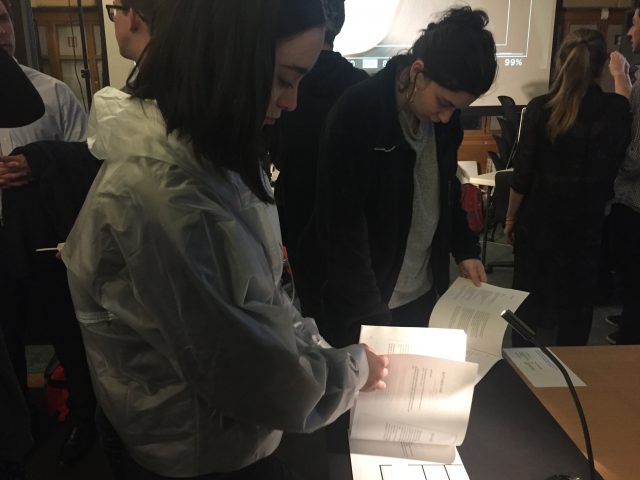
In addition to these conceptual questions, I also went through a very technical investigation into the capture and display (both interactively and statically) of the data generated by the various motion capture processes available to me. I was able to work with CMU Robotics / CS student, Hanbyul Joo, and the Panoptic Studio, which is a massively multiview system for markerless motion capture using 480 VGA cameras, 30+ HD cameras, 10 RGB-D sensors (Kinects), with hardware-based sync and calibration. I am very interested in the emergent field of volumetric capture, and being able to “film” people volumetrically for use in immersive experiences such as VR, MR, and interactive installation. I want to be able to capture people as they are – without having to wear motion capture suits with retroreflective markers – and to capture multiple people in physical contact with each other, which in traditional motion capture is extremely difficult to do. Dance is the perfect form to explore this, and with slowdanger we definitely pushed the limits of each system we were working with. For the capture in the Panoptic Studio I was told, yes they can touch, but hugging is very difficult. So the two dancers began in a hug. Then, in the Motion Capture Research Lab, with the leotards and markers, I was told that one dancer picking the other up would probably not work. So were born two peitàs of each dancer carrying the other. The hug from the Panoptic Studio worked (at least for my purposes, in which I was only using the dense point clouds, not the skeletons), but the two pietàs resulted in the rainfall of retroreflective balls from the leotards to the floor. I did not end up using this capture in my final piece, but I’m interested to experiment with it later to see what happens when a motion capture skeleton suddenly disintegrates.

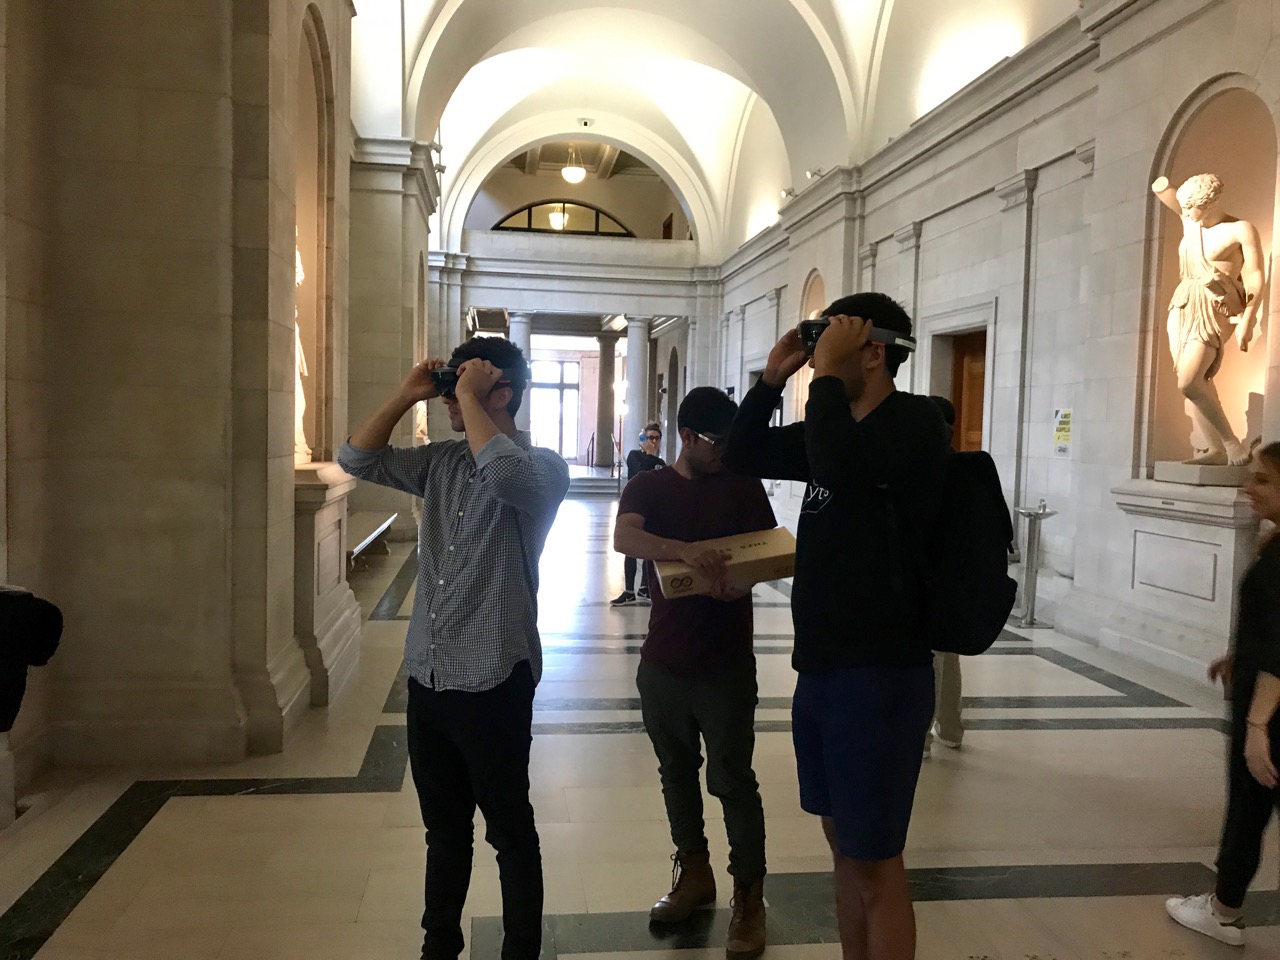
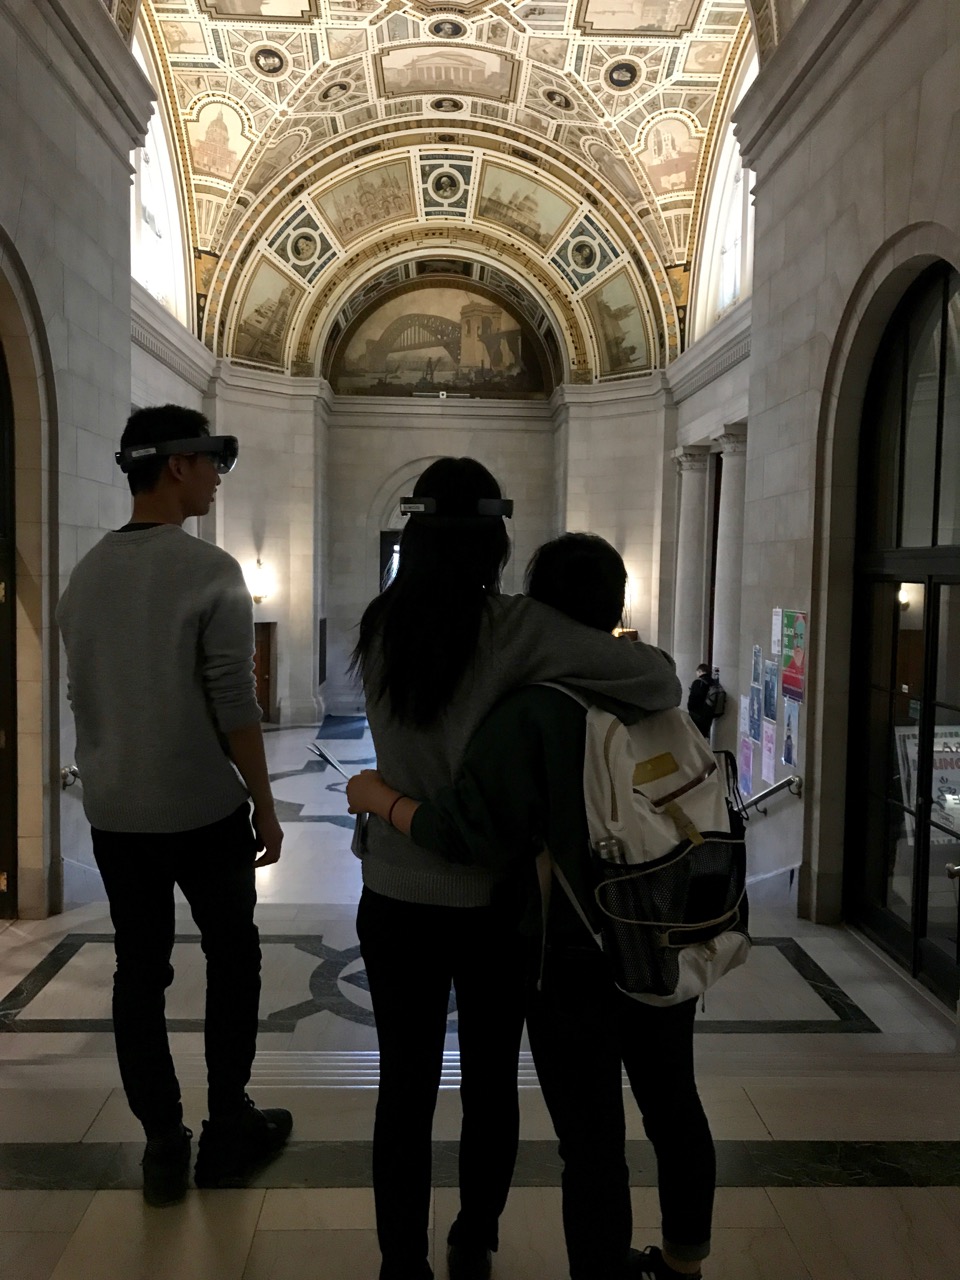
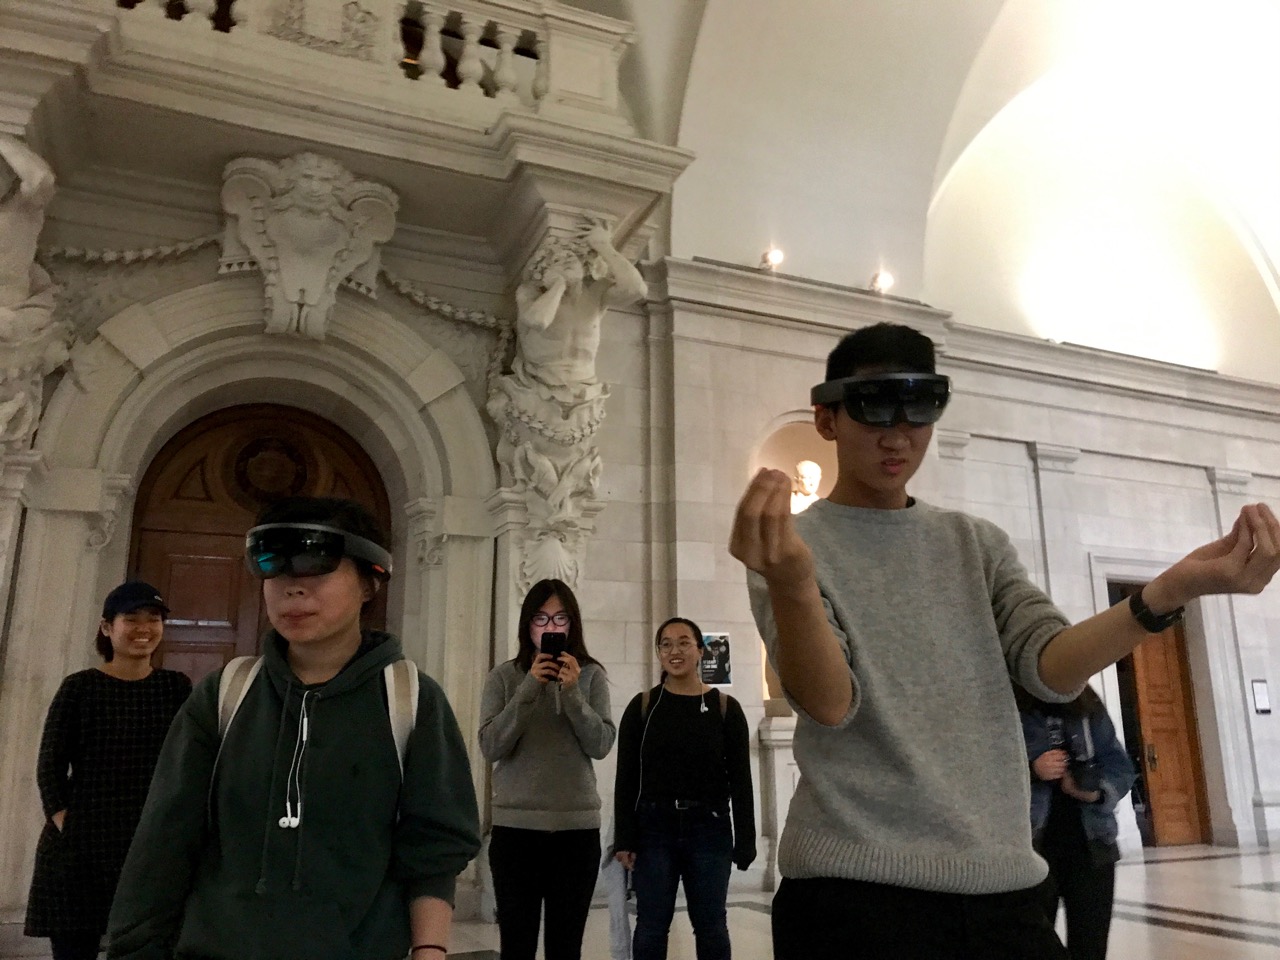
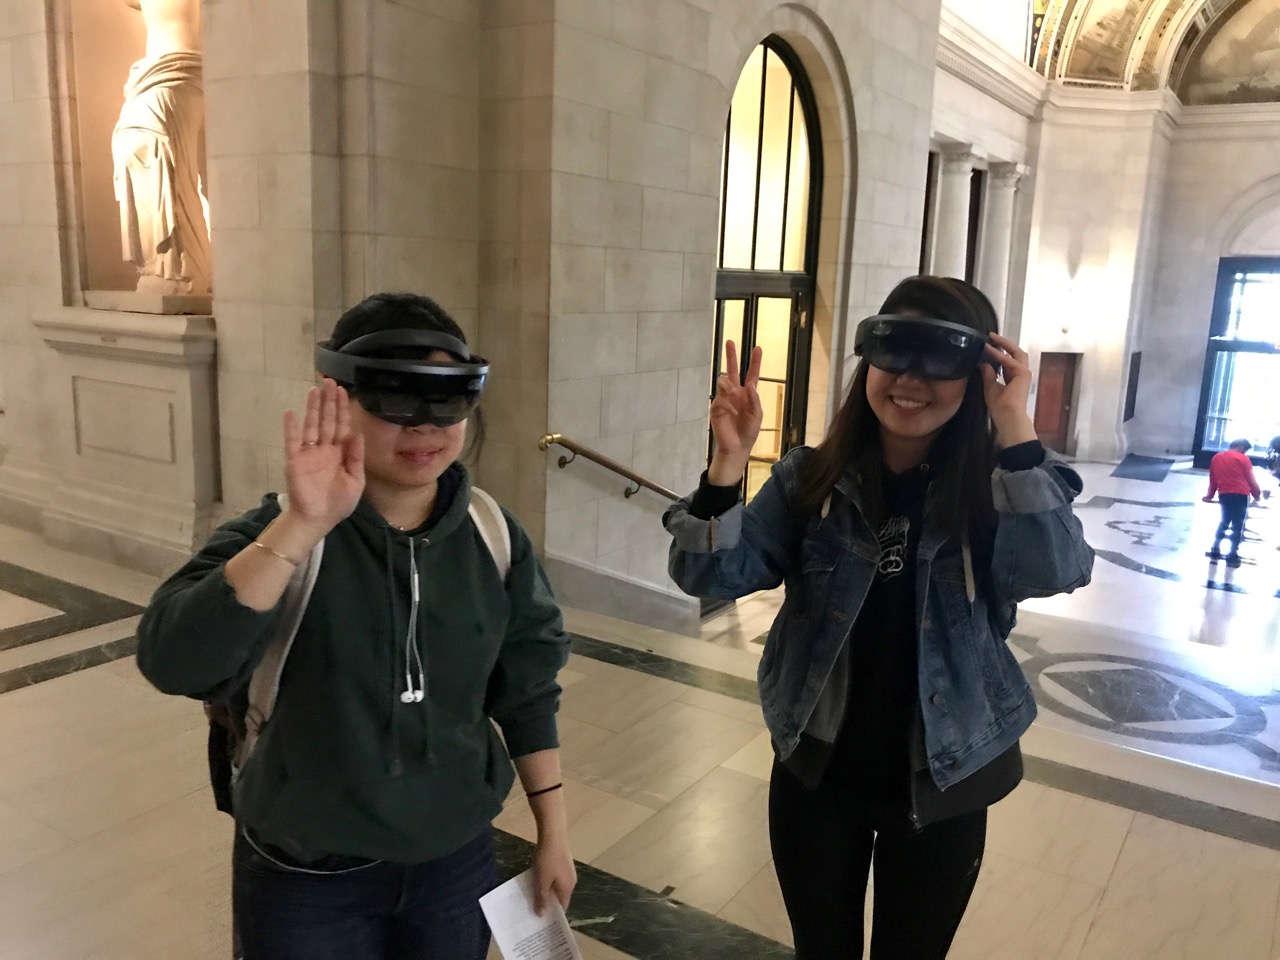
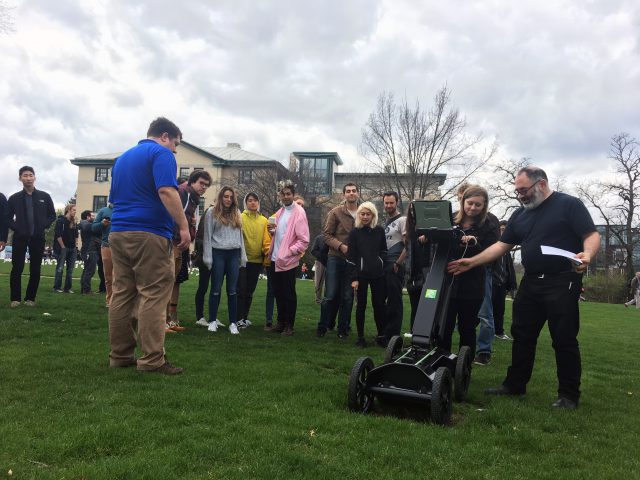
Here’s a look into the capture process:

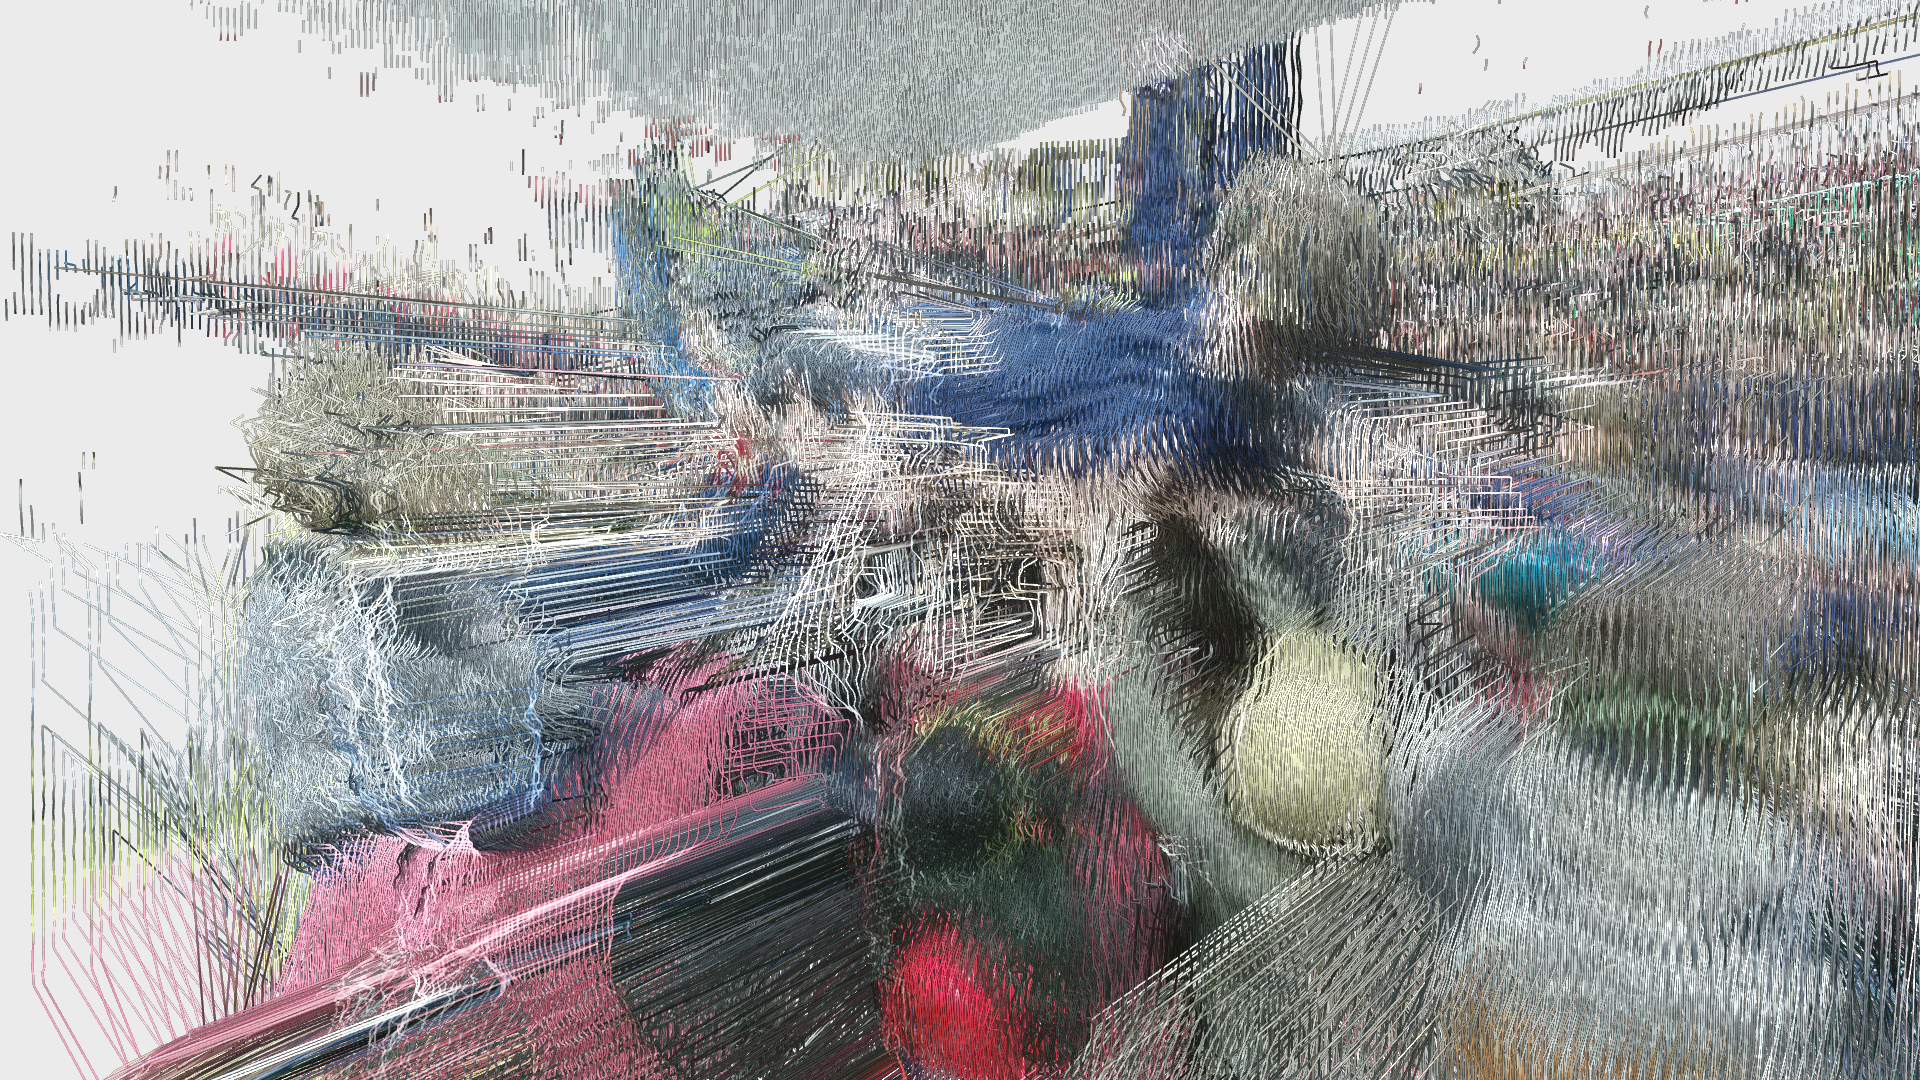
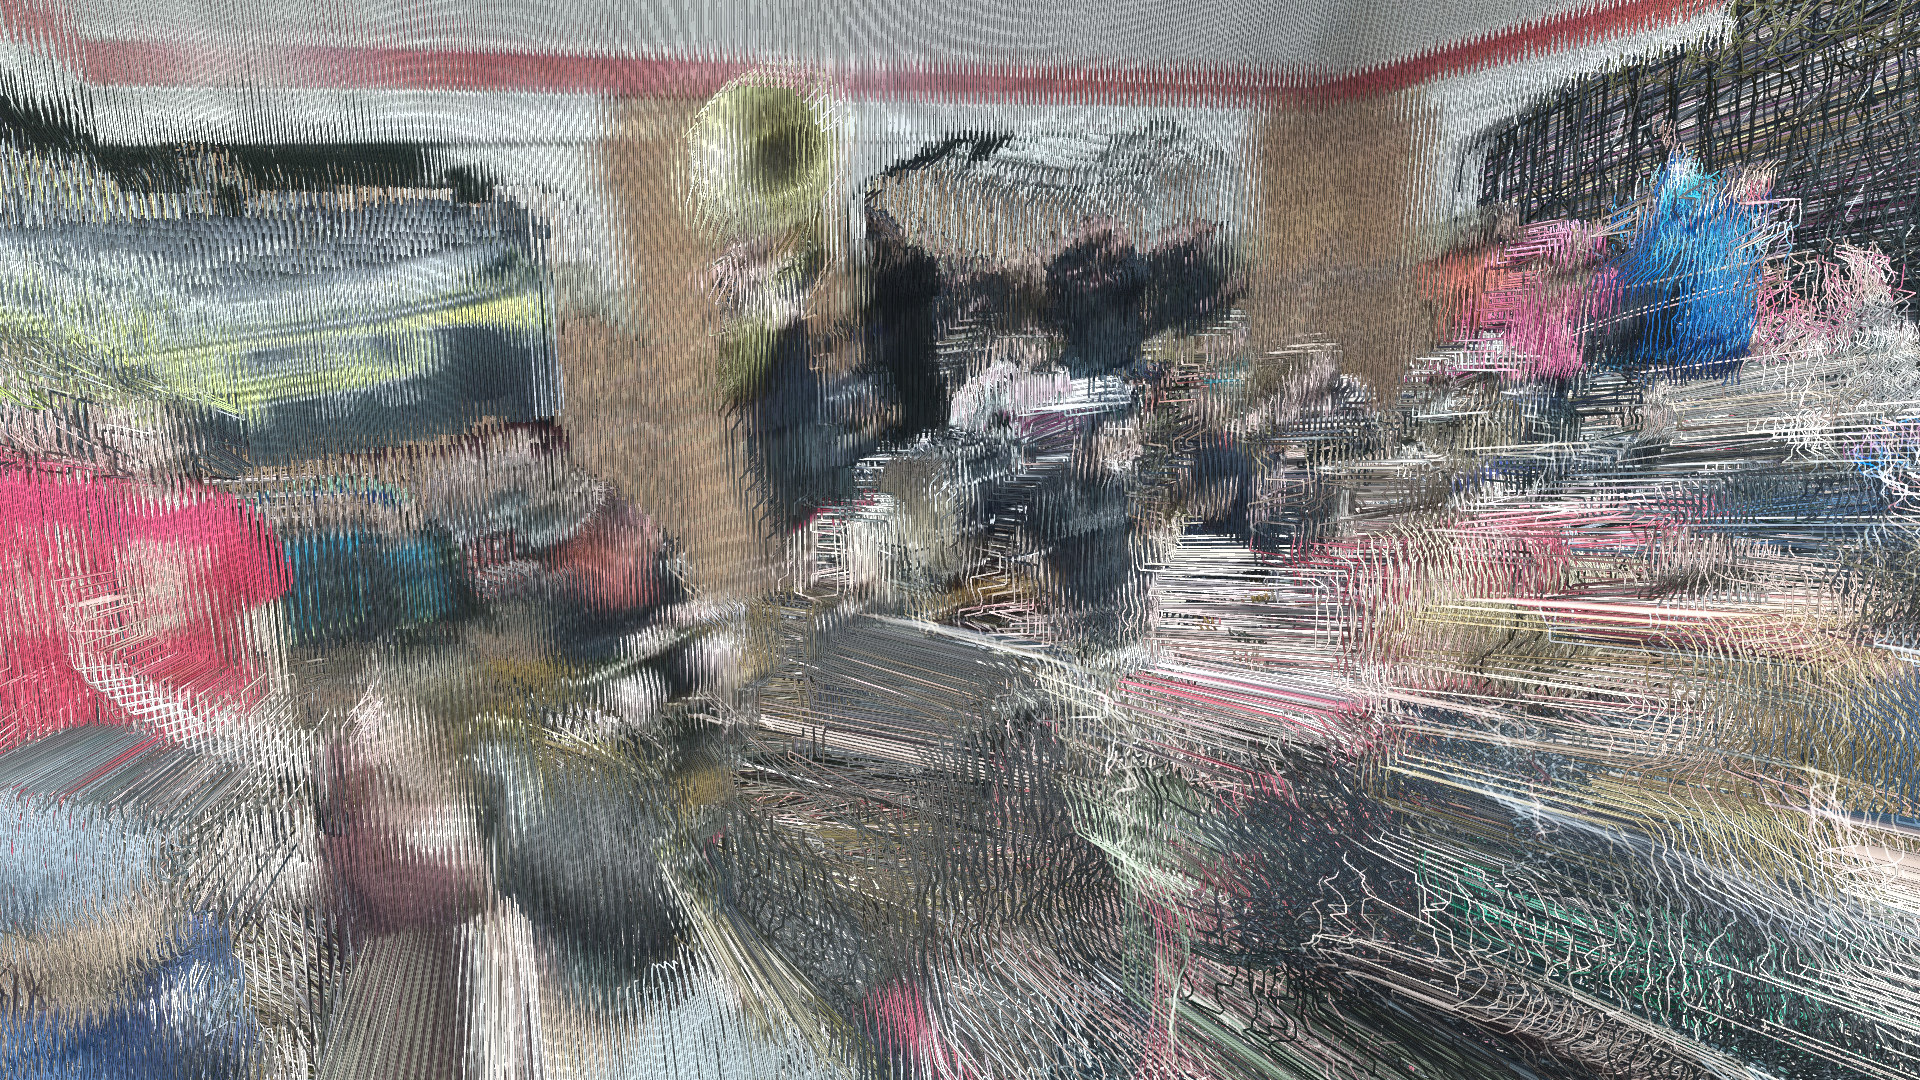
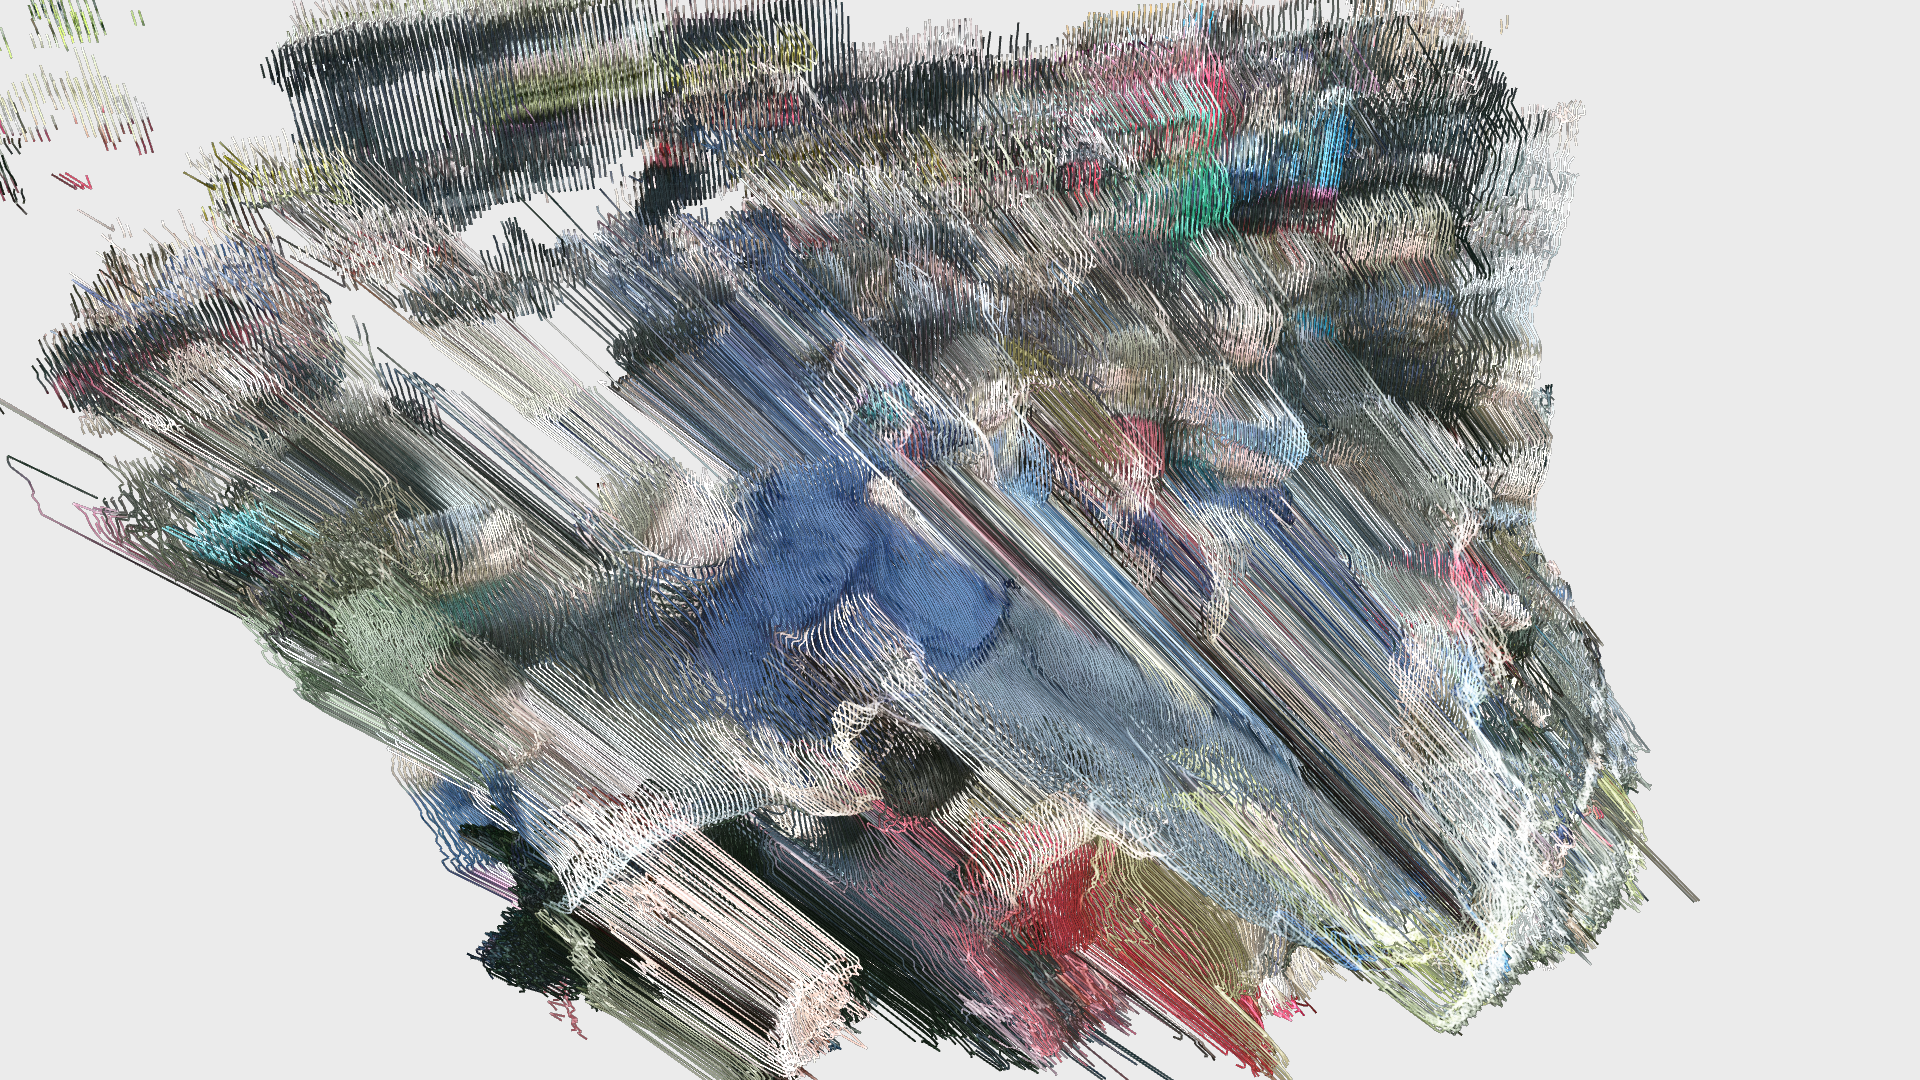
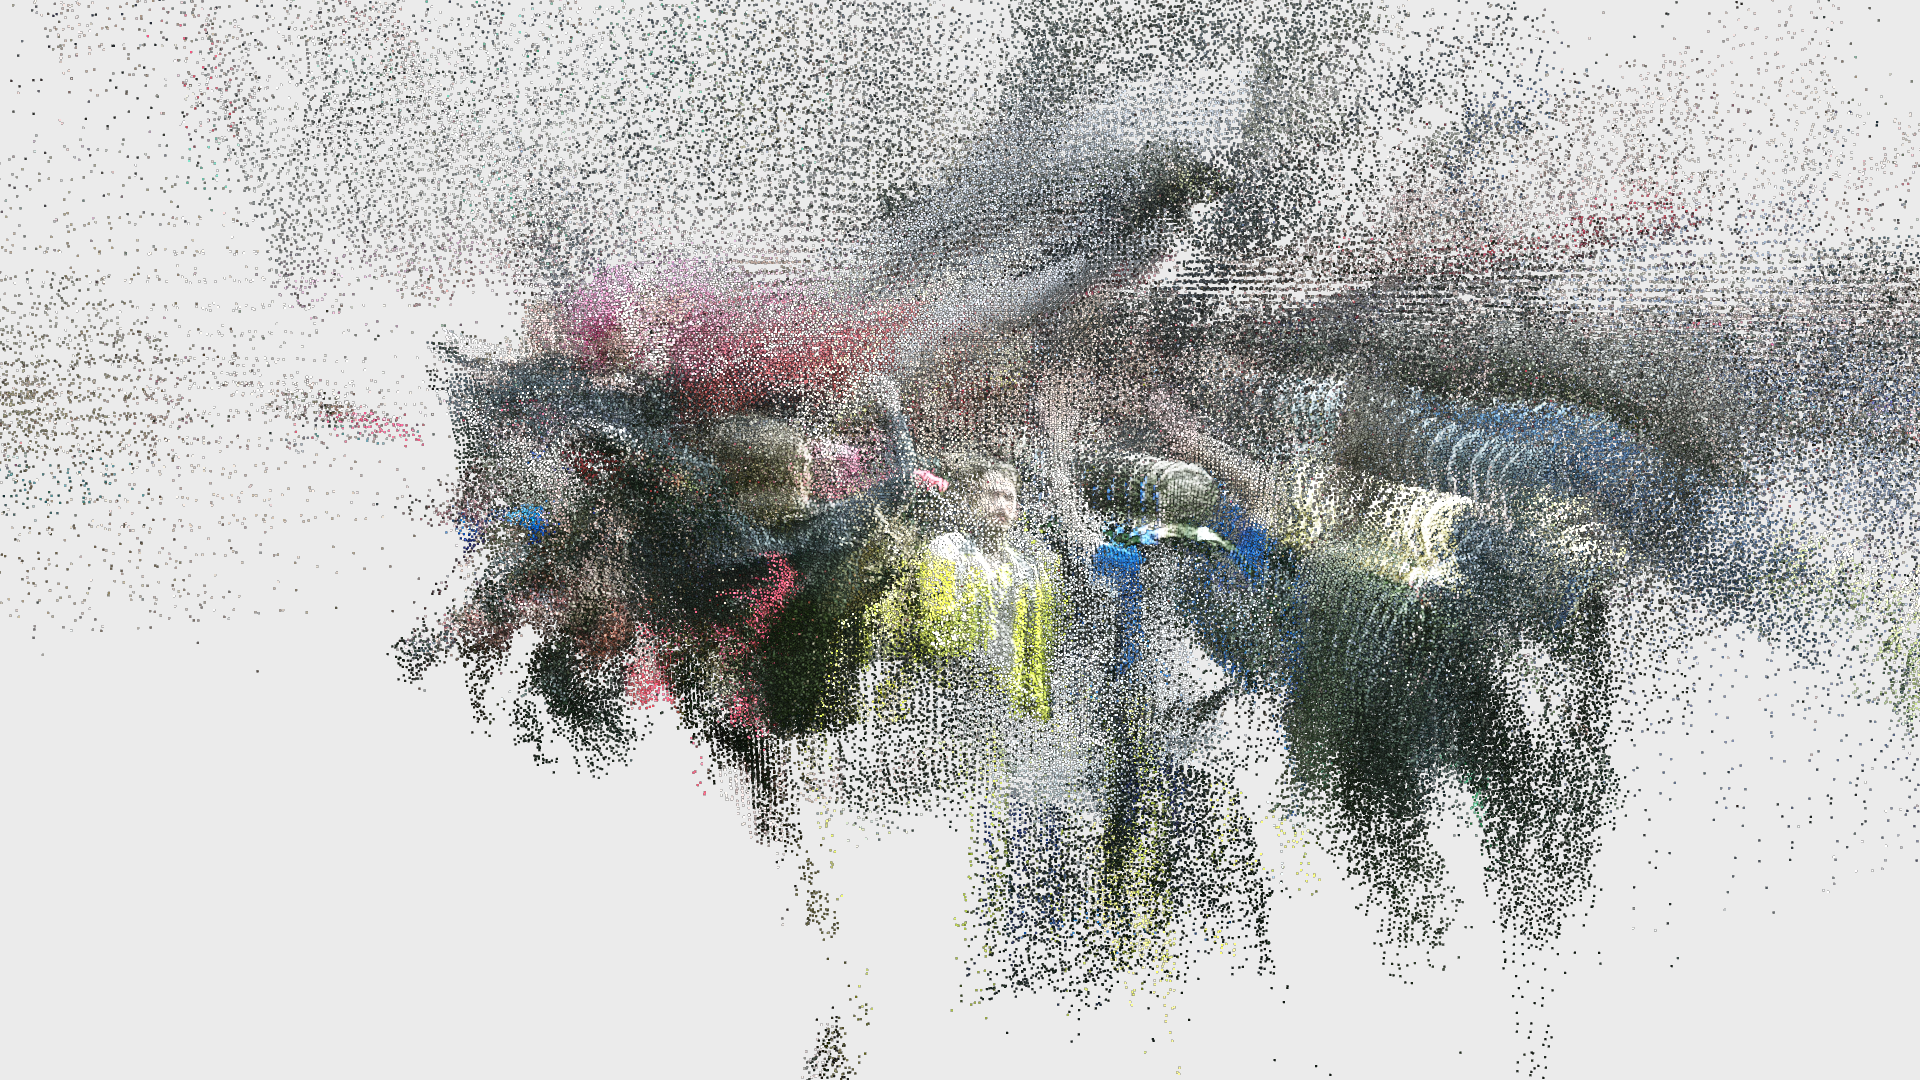
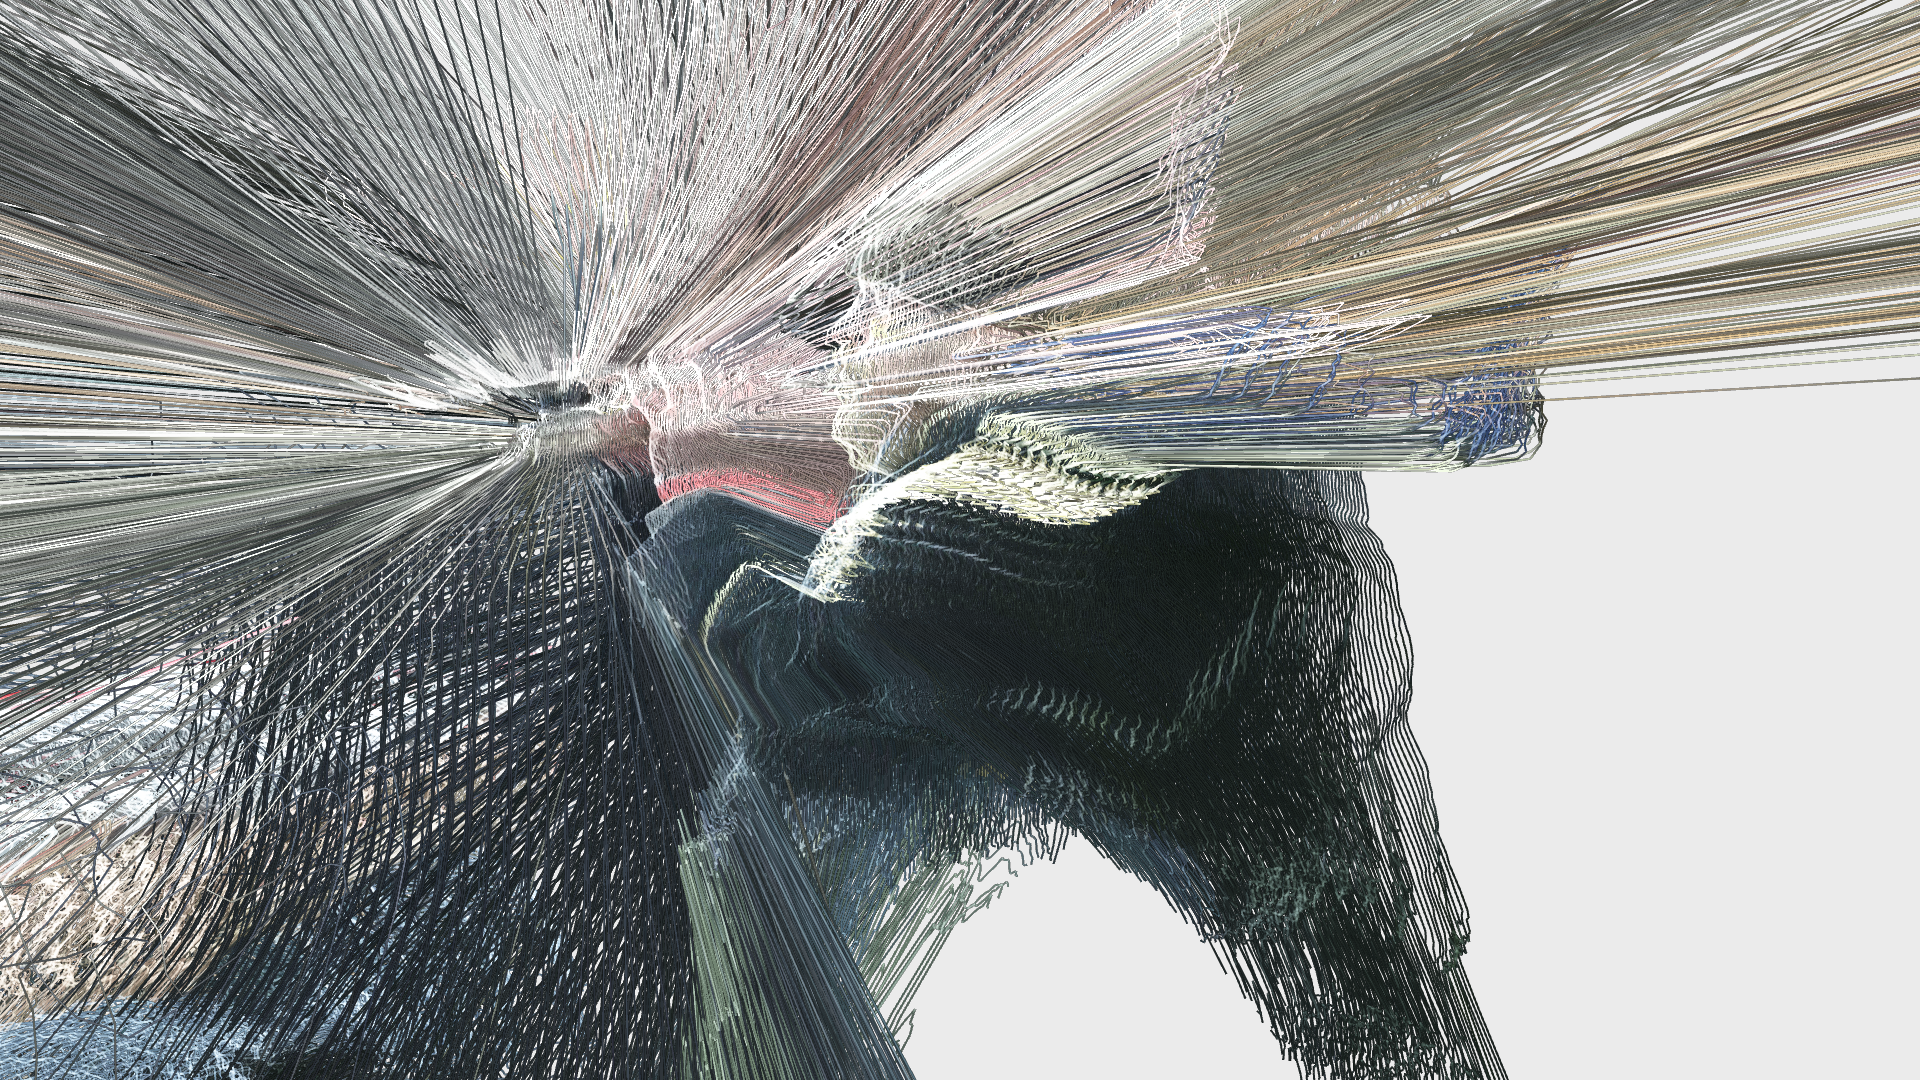
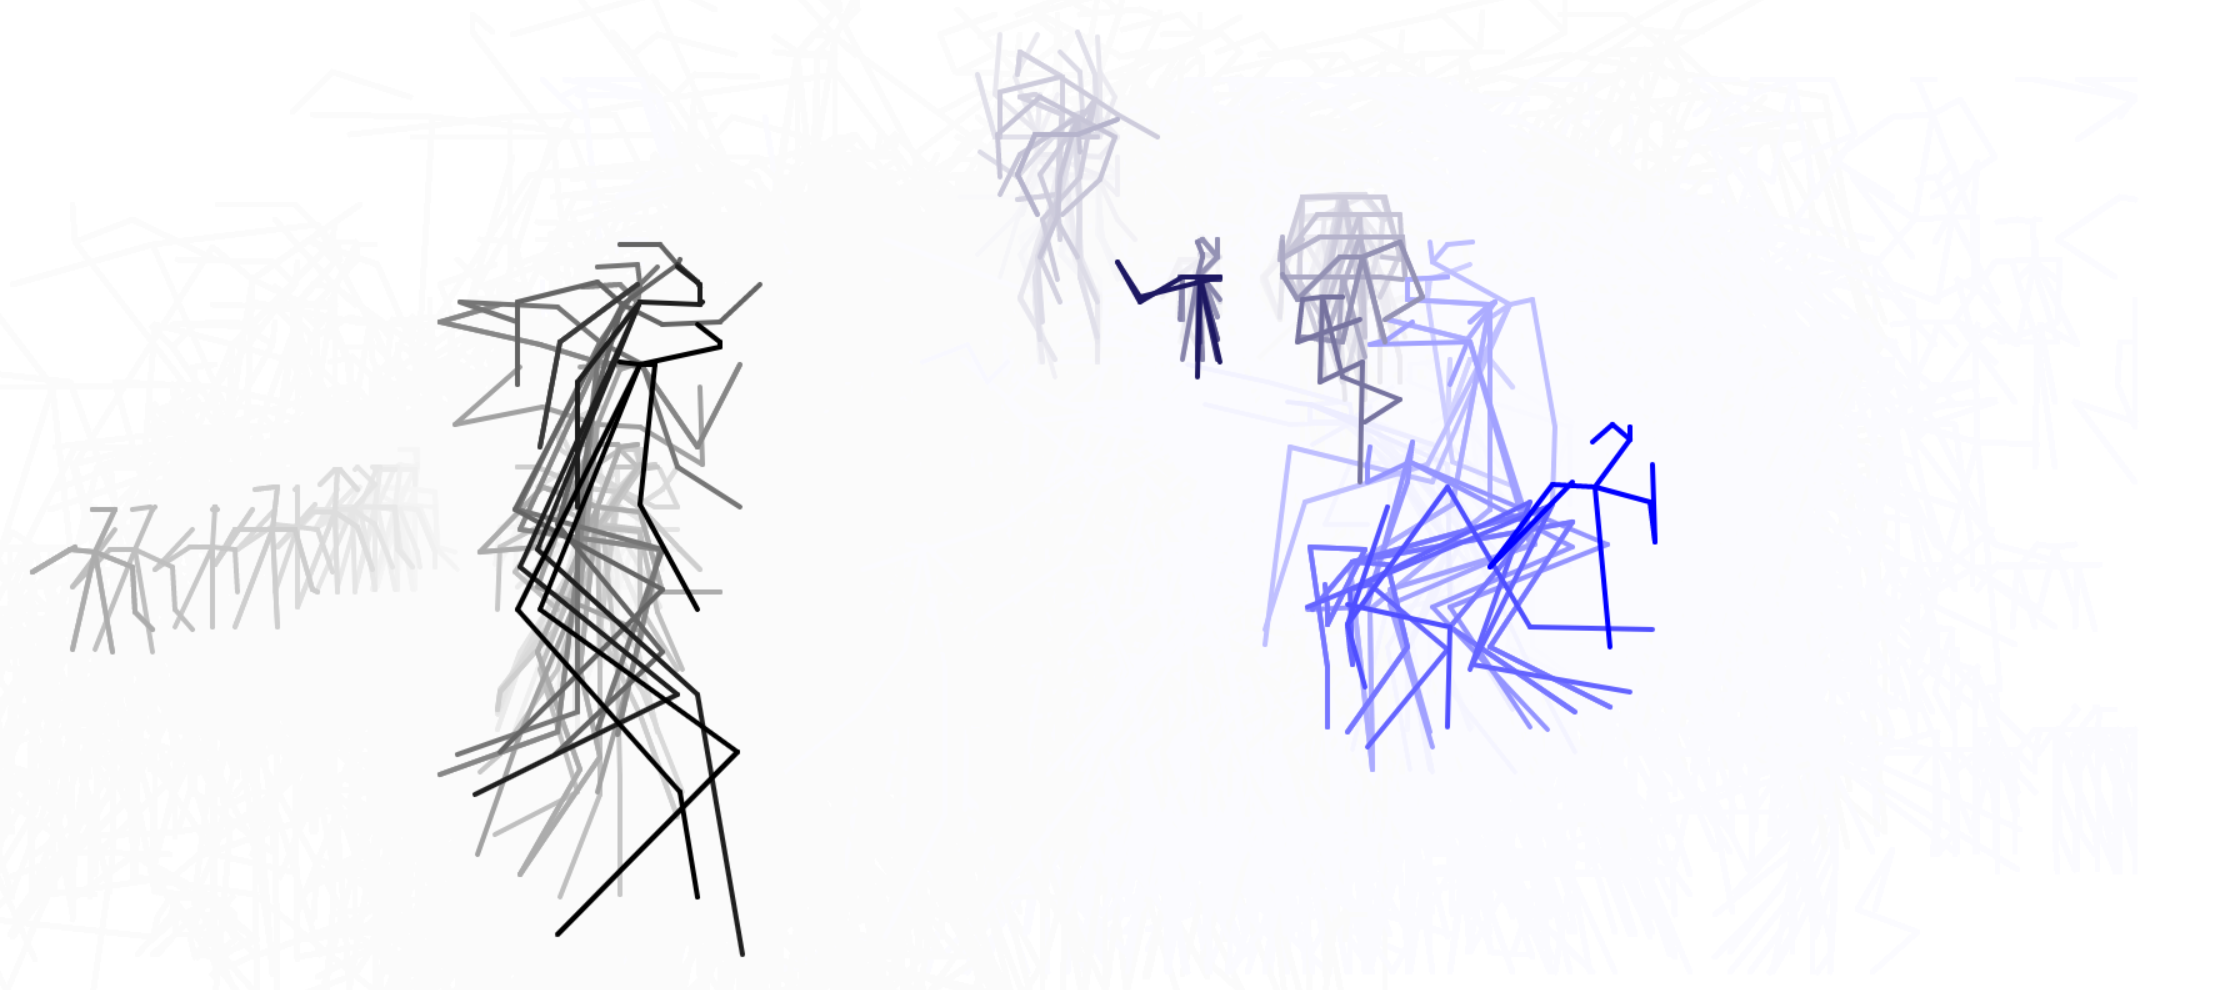
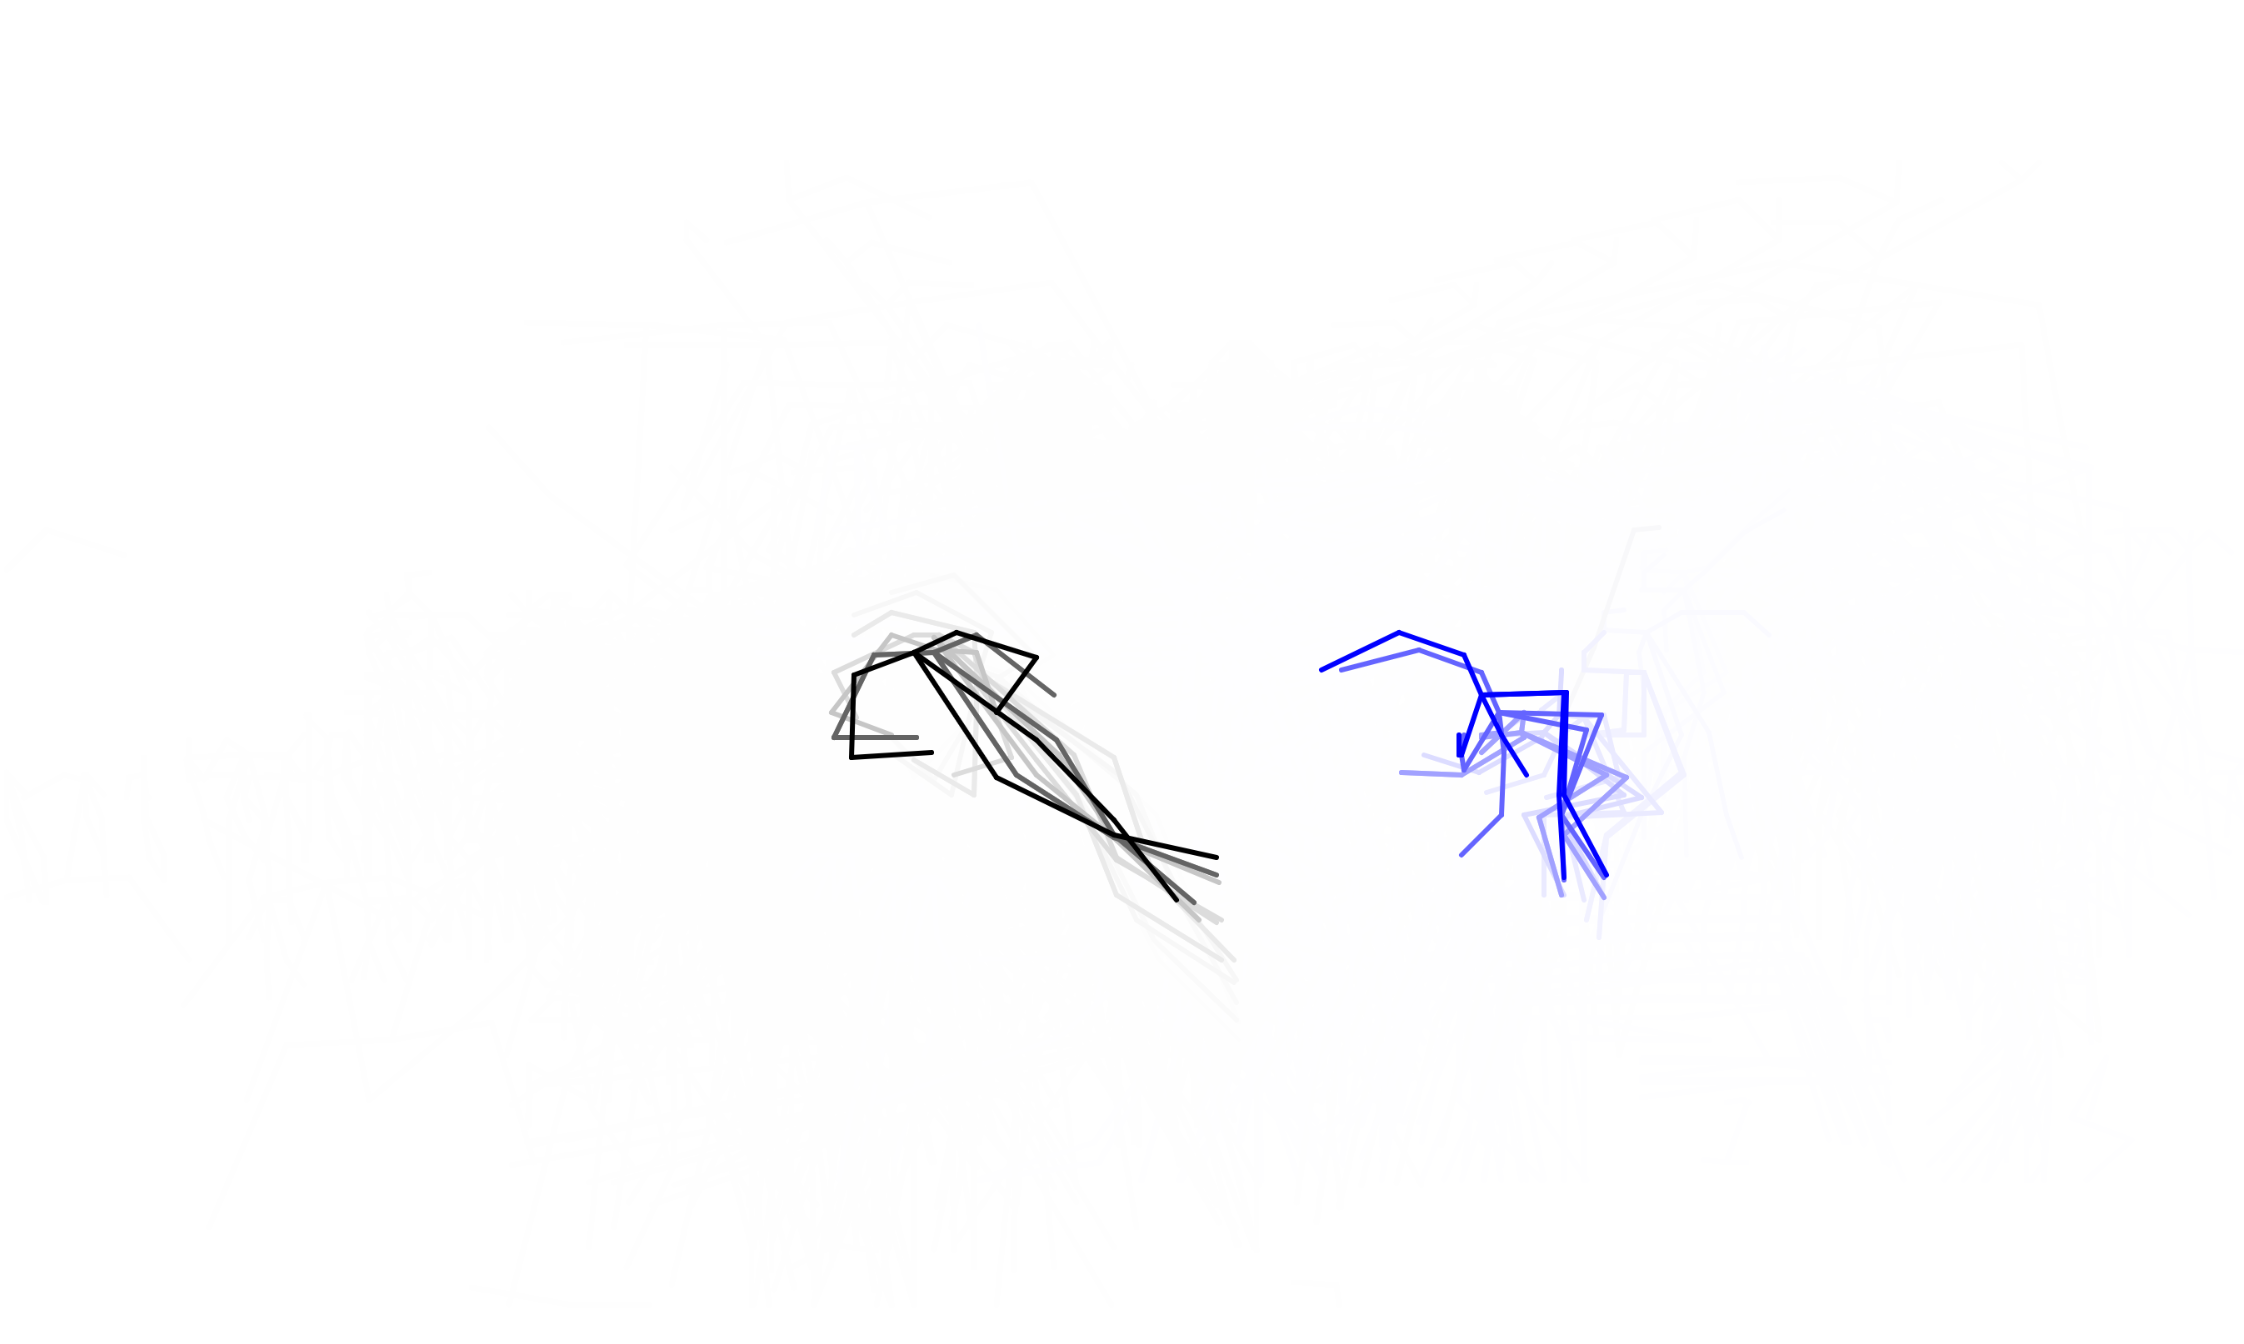
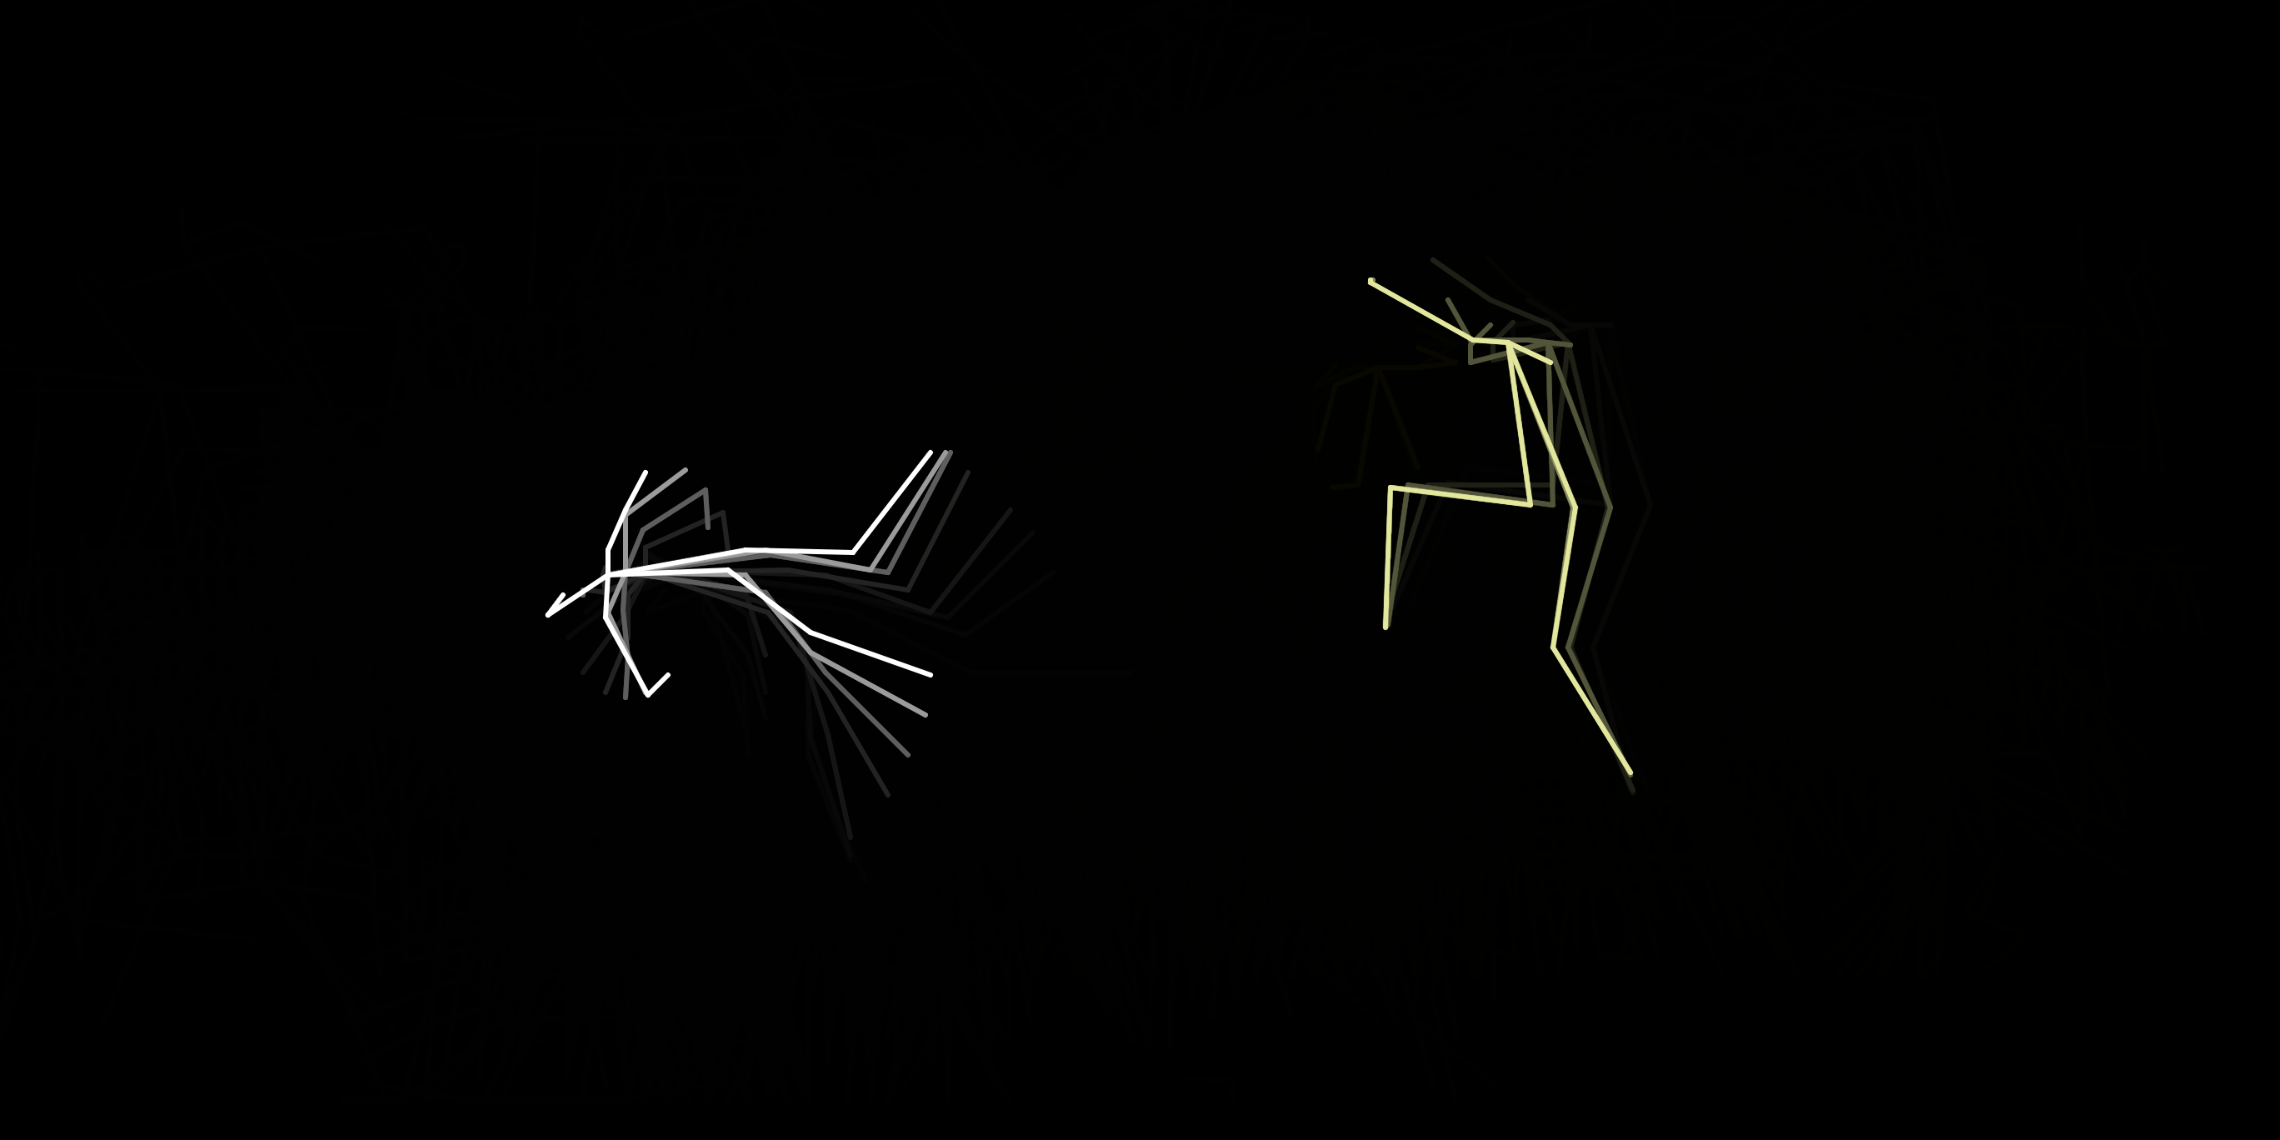
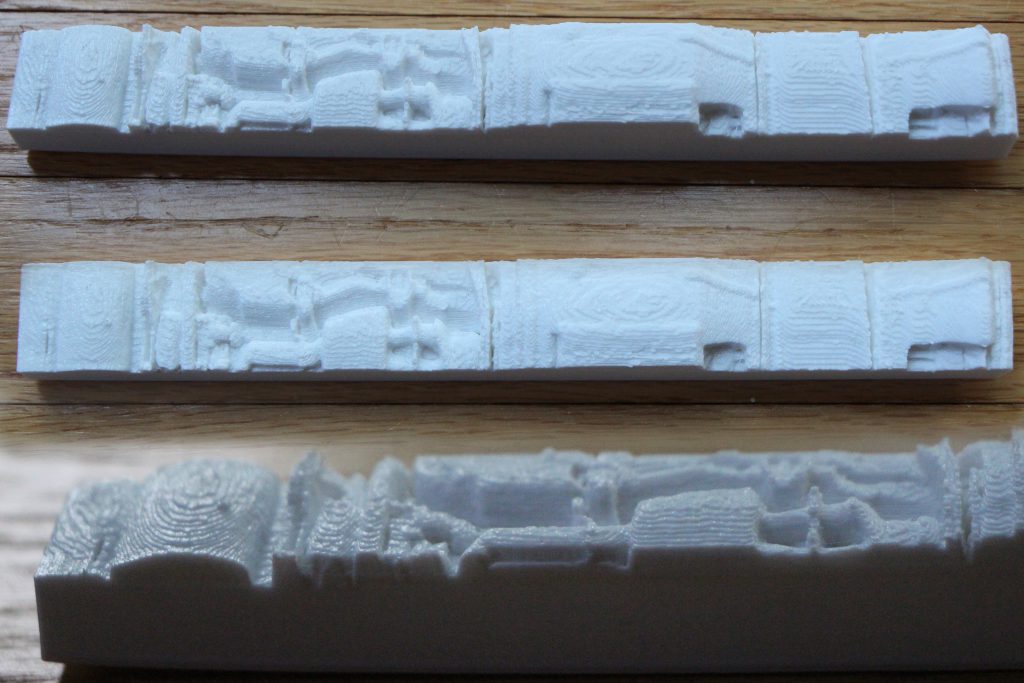
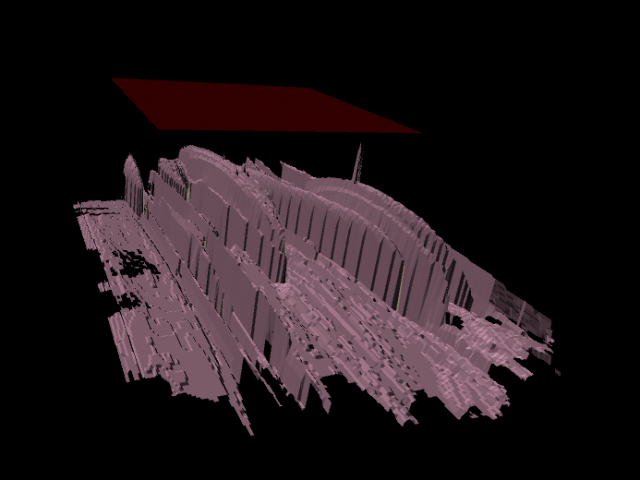
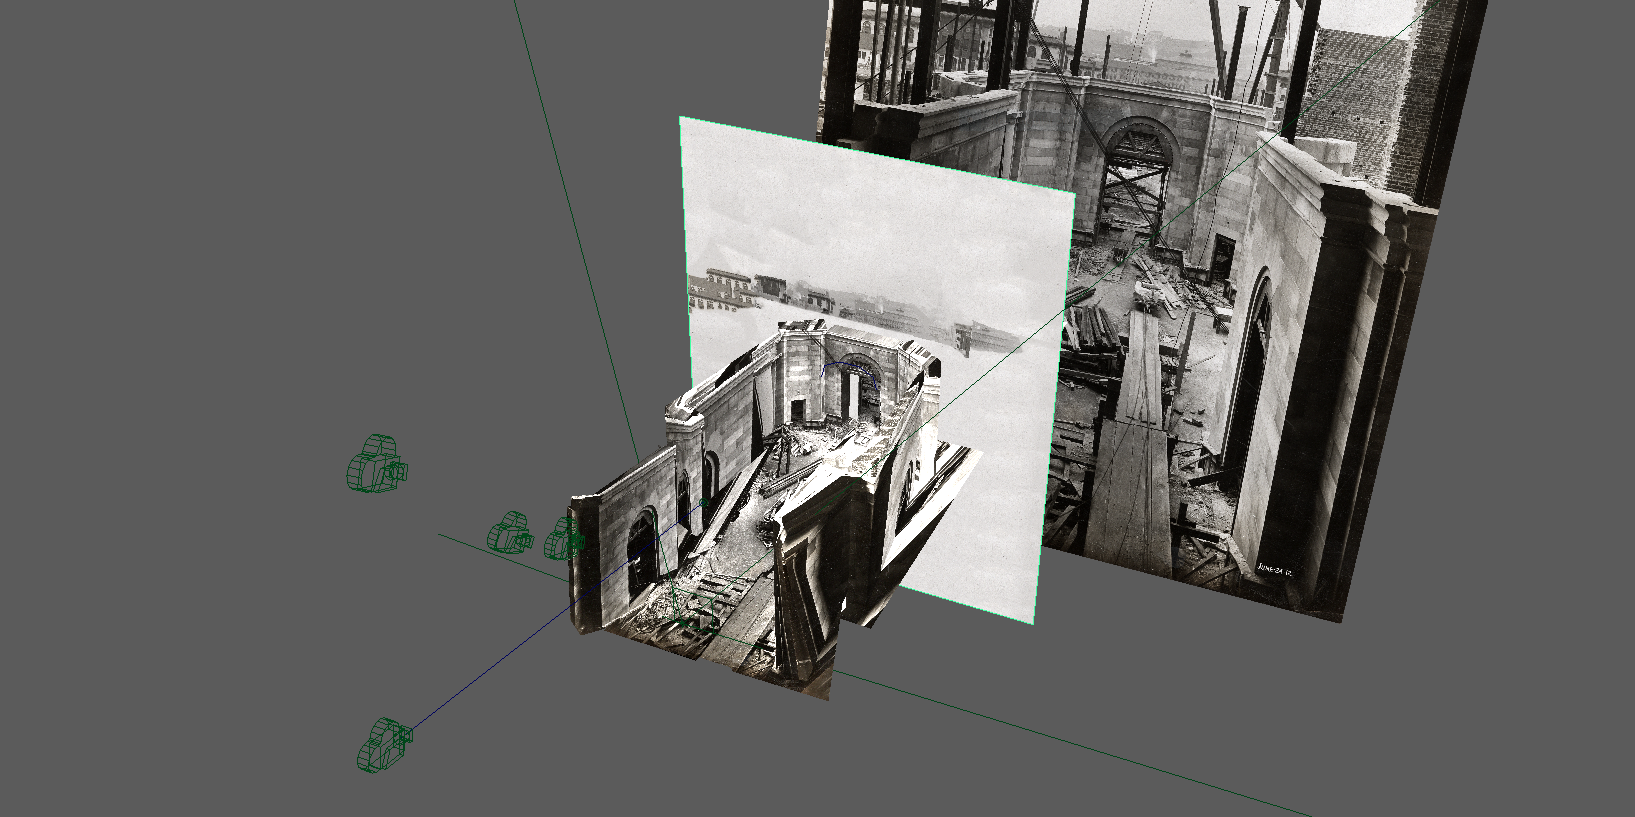
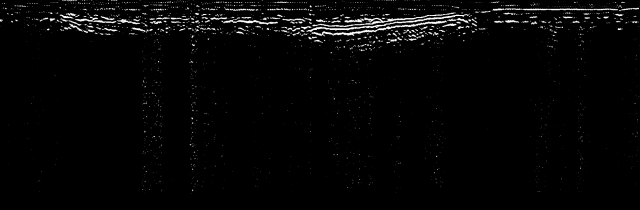
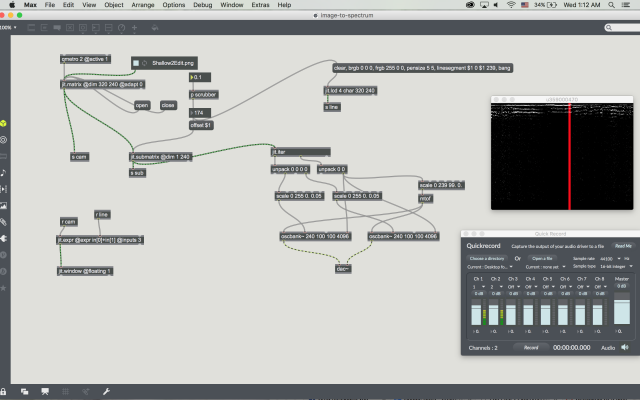
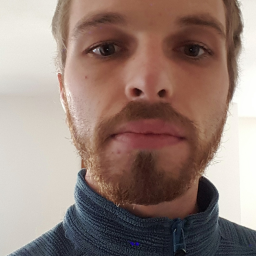
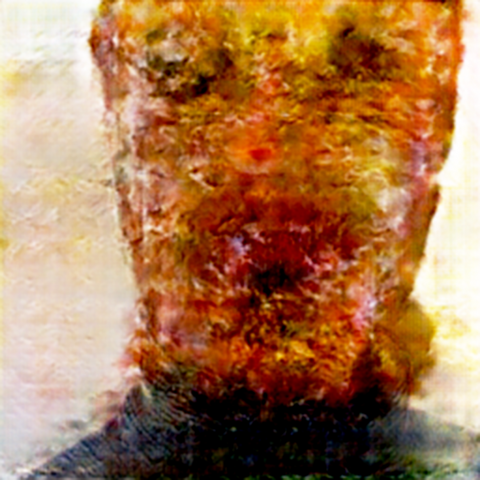
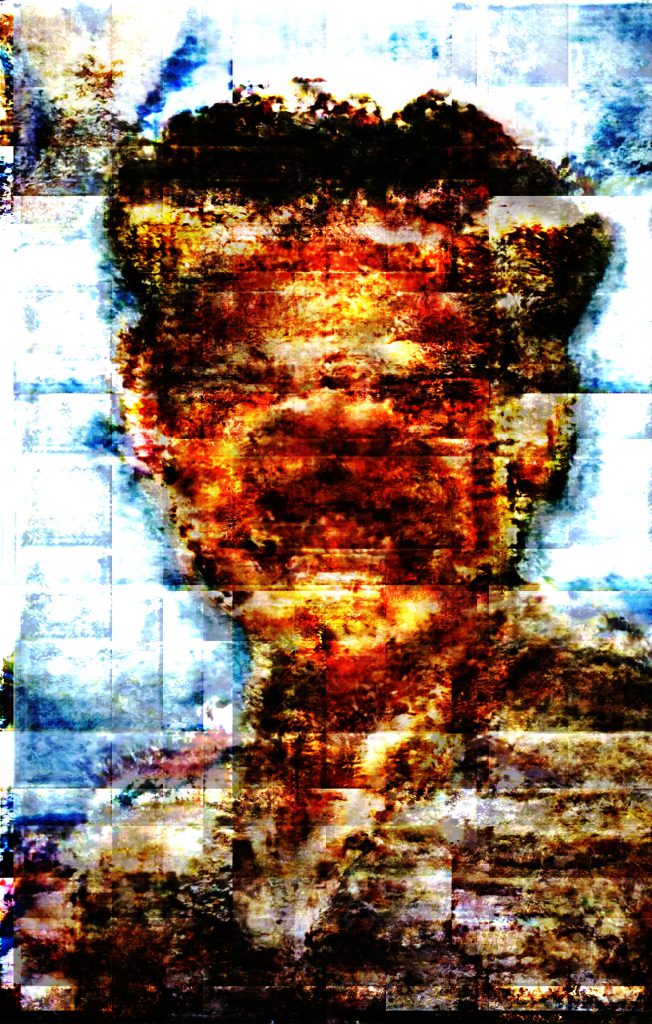
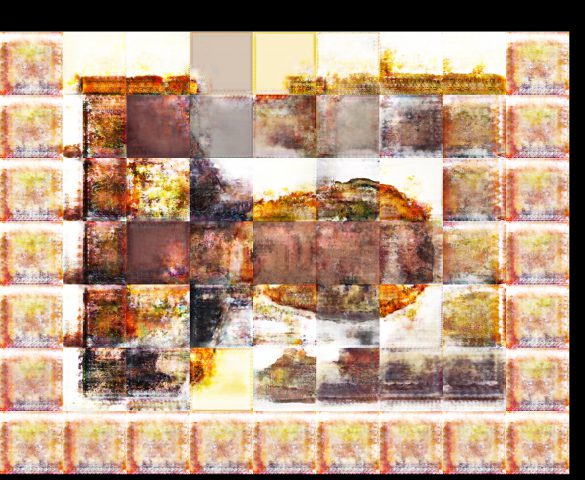
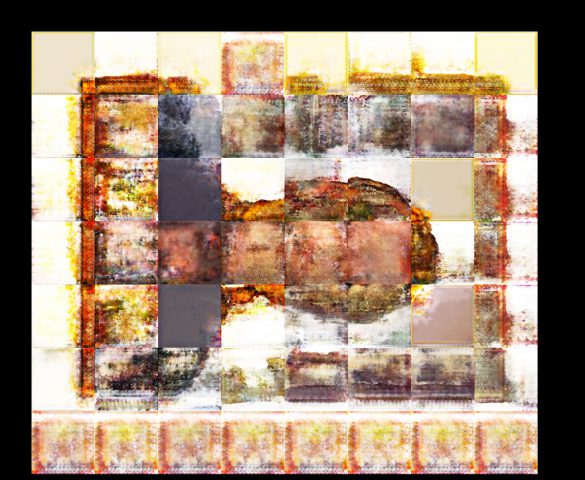
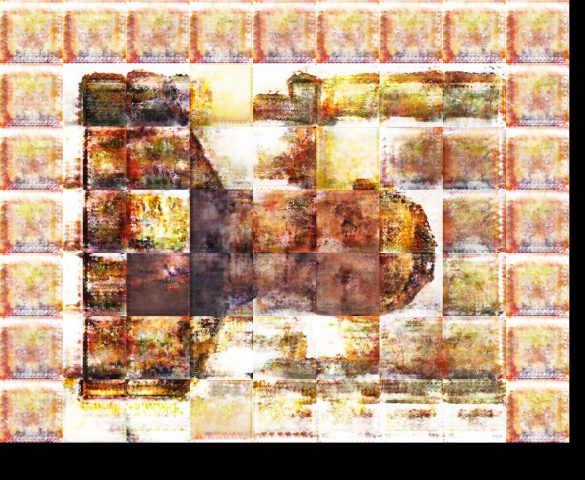
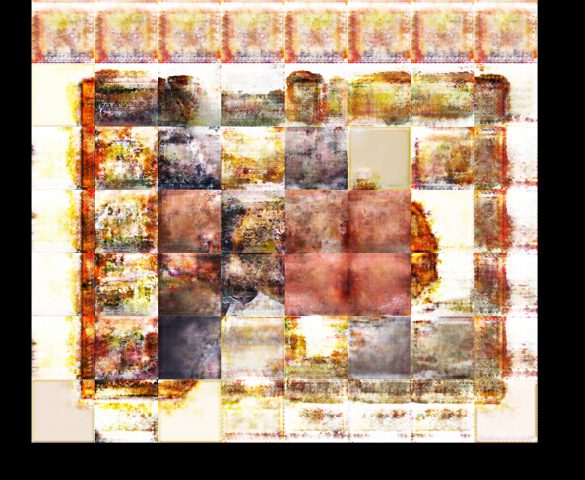
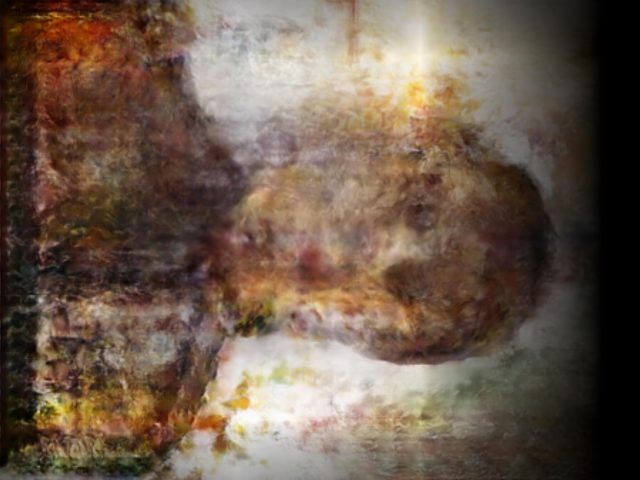
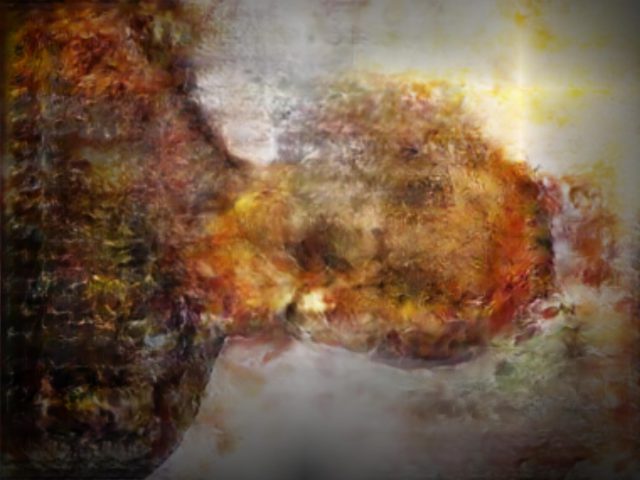
One of the big technical hurdles I encountered during this project was working with the PLY files generated by the Panoptic Dome. These are text files with x,y,z and r,g,b data which create a series of points that generate a dense point cloud – a 3 dimensional visualization of the captured object or person. Displaying these point clouds, or turning them into meshes with texture, is a reasonably documented workflow, through software such as Meshlab or Agisoft PhotoScan. However, scripting this process to generate high-resolution meshes with texture on thousands of PLY files, aka thousands of frames of a capture, is extremely difficult, and virtually non-existent. Each PLY file I received is about 25 megabytes, and in a 3 minute capture, there are roughly 8,000 frames. This means scripting either the display of these point clouds (relatively unaltered) or the creation of decimated meshes with high resolution textures re-projected onto the decimated mesh – is pushing the limits of the processing power of our current computers. 3D software such as Maya and Unity do not import PLY’s natively. This project required a good amount of collaboration, and I’m grateful to Charlotte Stiles, Ricardo Tucker, and Golan who all worked with me to try various methods of displaying and animating the point clouds. What ended up working was an OpenFrameworks app that used ofxAssimpModelLoader and ofMesh to load the point clouds, and ofxTimeline to edit them with keyframes on a timeline. When I first tried to display the point clouds, they were coming in with incorrect colors (all black), so with some research it was determined that the RGB values had to be reformatted from 0-255 integer values to 0-1 floats. I wanted to be able to get these point clouds into the other 3D software I was using, Maya and Unity, but OpenFrameworks was the only program to load and display them in a usable way, so I captured these animations through the ofApp using an Atomos Ninja Flame recorder, and then composited those videos with my other 3D animation into the final video using After Effects.

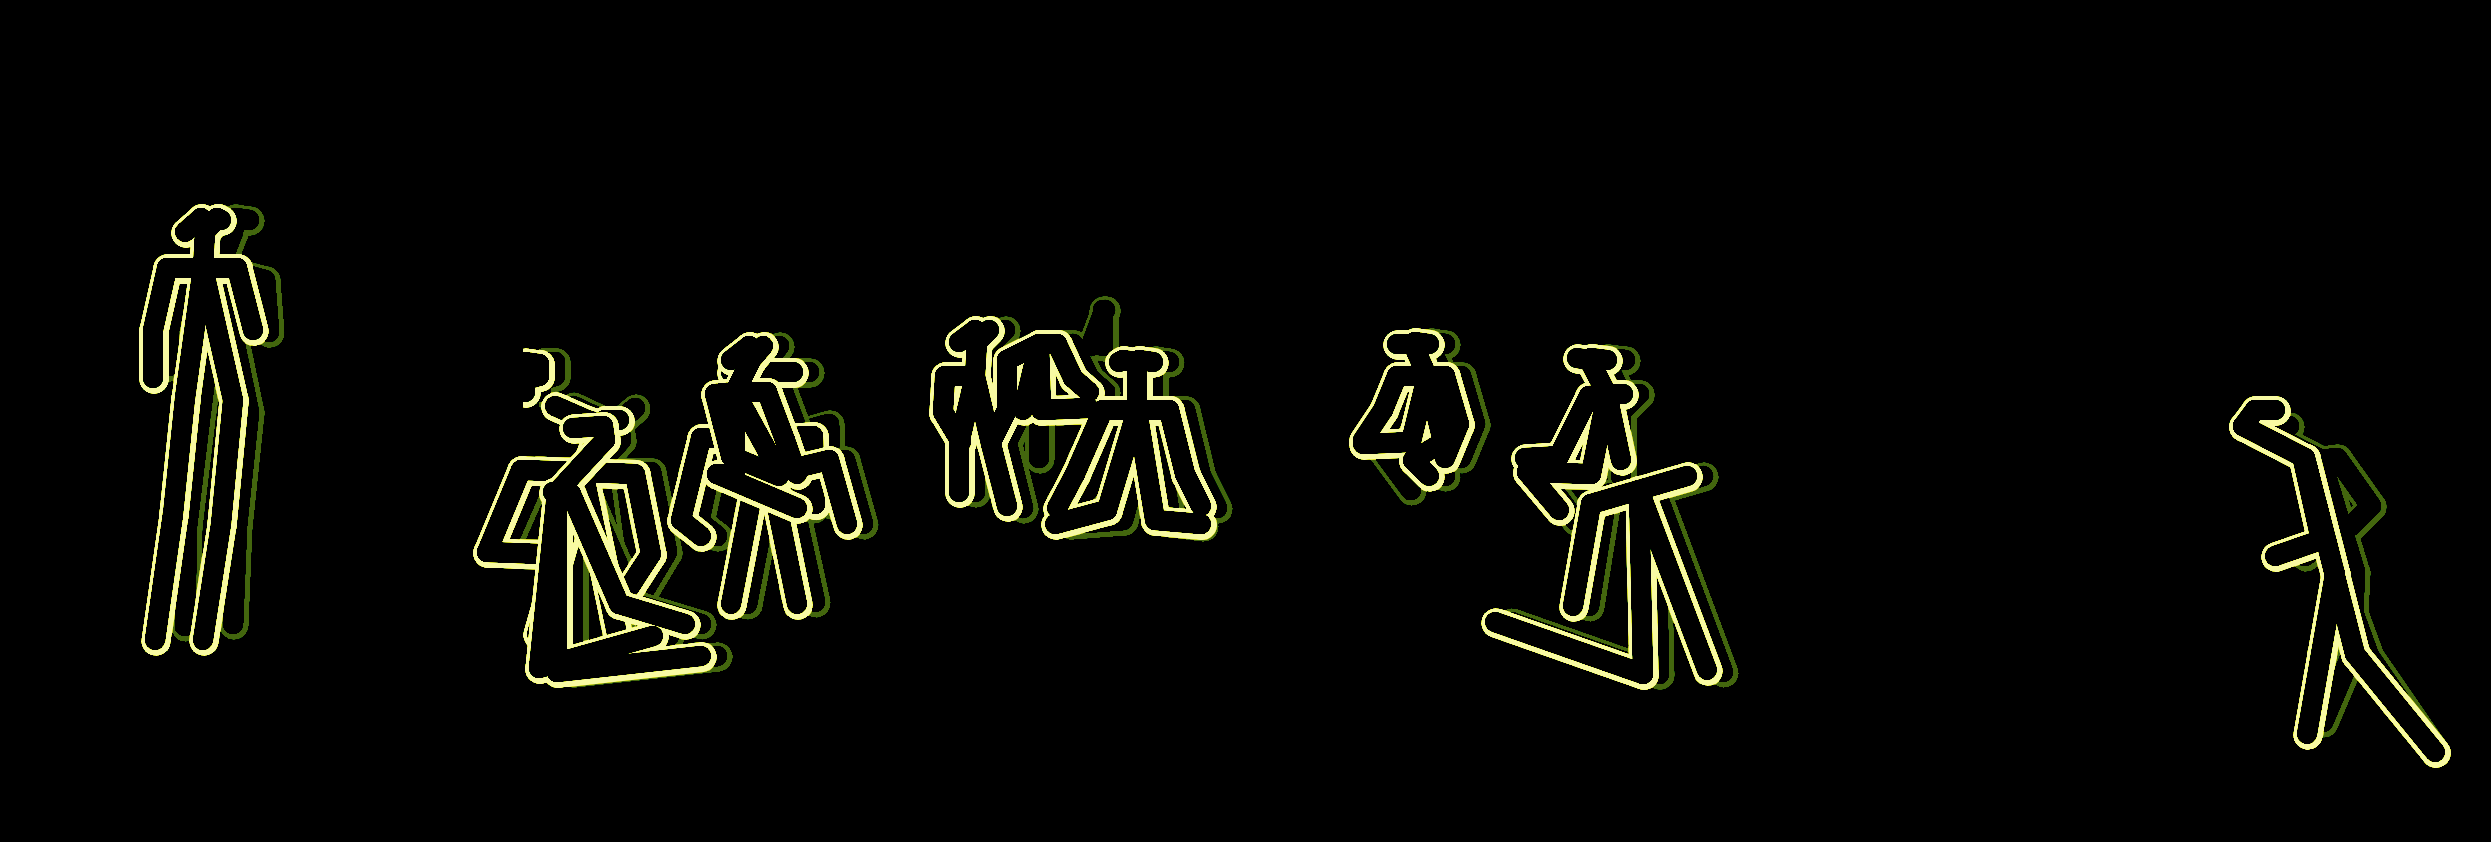
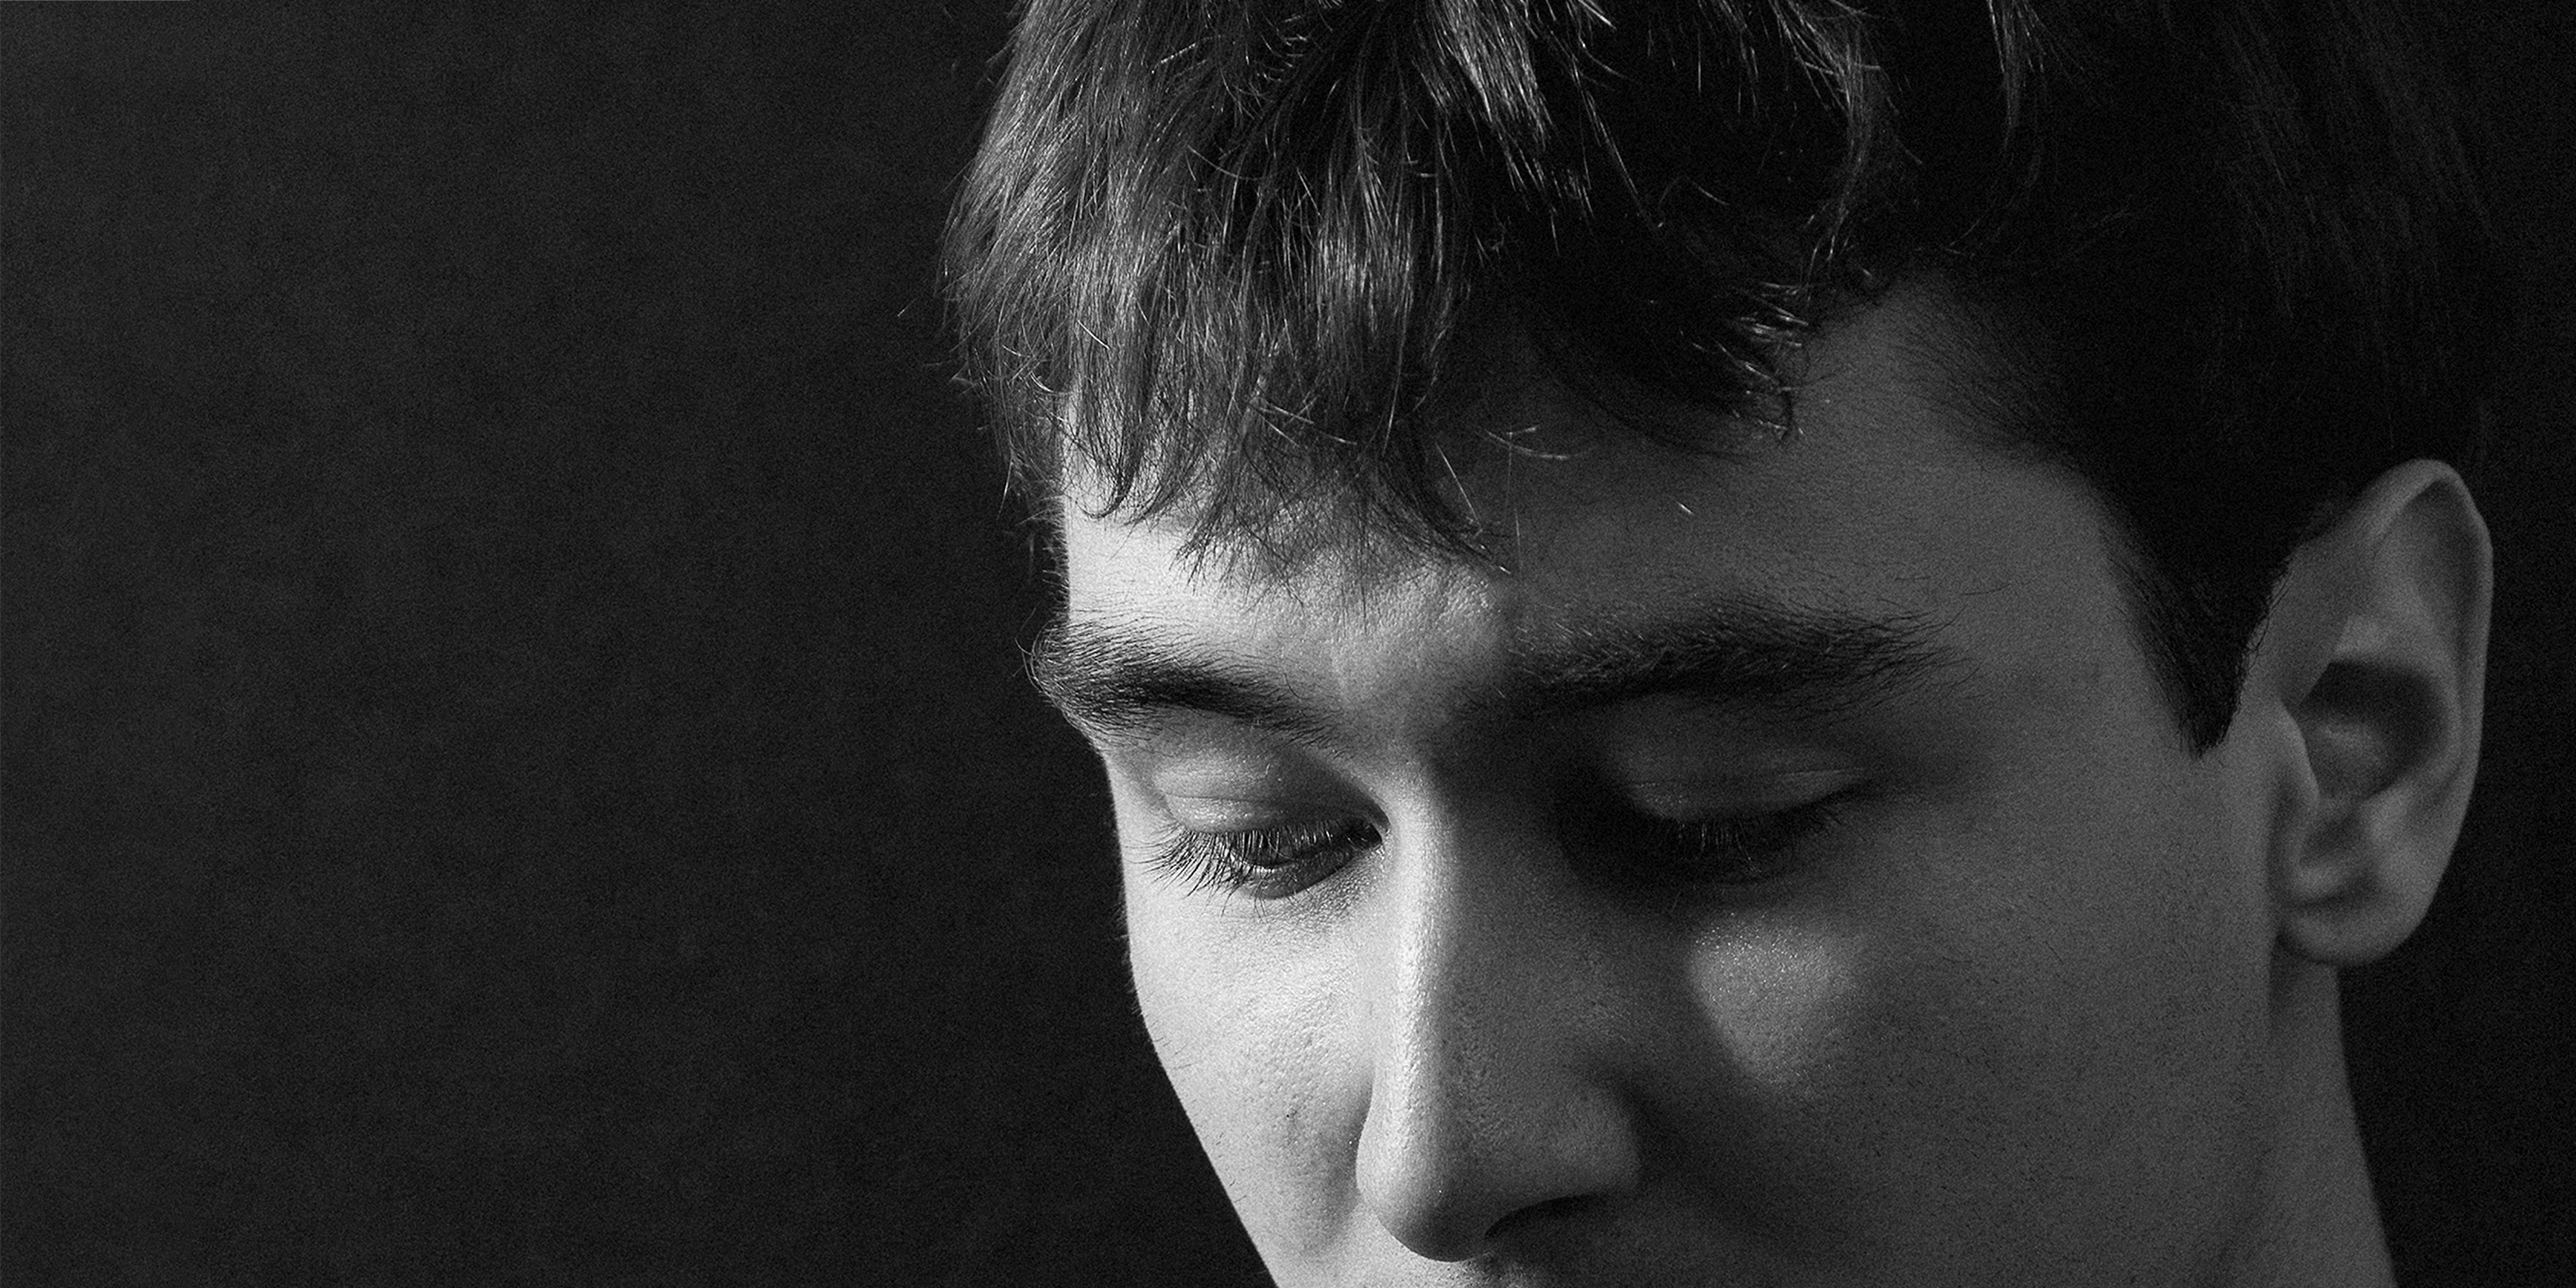
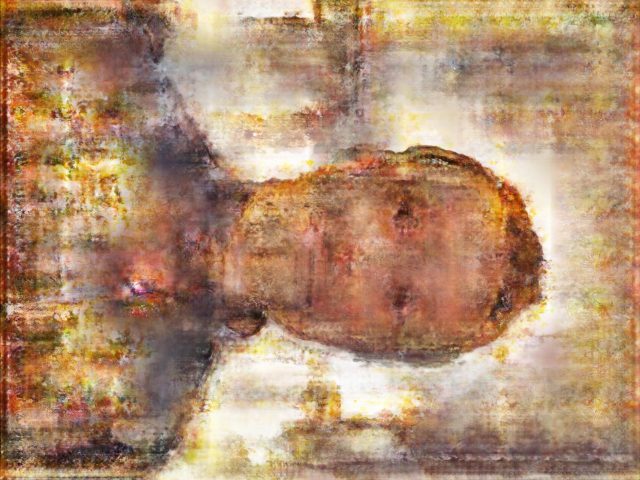
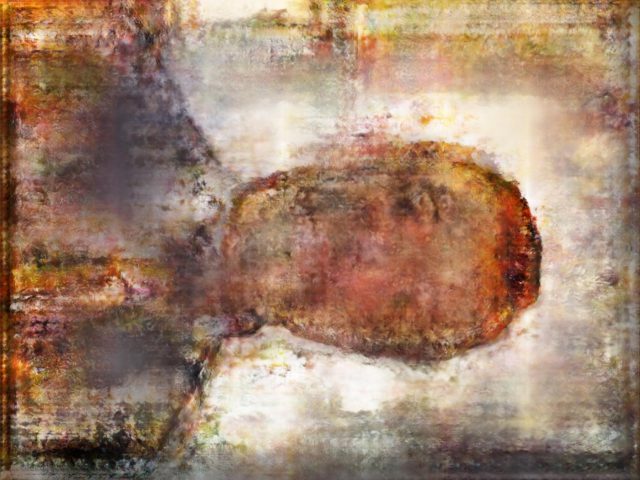
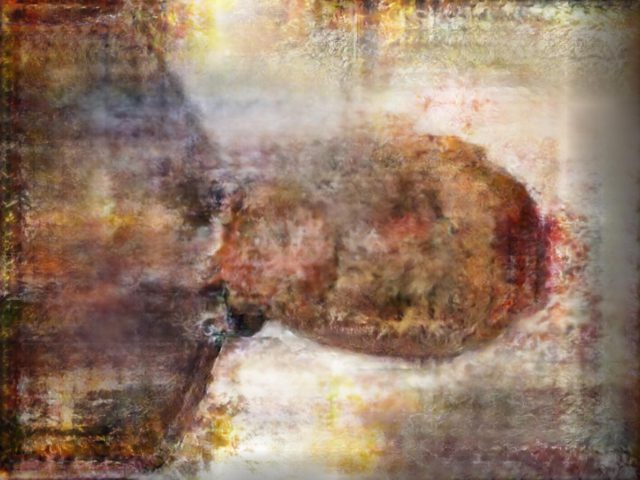
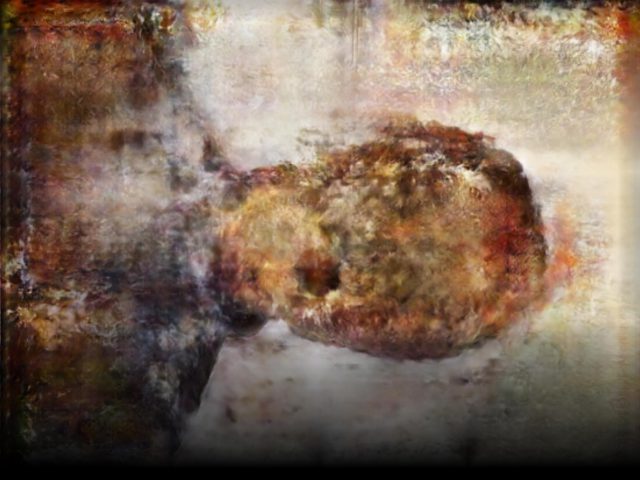
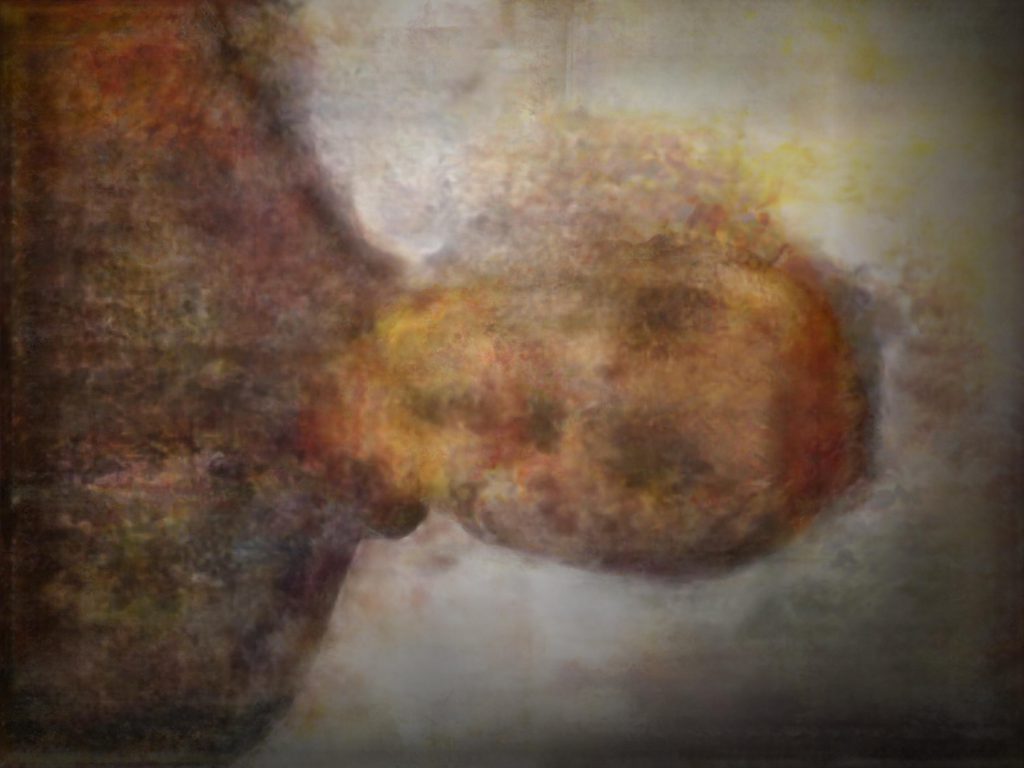
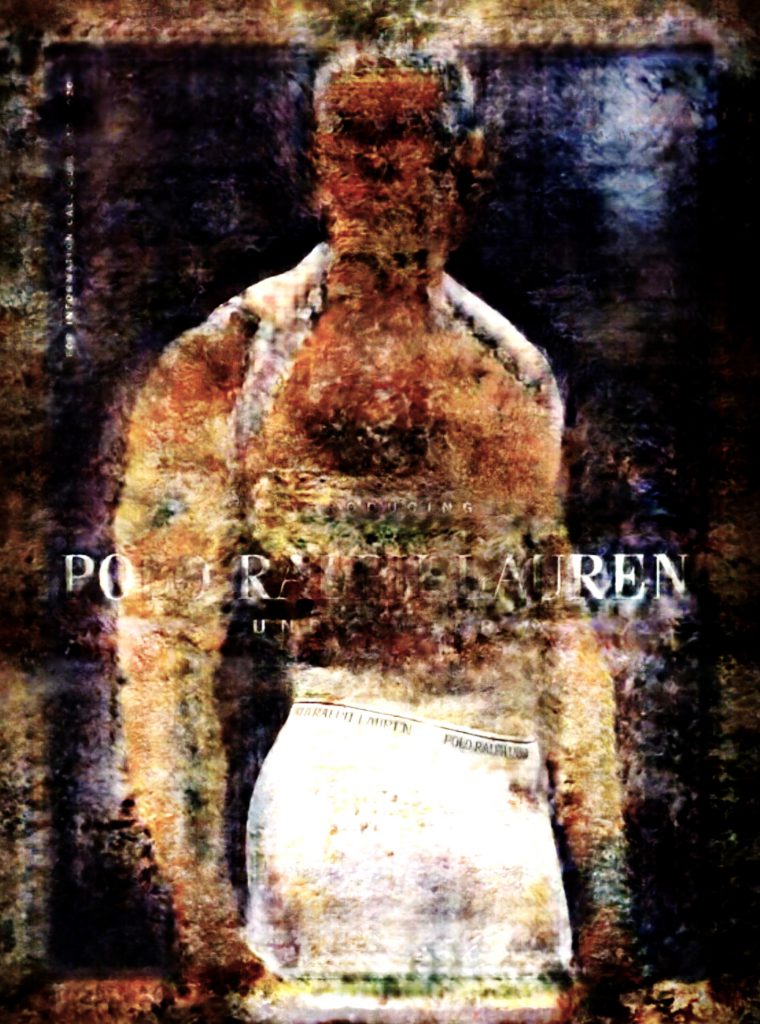
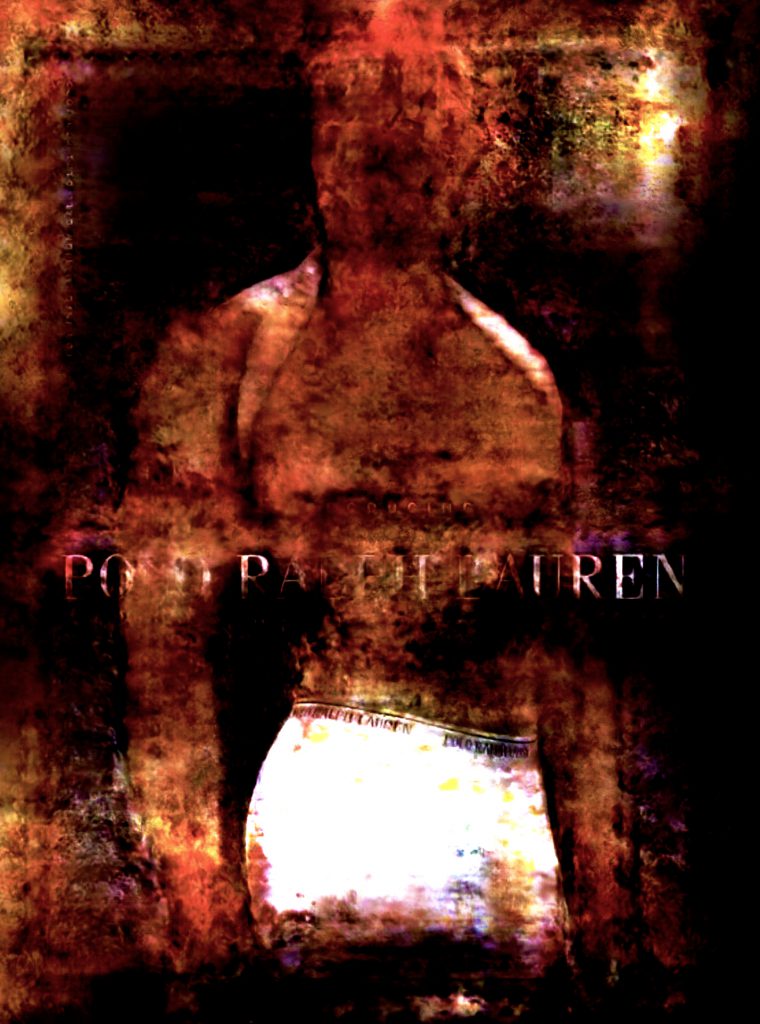
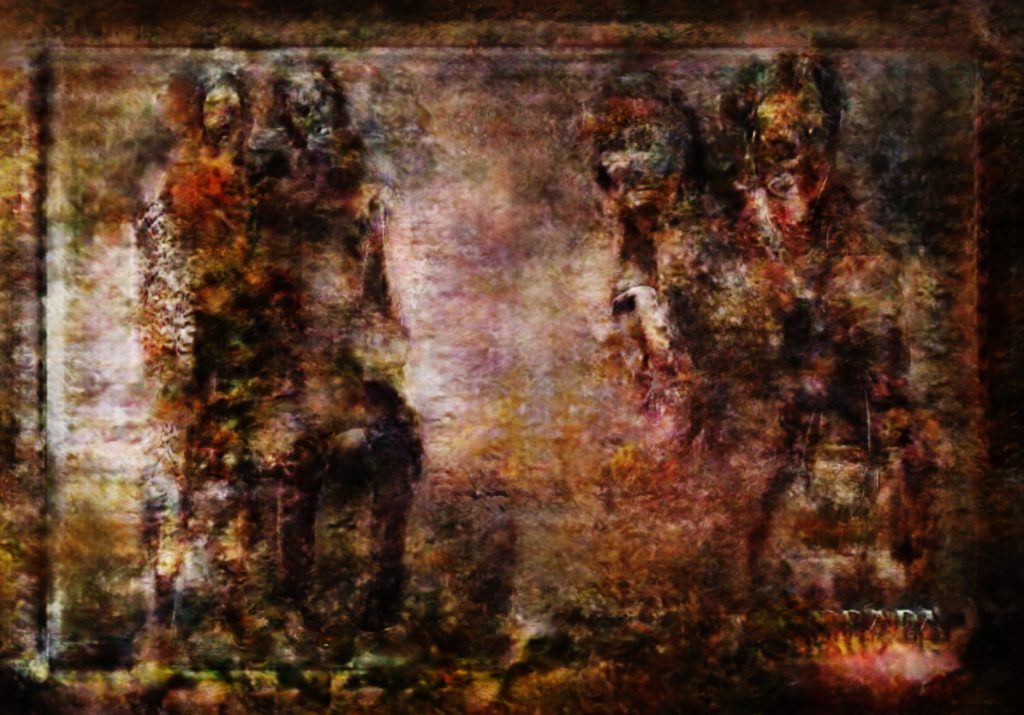
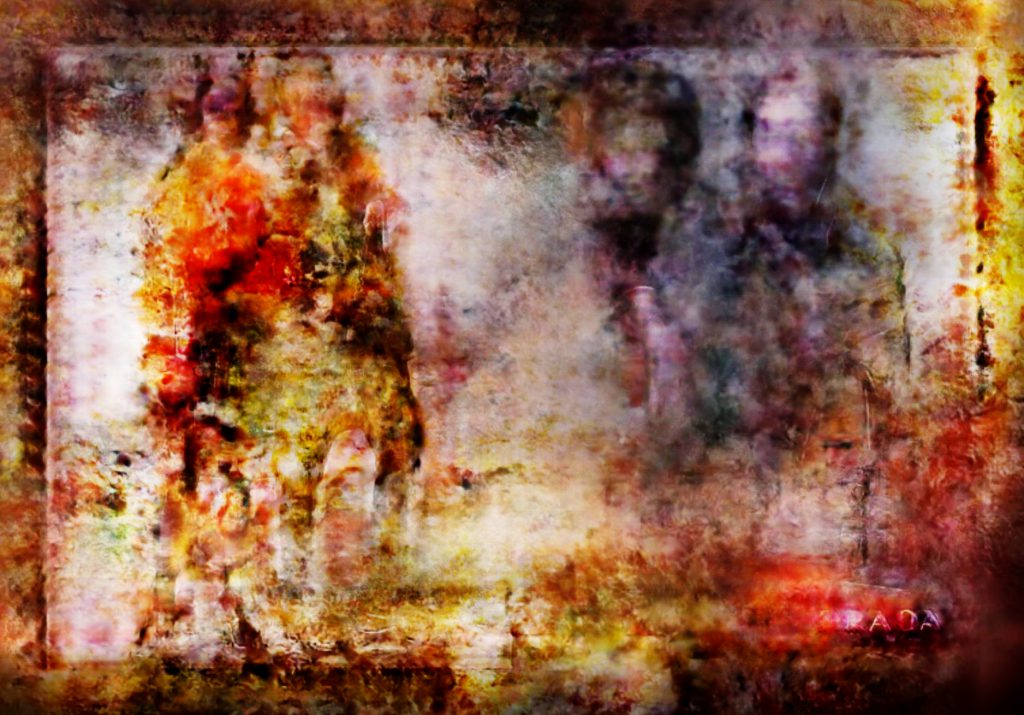
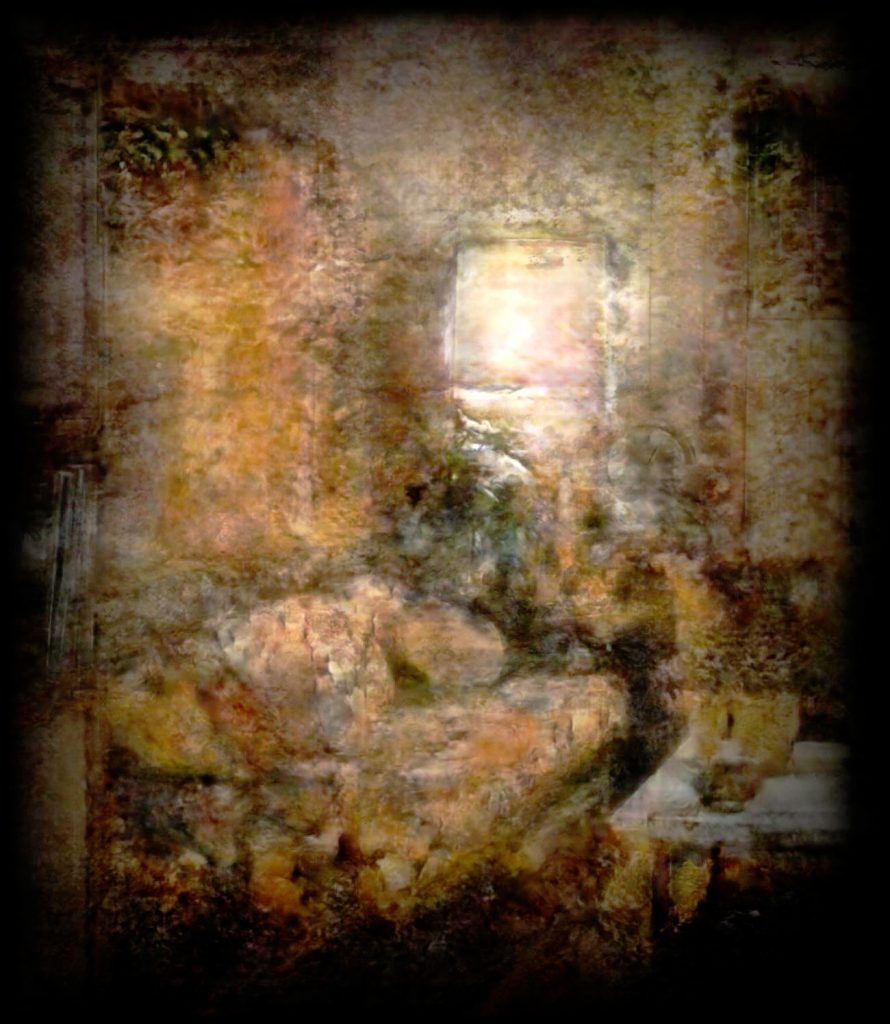
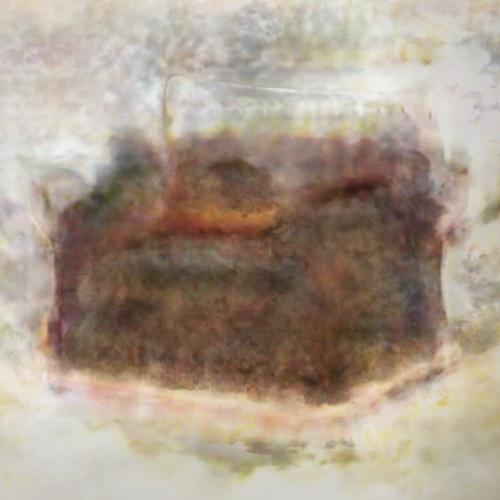
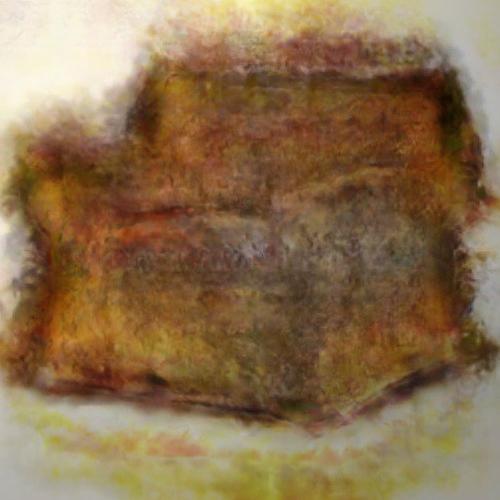
Here’s a gif from the music video:


From the song ‘body, my body‘ music video, by slowdanger, Anna Thompson and Taylor Knight, from the album, body released on MISC Records, 2017.

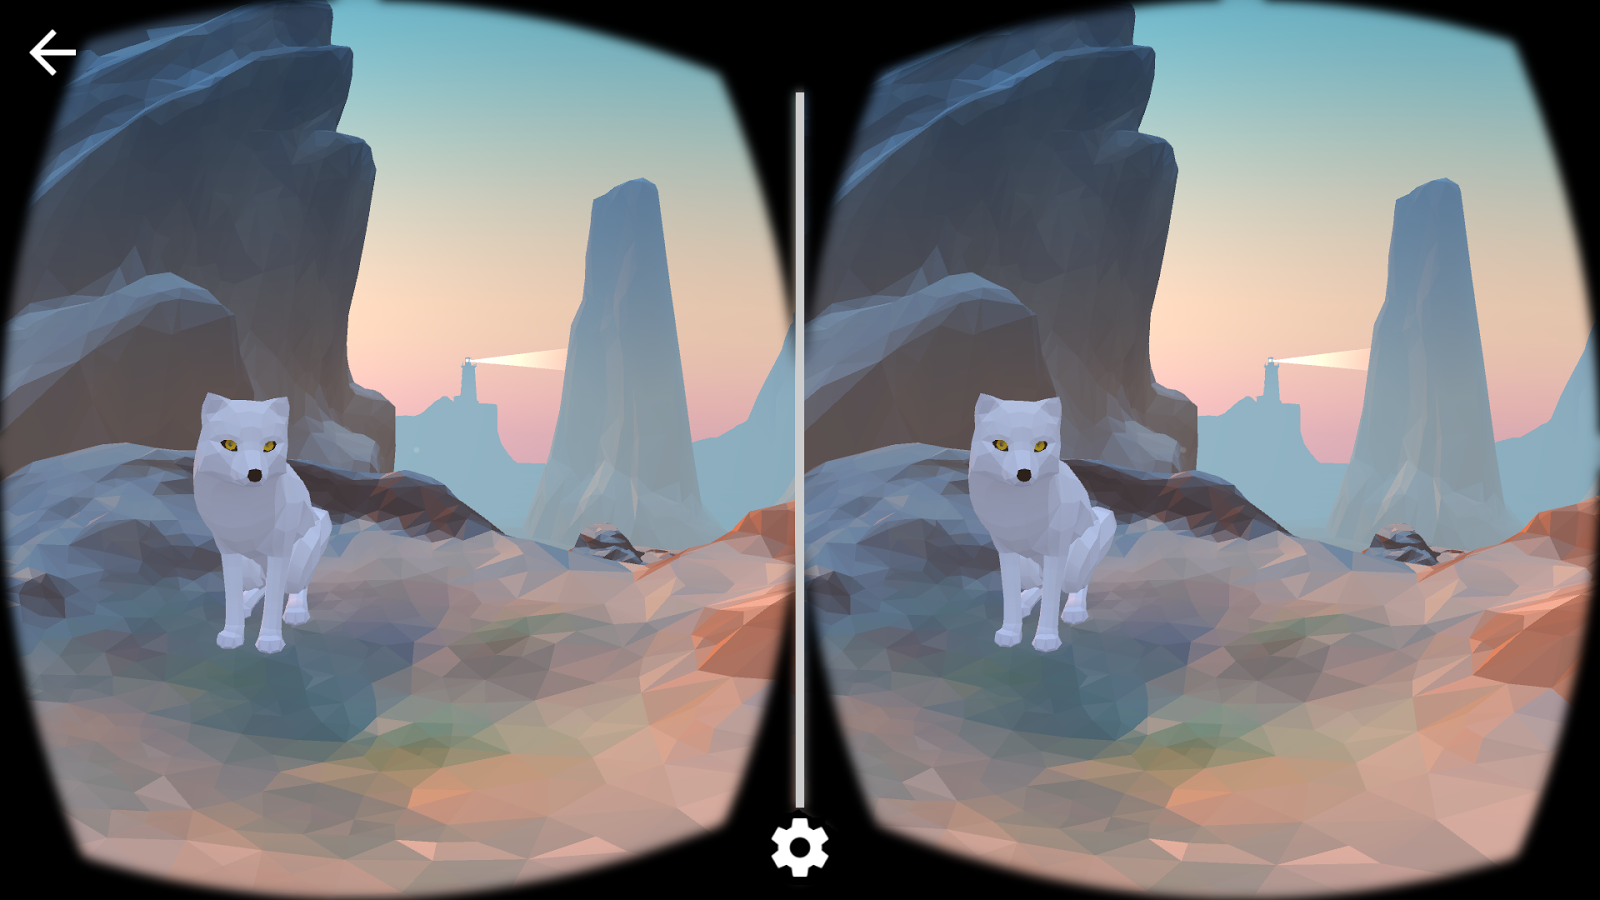
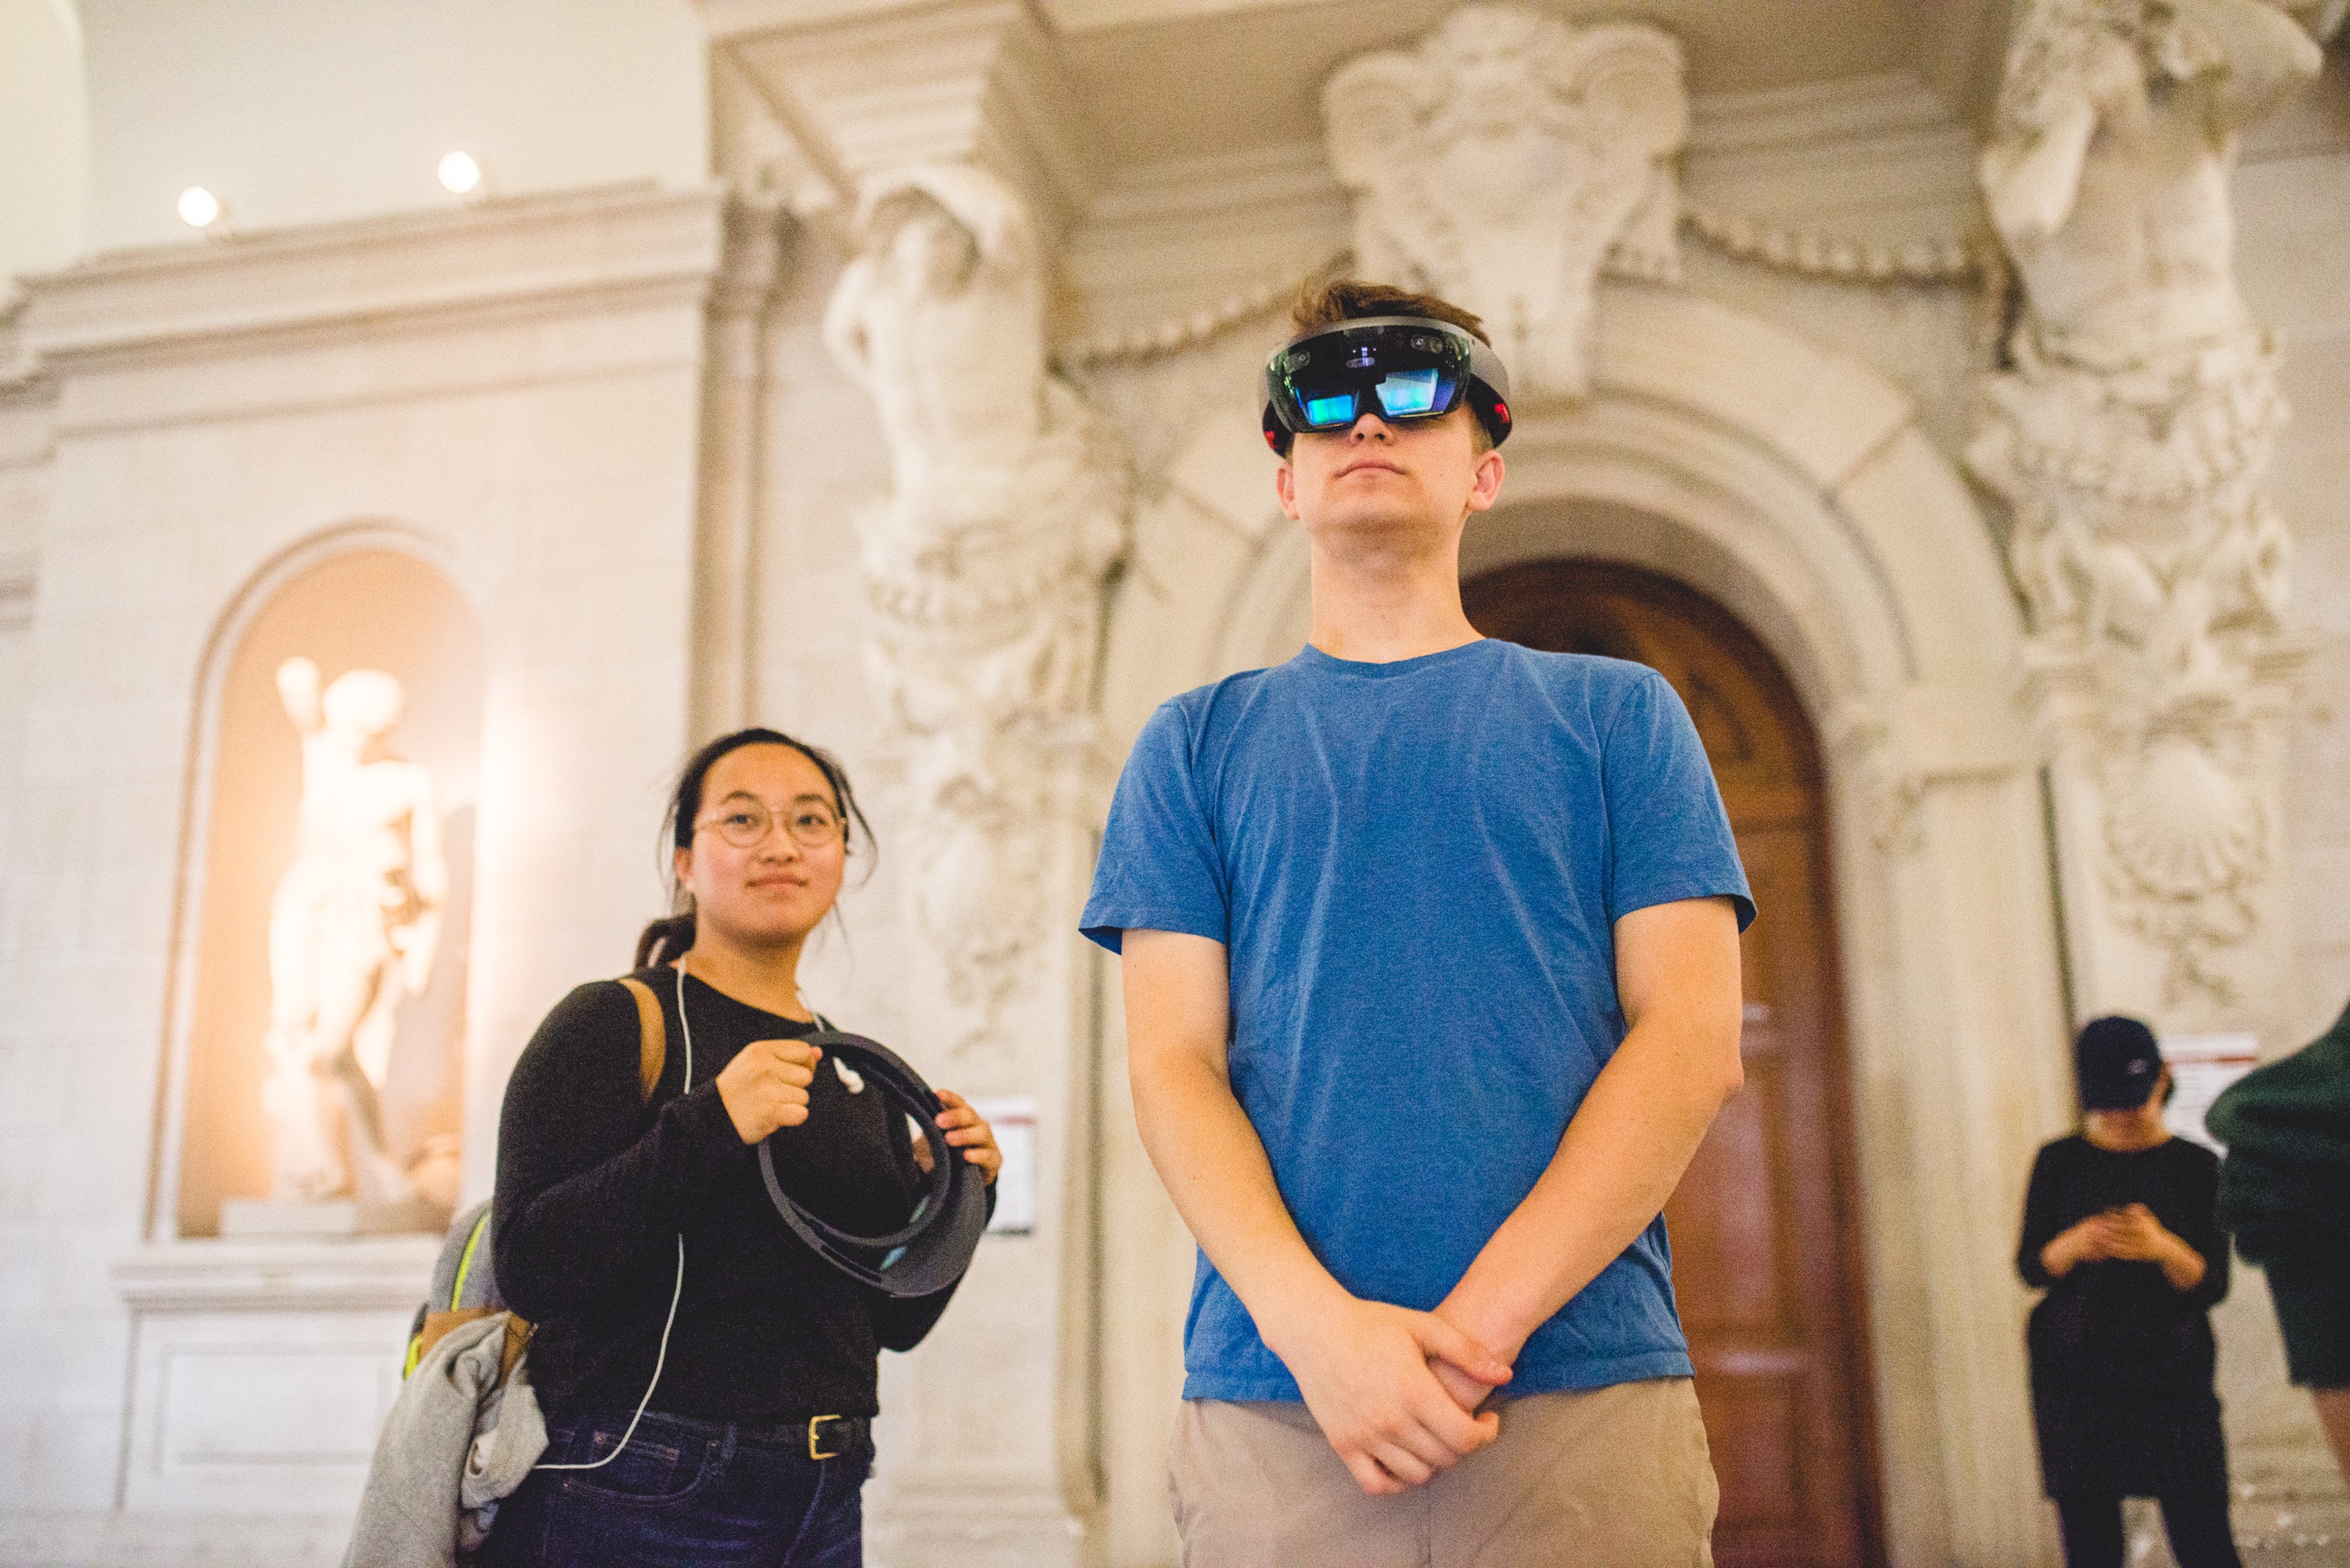
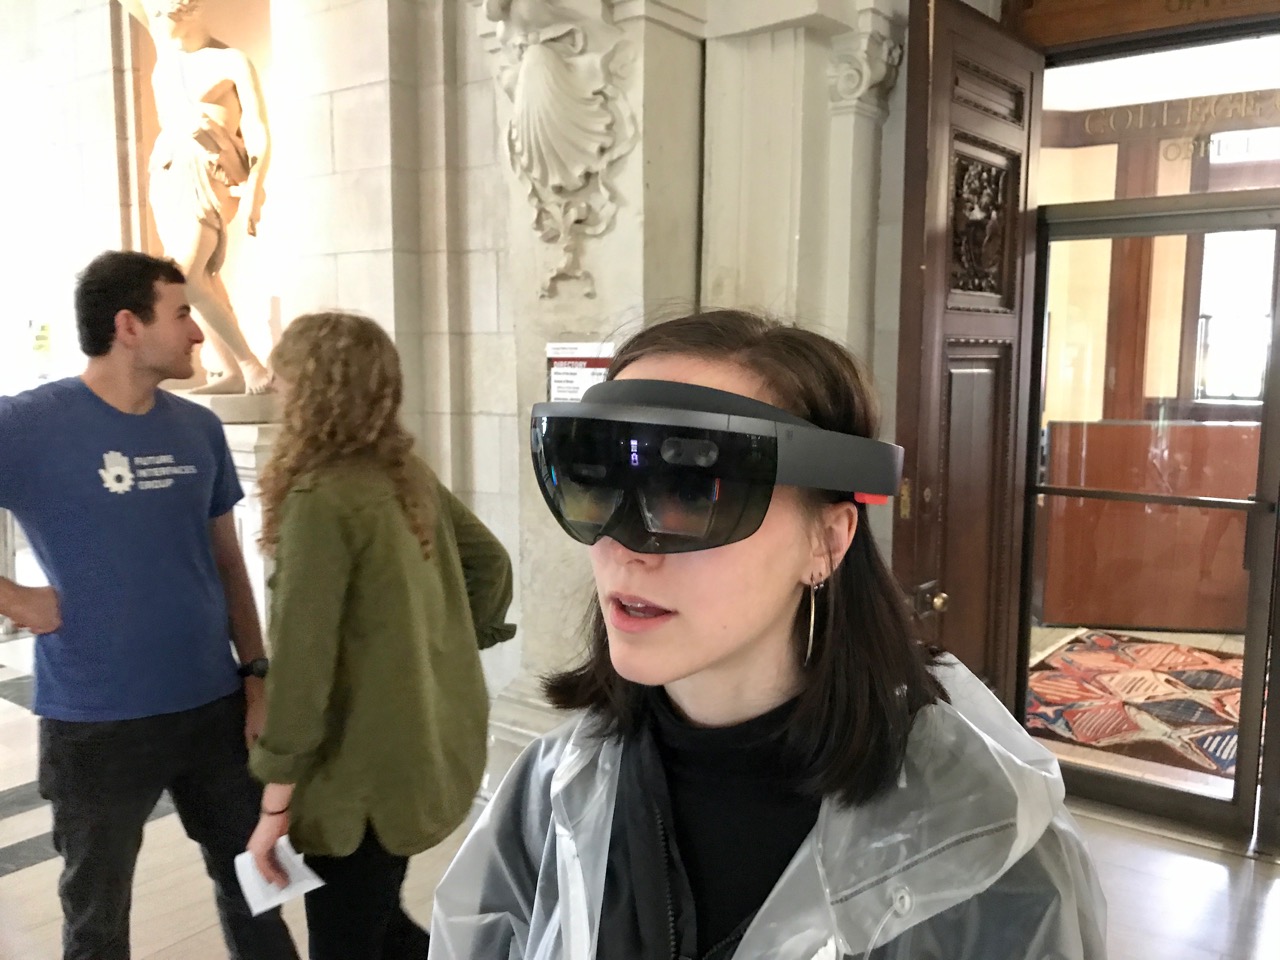
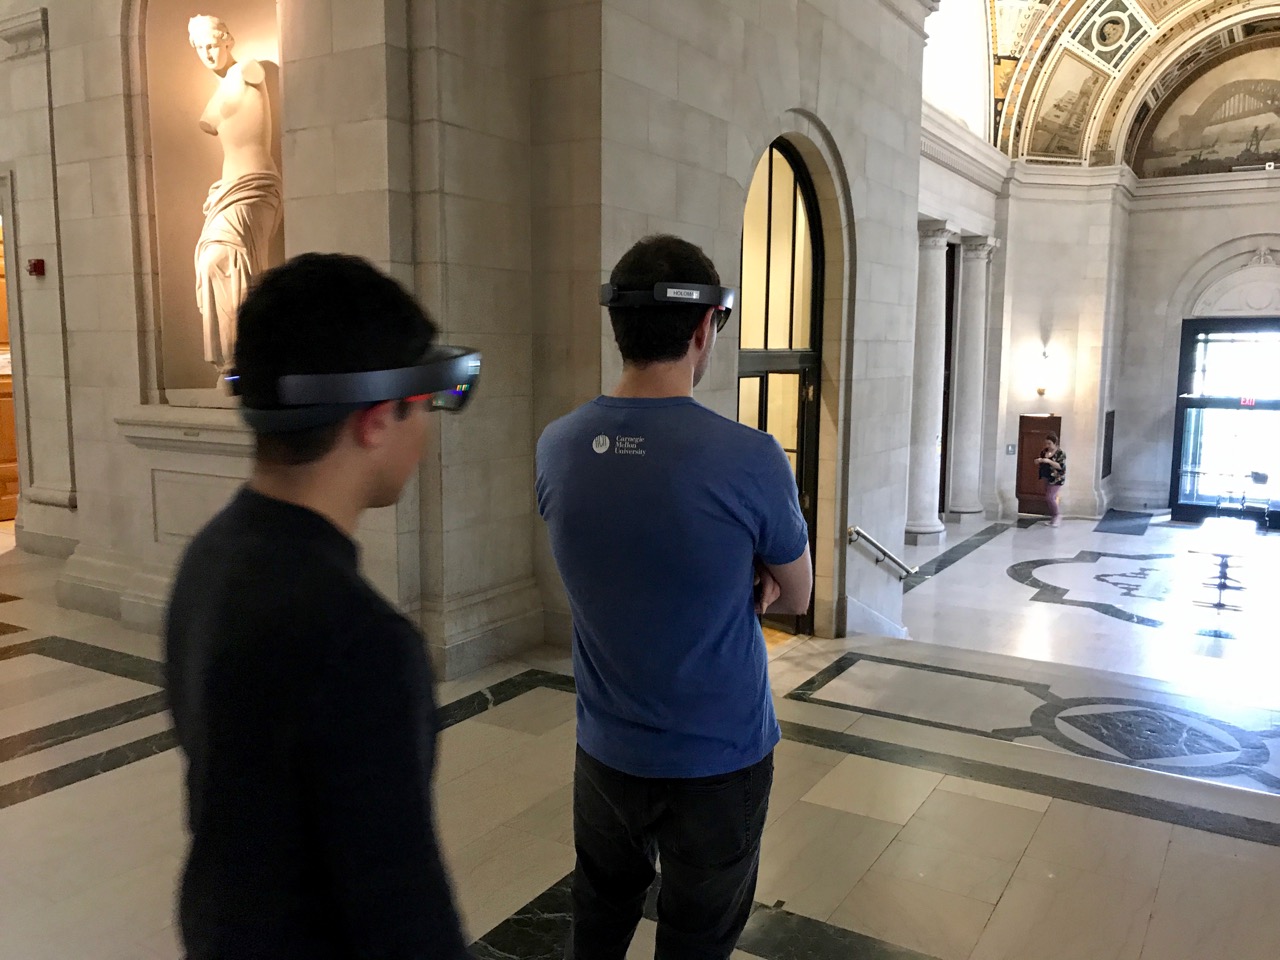
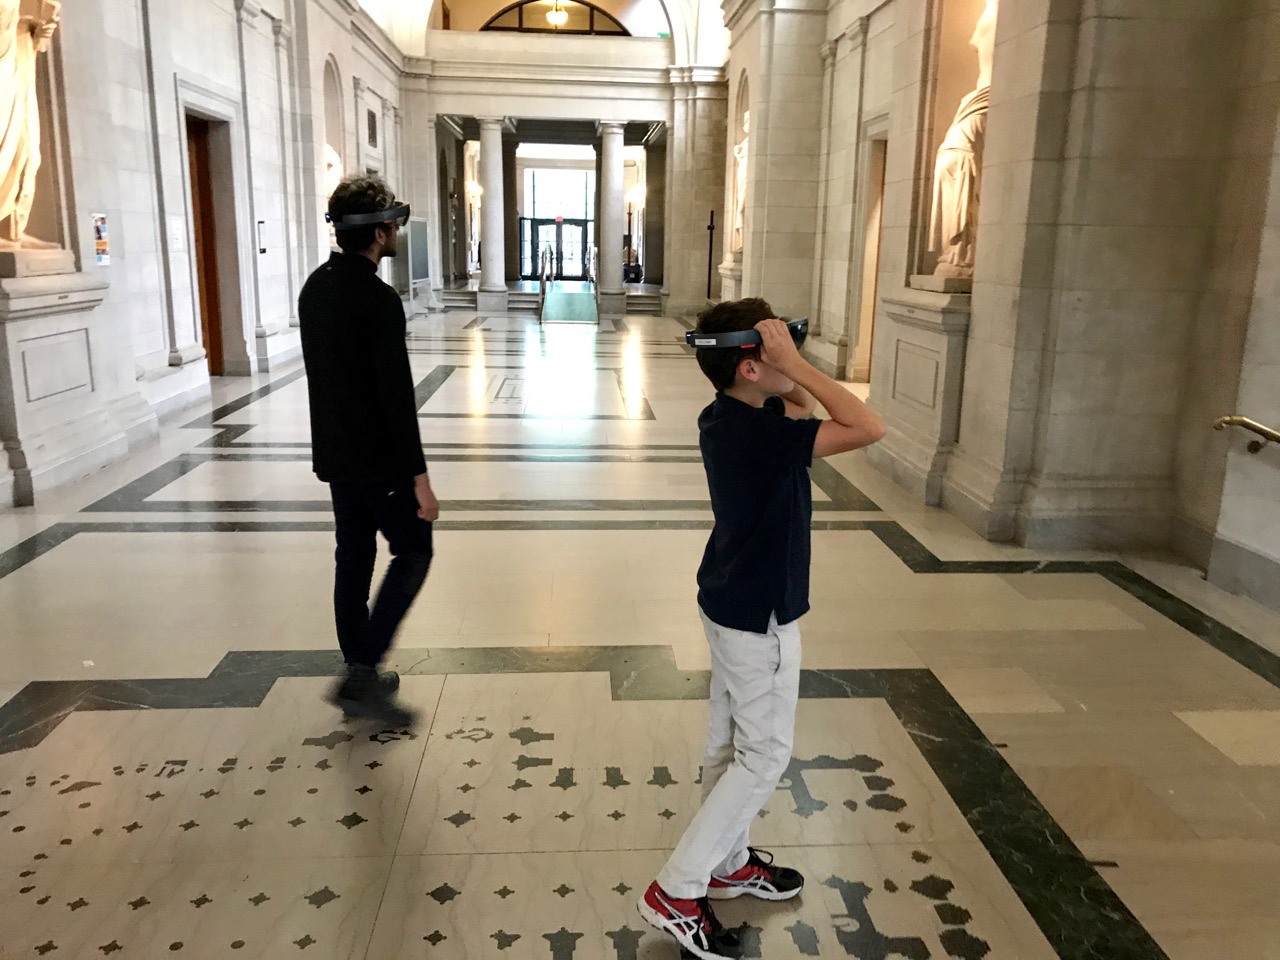
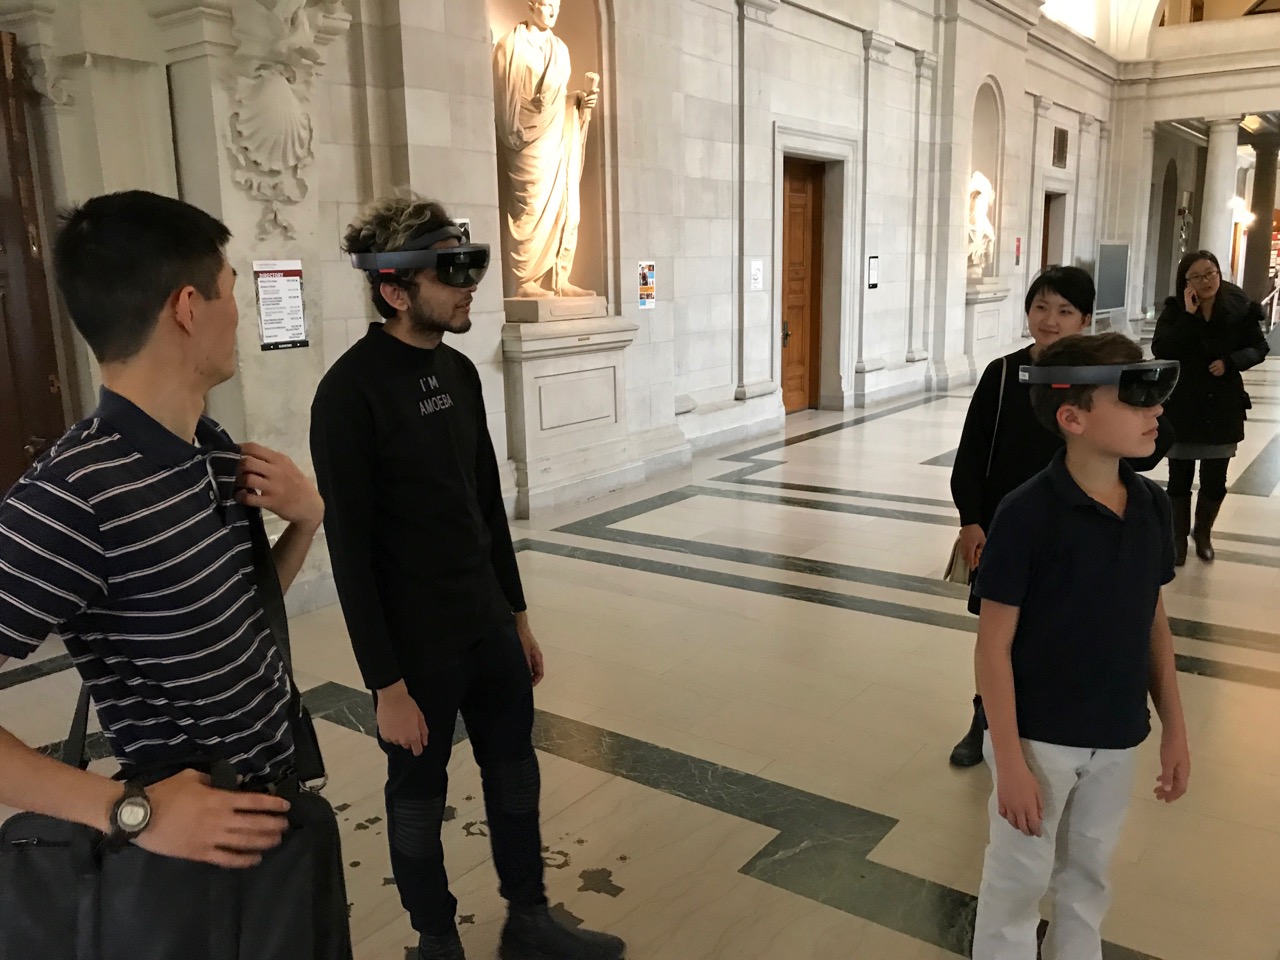
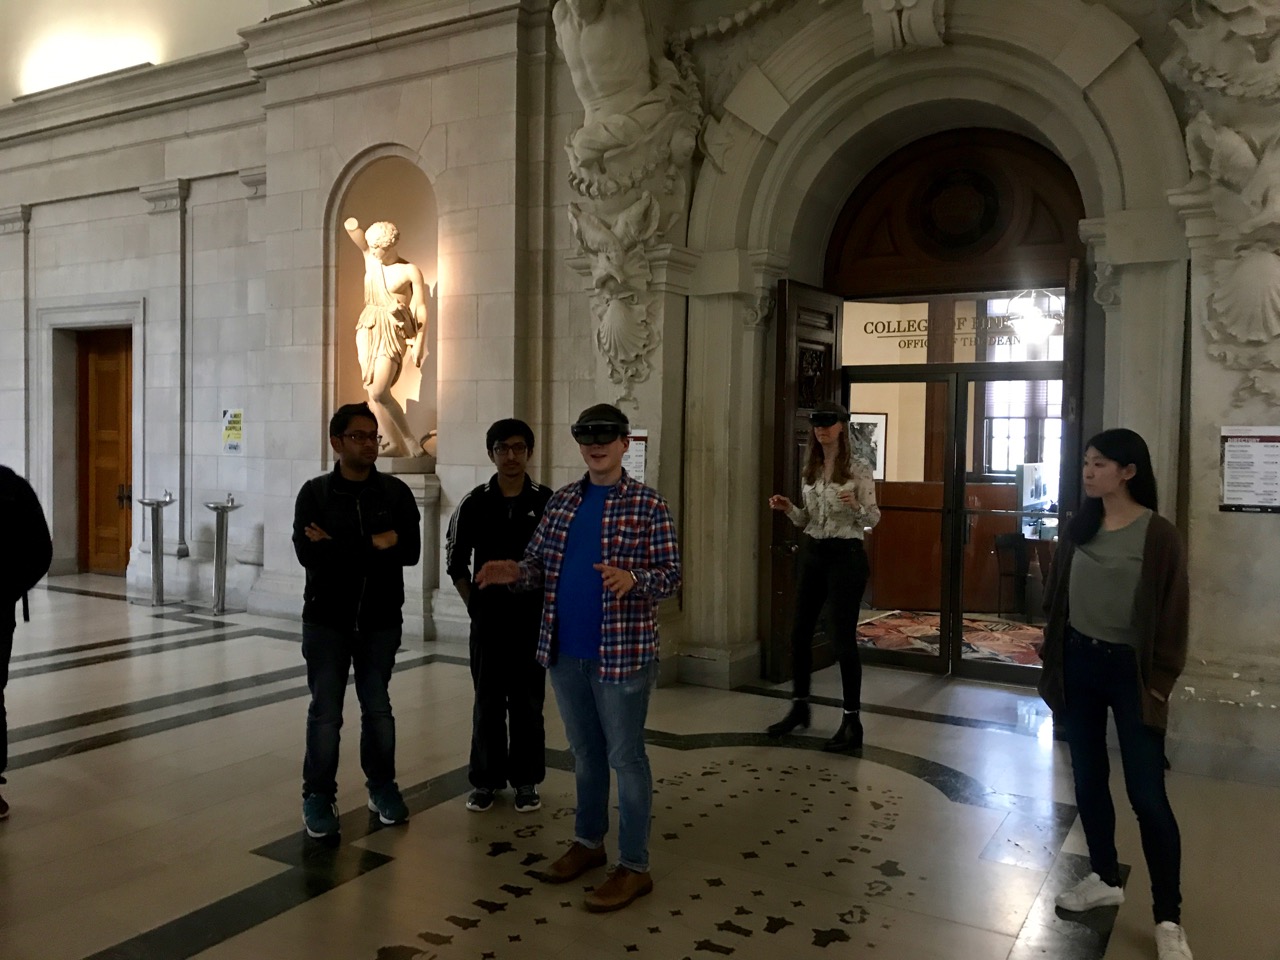
In addition to the music video, I was curious to create an immersive experience of the dance, using VR or AR. I had worked with Unity and Google Cardboard in a previous project for this course, but had not created anything for Oculus or Vive yet, so I decided to dive in and try to make a VR version of the dance for Oculus. For this, I worked with the motion capture data that I captured in the traditional mocap lab, using skeleton/joint rigs. For the figures, I took 3D scans of the dancer’s bodies, a full body scan and a closer head/shoulders scan, and rigged these to the motion capture data using Maya. For the Maya elements of the project, I worked in collaboration with Catherine Luo, as the slowdanger project stretched across two classes, and Catherine was in my group for the other class. She is also fabulous in Maya and very interested in character modeling, so we learned a lot together about rigging, skin weighting, and building usable models from 3D scans. Once we had these rigged models, I was able to import them from Maya into Unity to create an environment for the dancers to exist in (using 3D scans of trees taken with the Skanect Structure Sensor) and to build this project for VR. Witnessing this VR version of the dance, and witnessing others experience this, was extremely fascinating. Putting the dancer in VR allows the user to place themselves right in the middle of this duet, sometimes even passing through the dancers’ bodies (as they did not have colliders). This is something that is usually not possible in dance performances that happen live, so this created a fascinating situation where some users actually started to try to “dance” with the dancers, putting their bodies in similar positions to the dancers, clearly “sensing” a physical connection to them, and other users were occasionally very surprised when a dancer would leap towards them in VR. This created a collision of personal space and virtual space with bodies that straddled the line between the uncanny valley and actual perception as individual, recognizable people because of the 3D scanned texture and real movement captured. The reactions I received were more intense than I expected, and people largely responded physically and emotionally to the piece, saying that the experience was very surreal or more intense because the bodies felt in many ways like real people – there was a sense of intimacy with being so close to the figures (who clearly were unaware of the user). All of this is very fascinating to me, and something I want to play with more. I showed the VR piece to slowdanger themselves, and this is one of the most fascinating observations I’ve been able to have, witnessing the actual people experiencing their motion-captured, 3D scanned avatars in virtual reality. I’m curious what would happen if I was able to put the temporal visualization of the dancers into VR, where the textures changed over time, photographically – so facial expressions would be visible, and thus the texture would not be static as it was with the 3D scan rigged to a mocap skeleton. I’d like to try to work with the point cloud data further to attempt to get it to be compatible with Unity and Maya. I did find a tutorial on Sketchfab that loaded a point cloud into Unity, and was able to get it working, though the point cloud was made of triangles and would have worked better if it was more dense to begin with (to get higher resolution data), and I was not able to work with the scripts to get them to load and display many frames at once, to animate them.

Overall, I am very excited about the possibilities of this material, especially working with 3D scans rather than computer-modeled assets. This creates a very different experience for the user/participant/witness. I plan to work with motion capture further, especially dedicated to creating situations where embodiment is highlighted or explored, and I’d really like to do some experiments in multi-person VR, MR or AR that is affected or triggered by physical contact between people, and other explorations of human experience enmeshed in digital experience.

fatik – final

Pittonkatonk

With the wizard probe with ears, I attended Pittonkatonk on Saturday. The weather was gloomy and cold but a lot of people still came to enjoy the show.

Preparation

Before going to the show there was a lot of preparation involved. I needed to text the kinect out doors to see if it captured anything. I needed to figure out how to hold everything while I was there because of the amount of equipment needed. I had the giant probe stick, my laptop, the generator, and a bunch of charger cables. Beforehand, I swept the pavillion to see if there were any backup outlets and I also made sure to charge everything in advance.


The event

Chloe and I went early to enjoy the event. It was really awesome. The costumes and instruments were so integrated into the crowd. The music was upbeat and the food was good too.

There were a lot of difficulties when it came around to start filming. I charged the generator the entire day before, but it failed on me the night of the event. So the process was to charge it for 5 minutes and move really quickly to where the action was happening. We ran around a lot and worked with our circumstances. The crowd definitely got a lot wilder later into the night.


Final Deliverables

I’m also really upset about the fact that I lost my SD card with all of the sounds I recorded at the event. The week had to much going on and I misplaced it. I really hope it turns up somewhere.

Anyways, I made six short loop films for instagram and made sound loops from pre-recorded music of the band What Cheer? Some loops are better than others. I made two videos that don’t loop that encapsulate the crowd of this event.

My instagram account: https://www.instagram.com/fk.3458/

I also played with different colored backgrounds but stuck with black because it had the highest contrast and the subtle colors showed the best. There’s a lot of white because there were heavy lights under the roof at night.


Gifs and other Fun things


Stills


a — final

Superboneworld

A system transcribing people into skeletons, hanging out.

screenshot from superboneworld, yellow stick figures in various poses, sitting, standing, walking, on a black background

?

Superboneworld is a system that extracts and visualises human pose-skeletons†† from video. This extracted information is then displayed in a scrolling, ticker-like format on a 4:1 display. As Superboneworld scrolls past us, we see different strands of human activity — dancing, walking, yoga, pole dancing, parkour, running, talent-showing — overlaid, combined and juxtaposed. When we reach the end of the pose-ticker, we loop back to the start, seeing the next slice of Superboneworld†††.

I wanted to explore the commonalities and contrasts within and across certain forms of human movement. I was interested in putting in one 'world' myriad different people moving about in myriad different ways.

The capture system consisted of a neural network, the same one as the one used in pose-world, that extracts4 pose information from video.

This system was fed a large number of videos ripped from the internet, ranging in 0.5-10 minutes in length.

This gave me frame-by-frame knowledge5 of the poses of people within the video. I then visualise this by drawing all the pose information I have for all of the skeletons (i.e, in the above image, the missing left forearm of the leftmost skeleton (most likely) means that the neural network was unable to recognise it from the image.

Each video stays static relative to Superboneworld (we are moving across it), so each video produces a Bonecommunity of skeletons moving around over time, i.e a 'pose-video'. Certain Bonecommunities are drawn in a different colour because it looked nicer that way. As a Bonecommunity scrolls out of view, it is frozen in time till we get round to it again.

notes

significant portion of credit for name goes to claire hentschker

†† a pose-skeleton is a 'skeleton' that describes the pose of a person, such as where their joints are located and how to connect those joints up to reconstruct their pose

††† the 'pose-videos' ('Bonecommunity') only play when they are being displayed — after we have scrolled past one, the skeletons are frozen till it next comes back round, so each time we go around Superboneworld, we see a little more of each little 'Bonecommunity'

4 given an image containing people, it tells me where the limbs are located (within the image), and which limbs belong to which people.

5 the computer's best guess

process !

neural

I first experimented with this neural network system for my event project, pose flatland (open sourced as pose-world).

The structure of the neural network did not change much from pose flatland, the primary changes being me optimising it to run faster while I was thinking about what to actually capture. The optimisation mostly consisted of moving calculations from the CPU (previously using OpenCV) to be done on the GPU by translating them into PyTorch.

I also modified the system such that it could process and produce arbitrarily large output without having to resize images to be small and square.

After getting to a state where I could reasonably process a lot of videos in a short amount of time (each frame took ~0.08 to 0.2 seconds to process, so each video takes 2-10x its length to process, depending on the number of computer-confusing people-like things in it and number of people in it).

I first experimented with parkour videos, and how to arrange them. At this stage, the viewpoint was static and pose-videos were overlaid, which was initially confusing and all-over-the-place to look at.

After striking upon the idea to use the superlong 4:1 display lying around the STUDIO, I also decided to directly to more directly interrogate the expression in videos on the internet. Before this, I was unsure if moving on from the live webcams (as used in pose flatland was a good idea, but after seeing a number of outputs from various popular trap music videos, I was convinced that it was a good idea to move in the direction of using videos on the internet.

The majority of the videos I used could be considered 'pop-culture', for some value of 'culture' & 'pop' — they were mostly all popular within the genres they embodied. For instance, one of the videos is the music video for Migos' seminal track Bad and Bougee, and another is the very important 21 Savage/Metro Boomin track X. For the videos from genres that I am less knowledgeable about, such as parkour or yoga, I choose videos that would generally showed most of people's bodies most of the time, and were somewhat popular on Youtube.

As a refresher, here is the output of the neural network directly drawn atop the image that was processed:

Here are some images for the earlier, parkour iterations:

Note the various flips and flying around:

I realised by pressing Ctrl-Alt-Cmd-8 I could significantly improve the quality of the media artifact by inverting my screen:

media object

After downloading and processing the videos, I set about arranging them. I mostly did this blind, by writing a JSON file describing where each 'pose-video' should be placed on Superboneworld. I then wrote a small p5js script that downloaded the pose-video, placed it in the correct location (for most of them, initially far, far offscreen), and then slowly scrolled across Superboneworld, taking care to pause and unpause the Bonecommunities as they came into view.

Whilst building this visualisation, I realised that they would look better drawn as blobs rather than stick figures, as they have significantly more dimensionality, and their ordering atop each other (a Bonecommunity has a z-ordering).

After this, I loaded up a webpage containing the p5js script, plugged my computer into the 4:1 screen in the STUDIO, and showed it.

Here is an image from the exhibition:

Here are some GIFs:

similar work made in the past

Golan Levin's Ghost Pole Propogator is the most visually and conceptually similar project, although I did not really notice the similarity till after making pose flatland.
Here is the best documentation of it I could find:

source code

The neural network modifications and javascript visualisers have been merged into pose-world. Look at it for instructions for how to process your own video.

The piece is available to be viewed at bad-data.com/superboneworld. It streams ~100 mb of data to your computer, so it may be a little slow to load. However, after loading it caches all the downloaded data so subsequent runs are fast.

thanks to:

  • Claire Hentschker for significant help in the conceptual development of this project
  • Zhe Cao, Tomas Simon, Shih-En Wei, Yaser Sheikh, for doing the research and releasing an implementation that made this possible
  • tensorboy for the re-implementation of the above research in an easy to extend way
  • All the other artists in Experimental Capture who thought this project was cool and helped me make it better
  • &
  • Golan Levin for this class!

Quan—Final

For this final project, Bernie and I decided to tackle cinematography with the robot arm, a step beyond attaching the light. In the end, we created two single-path, multiple-subject clips.

The robot arm operates on a waypoint system, set manually.  Waypoints are the positional and directional points through which the camera travels. Once set, the operator then sets the speed the robot moves at, and how smooth the motion is (blending between waypoints).

We initially had a steroscopic setup on the arm, to capture video with depth.

However, we soon realized that our setup afforded a fixed convergence angle between the two cameras. This meant that either the subject had to be always a fixed distance away from the cameras, or the video would be at a permanent cross-eyed state. Because we were low on time, and these constraints were too stifling, we ditched the second camera and moved on.

As you can see, the video doesn’t converge properly as it should, because the cameras were not dynamically converging and diverging at different distances.

During this project, Bernie and I got a hold of the Olympus 14-42mm lens, which has electronic focus and electronic zooming capabilities. So now we had computational control over all camera elements simultaneously—camera position, direction, aperture, shutter angle, ISO, focus, and zoom. We had created a functional filming machine.

A beautiful aspect of the robot arm is the capability for the path to be replicated. Once we set a series of waypoints, the robot arm can travel in an identical way over and over, as many times as we want.

These are four subjects filmed in the exact same way (path, light, zoom, position).

With this repeatability, we are able to have interesting transitions and combinations between clips. We explored two different methods: splicing and positional cuts.

This is an example of a spliced video.

Since all four subjects are all filmed in the same way, they should be perfectly aligned the whole time, but they are not. This is due to human difference, which gets worse and worse as the video goes on.

This is an example of a positional cut.

As long as the paths are aligned, the cut should have an interesting continuity, even with a different subject.

Here are our final videos.

BODIES from Soonho Kwon on Vimeo.

Temporary Video (not final)—

Faces from Soonho Kwon on Vimeo.

hizlik- Final

Update: As of 2020, an updated documentation for this project is now on my website at hiz.al/carscanner.

Little Car Scanning Underbellies of Big Cars

This little car is equipped with a line laser ($10 on Adafruit), a GoPro and an Arduino Uno.

When driven via remote control underneath vehicles at a constant rate of speed, capturing footage at 60fps, I am able to get an accurate reading of an approximately 1ft wide space of the underside of a vehicle, to be parsed into point-cloud data and eventually a 3D-printable model.

After experimenting with Photoshop and After Effects color-matching filters, I decided to write my own processing script to extract the laser’s path in the footage. I discovered it works best with footage shot in the dark, because it provided the cleanest and brightest result.

My script essentially tries to find the brightest and reddest color per column of pixels in the video. I also use averaging and other threshold values to “clean” unwanted data.


Processing: Analyze images for red laser path

String path = "/path/to/car/frames";
File dir; 
File [] files;
//int f_index = 0;
PImage img;
//PVector[] points;
PVector[][] allpoints;
PVector[][] cleanpoints;
float[] frameAvgs;
float threshold = 30; // minimum red brightness
float spectrum = 75; // maximum distance from median

boolean debug = true;
boolean clean = false;
boolean pause = false;

int frame = 0;

void setup() {
  size(1280, 720, P3D);
  dir= new File(dataPath(path));
  println(dir);
  files= dir.listFiles();
  //points = new PVector[1280];
  allpoints = new PVector[files.length][1280];
  cleanpoints = new PVector[files.length][1280];
  frameAvgs = new float[files.length];
  convert();
  
  frameRate(30);
}

void convert() {
  for (int f_index = 0; f_index<files.length; f_index++) {
    String f = files[f_index].getAbsolutePath();
    PVector points[] = new PVector[1280];
    PVector fullpoints[] = new PVector[1280];
    while (!f.toLowerCase().endsWith(".jpg")) {
      f_index = (f_index + 1)%files.length;
      f = files[f_index].getAbsolutePath();
    }
    //text(f, 10, 30);

    img = loadImage(f);

    for (int x=0; x<img.width; x++) {
      PVector p = new PVector(x, 0, 0);
      float red = 0;
      float total = 0;
      for (int y=0; y<img.height; y++) { color c = img.get(x, y); if (red(c) > red && red(c) + green(c) + blue(c) > total) {
          red = red(c);
          total = red(c) + green(c) + blue(c);
          p.y = y;
        }
      }
      // check red threshold
      fullpoints[x] = p;
      if (red < threshold) {
        p = null;
      }
      points[x] = p;
    }

    // remove outliers from center
    float avg = pass1(points);
    frameAvgs[f_index] = avg;

    // remove outliers from median
    pass2(avg, points);

    allpoints[f_index] = fullpoints;
    cleanpoints[f_index] = points;
  }
}

void draw() { 
  if (!pause) {
    background(0);
    frame = (frame + 1)%files.length;
    String f = files[frame].getAbsolutePath();
    while (!f.toLowerCase().endsWith(".jpg")) {
      frame = (frame + 1)%files.length;
      f = files[frame].getAbsolutePath();
    }
    text(f, 10, 30);
    drawLinesFast();
  }
}

public static float median(float[] m) {
  int middle = m.length/2;
  if (m.length%2 == 1) {
    return m[middle];
  } else {
    return (m[middle-1] + m[middle]) / 2.0;
  }
}

public static float mean(float[] m) {
  float sum = 0;
  for (int i = 0; i < m.length; i++) {
    sum += m[i];
  }
  return sum / m.length;
}

void keyPressed() {
  if (key == 'p') {
    pause = !pause;
  } else {
    debug = !debug;
    clean = !clean;
  }
}

// returns avg of points within the center
float pass1(PVector[] points) {
  float center = height/2-50;
  float sum = 0;
  int pointCount = 0;
  for (int i=0; i<points.length; i++) {
    if (points[i] != null && 
      (points[i].y < center+spectrum*2 && points[i].y > center-spectrum*2)) {
      sum += points[i].y;
      pointCount ++;
    }
  }

  return sum / pointCount;
}

void pass2(float avg, PVector[] points) {
  //float median = median(sort(depthValsCleaned));
  for (int i=0; i<points.length; i++) { if (points[i] != null && (points[i].y >= avg+spectrum
      || points[i].y <= avg-spectrum)
      && clean) {
      points[i] = null;
    }
  }
}

//void drawLines() {
//  background(0);
//  f_index = (f_index + 1)%files.length;
//  String f = files[f_index].getAbsolutePath();
//  while (!f.toLowerCase().endsWith(".jpg")) {
//    f_index = (f_index + 1)%files.length;
//    f = files[f_index].getAbsolutePath();
//  }
//  text(f, 10, 30);

//  img = loadImage(f);

//  for (int x=0; x<img.width; x++) {
//    PVector p = new PVector(x, 0, 0);
//    float red = 0;
//    float total = 0;
//    for (int y=0; y<img.height; y++) { // color c = img.get(x, y); // if (red(c) > red && red(c) + green(c) + blue(c) > total) {
//        red = red(c);
//        total = red(c) + green(c) + blue(c);
//        p.y = y;
//      }
//    }
//    // check red thresholdp
//    if (clean && red < threshold) {
//      p = null;
//    }
//    points[x] = p;
//  }

//  // remove outliers from center
//  float avg = pass1();

//  // remove outliers from median
//  pass2(avg);

//  // draw depth points
//  stroke(255, 0, 0);
//  strokeWeight(3);
//  for (int i=0; i<points.length; i++) {
//    if (points[i] != null)
//      point(points[i].x, points[i].y);
//  }
//  strokeWeight(1);

//  stroke(100);
//  //line(0, mean, width, mean);
//}


void drawLinesFast() {
  // draw depth points
  stroke(255, 0, 0);
  strokeWeight(3);
  if (clean) {
    for (int i=0; i<cleanpoints[frame].length; i++) {
      if (cleanpoints[frame][i] != null)
        point(cleanpoints[frame][i].x, cleanpoints[frame][i].y);
    }
  } else {
    for (int i=0; i<allpoints[frame].length; i++) {
      if (allpoints[frame][i] != null)
        point(allpoints[frame][i].x, allpoints[frame][i].y);
    }
  }
  if (debug) {
    float center = height/2-50;
    stroke(150);
    line(0, center-spectrum*2, width, center-spectrum*2);
    line(0, center+spectrum*2, width, center+spectrum*2);

    stroke(50);
    line(0, frameAvgs[frame]-spectrum, width, frameAvgs[frame]-spectrum);
    line(0, frameAvgs[frame]+spectrum, width, frameAvgs[frame]+spectrum);
  }
  //line(0, mean, width, mean);
}

Once I got the algorithm down for analyzing the laser in each frame, I converted the y-value in each frame into the z-value of the 3D model, x was the same (width of video frame) and y-value of 3D-model to the index of each frame. The result looks like this when drawn in point-cloud form frame by frame:

Thanks to some help by Golan Levin in drawing in 3D in processing, this is the same model when drawn with triangle polygons:

Processing: Analyze images for red laser path, create 3D point cloud

String name = "subaru outback";
String path = "/Path/to/"+name+"/";
File dir; 
File [] files;
int f_index = 0;
PImage img;
PVector[] points;
PVector[][] allpoints;
float threshold = 30; // minimum red brightness
float spectrum = 75; // maximum distance from median

int smoothing = 1;
int detail = 1280/smoothing;
int spacing = 25;
float height_amplification = 4.5;

boolean lineview = true;
boolean pause = false;
int skip = 3;

int frameIndex = 0;

import peasy.*;
PeasyCam cam;

void setup() {
  size(1280, 720, P3D);
  surface.setResizable(true);
  //fullScreen(P3D);
  dir= new File(dataPath(path+"frames"));
  println(dir);
  files= dir.listFiles();
  allpoints = new PVector[files.length][detail];

  convert();
  //saveData();

  cam = new PeasyCam(this, 3000);
  cam.setMinimumDistance(10);
  cam.setMaximumDistance(3000);
  
  frameRate(30);
}

void draw() {
  if (!pause) {
    drawNew();
    frameIndex=(frameIndex+1)%files.length;
  }
}

void drawNew() {
  int nRows = files.length;
  int nCols = detail;
  background(0); 
  noStroke() ; 
  strokeWeight(1); 
  //float dirY = (mouseY / float(height) - 0.5) * 2;
  //float dirX = (mouseX / float(width) - 0.5) * 2;
  float dirX = -0.07343751;
  float dirY = -0.80277777;
  colorMode(HSB, 360, 100, 100);
  directionalLight(265, 13, 90, -dirX, -dirY, -1);

  directionalLight(137, 13, 90, dirX, dirY, 1);
  colorMode(RGB, 255);

  pushMatrix(); 
  translate(0, 0, 20);
  scale(.5); 
  fill(255, 200, 200); 

  if (lineview) {
    noFill();
    stroke(255, 255, 255);
    strokeWeight(2);
    for (int row=0; row<frameIndex; row++) {
      beginShape();
      for (int col=0; col<nCols; col++) {
        if (allpoints[row][col] != null && col%skip == 0) {
          float x= allpoints[row][col].x;
          float y= allpoints[row][col].y;
          float z= allpoints[row][col].z;
          stroke(255, map(row, 0, nRows, 0, 255), map(row, 0, nRows, 0, 255));
          vertex(x, y, z);
        }
      }
      endShape(OPEN);
    }
  } else {
    noStroke();
    for (int row=0; row<(frameIndex-1); row++) {
      fill(255, map(row, 0, nRows, 0, 255), map(row, 0, nRows, 0, 255));
      beginShape(TRIANGLES);
      for (int col = 0; col<(nCols-1); col++) {
        if (allpoints[row][col] != null &&
          allpoints[row+1][col] != null &&
          allpoints[row][col+1] != null &&
          allpoints[row+1][col+1] != null) {
          float x0 = allpoints[row][col].x;
          float y0 = allpoints[row][col].y;
          float z0 = allpoints[row][col].z;

          float x1 = allpoints[row][col+1].x;
          float y1 = allpoints[row][col+1].y;
          float z1 = allpoints[row][col+1].z;

          float x2 = allpoints[row+1][col].x;
          float y2 = allpoints[row+1][col].y;
          float z2 = allpoints[row+1][col].z;

          float x3 = allpoints[row+1][col+1].x;
          float y3 = allpoints[row+1][col+1].y;
          float z3 = allpoints[row+1][col+1].z;

          vertex(x0, y0, z0); 
          vertex(x1, y1, z1); 
          vertex(x2, y2, z2); 

          vertex(x2, y2, z2); 
          vertex(x1, y1, z1); 
          vertex(x3, y3, z3);
        }
      }
      endShape();
    }
  }

  //noFill();
  //strokeWeight(10);
  //stroke(0, 255, 0);
  //fill(0, 255, 0);
  //line(0, 0, 0, 25, 0, 0); // x
  //text("X", 25, 0, 0);

  //stroke(255, 0, 0);
  //fill(255, 0, 0);
  //line(0, 0, 0, 0, 25, 0); // y
  //text("Y", 0, 25, 0);

  //fill(0, 0, 255);
  //stroke(0, 0, 255);
  //line(0, 0, 0, 0, 0, 25); // z
  //text("Z", 0, 0, 25);

  popMatrix();
}

void convert() {
  for (int f_index = 0; f_index < files.length; f_index++) {
    points = new PVector[detail];
    String f = files[f_index].getAbsolutePath();
    while (!f.toLowerCase().endsWith(".jpg")) {
      f_index = (f_index + 1)%files.length;
      f = files[f_index].getAbsolutePath();
    }

    img = loadImage(f);

    for (int x=0; x<img.width; x+=smoothing) {
      PVector p = new PVector(x, 0, 0);
      float red = 0;
      float total = 0;
      for (int y=0; y<img.height; y++) { color c = img.get(x, y); if (red(c) > red && red(c) + green(c) + blue(c) > total) {
          red = red(c);
          total = red(c) + green(c) + blue(c);
          p.y = y;
        }
      }
      // check red threshold
      if (red < threshold) {
        p = null;
      }
      points[x/smoothing] = p;
    }

    // remove outliers from center
    float avg = pass1();

    // remove outliers from median
    pass2(avg);

    // draw depth points
    for (int i=0; i<points.length; i++) {
      if (points[i] != null) {
        //point(points[i].x, points[i].y);
        float x = i - (detail/2);
        float y = (f_index - (files.length/2))*spacing;
        float z = (points[i].y-height/4)*-1*height_amplification;
        allpoints[f_index][i] = new PVector(x, y, z);
      } else {
        allpoints[f_index][i] = null;
      }
    }
  }
}

// returns avg of points within the center
float pass1() {
  float center = height/2-50;
  float sum = 0;
  int pointCount = 0;
  for (int i=0; i<points.length; i++) {
    if (points[i] != null && 
      (points[i].y < center+spectrum*2 && points[i].y > center-spectrum*2)) {
      sum += points[i].y;
      pointCount ++;
    }
  }
  return sum / pointCount;
}

void pass2(float avg) {
  for (int i=0; i<points.length; i++) { if (points[i] != null && (points[i].y >= avg+spectrum
      || points[i].y <= avg-spectrum)) {
      points[i] = null;
    }
  }
}

void keyPressed() {
  if (key == 'p')
    pause = !pause;
  if (key == 'v')
    lineview = !lineview;
}

I then exported all the points in a .ply file and uploaded them to Sketchfab, which all models are viewable below (best viewed in fullscreen). 

Volvo XC60

Subaru Outback

The resolution is a bit less because the car was driven at a higher speed.

3D Print

As a final step in this process, I was recommended to try 3D printing one of the scans, which I think turned out amazing in the end! There were a few steps to this process. The first was to fill in the gaps created from missing point data in the point cloud. I approached this in two different ways-first I used an average of the edges to cut off outliers. Then I extended the points closest to the edge horizontally until they reached the edge. And lastly, any missing points inside the mesh would be filled in using linear interpolation between the two nearest points on either side. This helped create a watertight top-side mesh. Then with the help of student Glowylamp, the watertight 3D model was created in Rhino and readied for printing using the MakerBot. The following are the process and results of the 3D print.

Special Thanks

Golan Levin, Claire Hentschker, Glowylamp, Processing and Sketchfab

ISSUES

I had a few hiccups along the development of this app. The first was, embarrassingly enough, mixing the width and length values in the 3D viewer, resulting in this which we all thought was correctly displaying the underside of a vehicle, somehow:

The other issue was the various forms of recording under vehicles. The following footage is the underside of a particularly shiny new Kia Soul:

Which resulted in a less-than-favorable 3D point cloud render:

There are also plenty of other renders that are bad due to non-ideal lighting conditions.

Bernie-Final

As a final experiment to working with robots and cameras, Quan and I decided to do a few experiments with putting the Black Magic camera on the robot this time.  Many have done robotic cinematography, by simply using a robotic arm to maneuver the camera in specific ways.  Our technical endeavor was to create interesting cinematic effects using the motion of the robot arm around objects while simultaneously controlling the focus and the zoom.  I wrote a OpenFrameworks app using the ofxTimeline addon to computationally control the focus and zoom of the black magic camera with an arduino.

Hitchcock Dolly Zoom

Our inspiration for creating cinematic effects entirely computationally using the robot arm came from watching Hitchcock dolly zoom effect videos. If all he had was a dolly and manual zoom, we were interested to find out what we could do with a robotic arm and computationally controlled zoom and focus.

Our first attempt was to create stereo video using two BM cameras.  After filming quite a few scenes using computationally controlled focus and two cameras, we realized that shooting stereo video is not as simple as putting two cameras eye-distance apart.  We noticed very quickly after creating the first stereo video and putting it on a google cardboard that whenever the cameras moved away from an object, the focal point needed to be further, and the cameras should have turned away from each other.  Inversely, when an object got closer, the cameras needed to shorten the focal point and angle inwards towards each other.

Stereo Video Experiments

After our in-class progress critique, our main feedback was that the capture technique is great, and that we already had a great way of capturing video – one camera, one robot arm, computationally controlled zoom and focus – but we needed to derive meaning from the objects we were shooting.  Our project needed a story.  We had considered doing portraits before, but the class reinforcing that portraits would be the most interesting way to use this tool made the decision for us.  We moved to portraiture.

The Andy Warhol screen tests were our inspiration for this next part of the project:


We liked the idea of putting people in front of the robot arm while we explored their face using this unusual method.  We had our subjects stare at one spot and took the same three minute path around each of their faces.  For three minutes they had to sit still while this giant arm with a camera explored their faces very intimately.  The results were pretty mesmerizing.

Face Exploration

We also wanted to do a similar exploration of people’s bodies.  We created a path with the robot that would explore all of a person’s body for 4.5 minutes.  It would focus in and out of certain parts of people’s bodies as it explored.  During this examination we had our five subjects narrate the video, talking about how they felt about those parts of their bodies or how they felt about the robot getting so intimate with them.  We got a lot if interesting narrations about people’s scars, insecurities, or just basic observations about their own bodies.  It ended up being a very intimate and almost somber experience to have a robot look at them so closely.


gloeilamp-Final

Skies worth Seeing

One of the subjects that appears again and again in my own photography is the sky. It is no doubt a classic subject for many photographers. The sky is of course always present and available to photograph, but is not necessarily always a compelling subject- so when does the sky become worth capturing? What are the qualities of the sky that transform it from a granted element of our everyday environment, into a moving and even sublime subject for a photograph?

To answer these questions and more, I looked to Flickr and my own image archive.

Choosing/culling images; identifying my own bias

Using the Openframeworks add-on ofxFlickr, by Brett Renfer, I was able to scrape thousands of images of skies.

My choice in tags, “sky, skyscape, clouds, cloudy sky, blue sky, clear sky, night sky, storm, stormy sky, starscape” absolutely had a large impact on the scraped images, as did the way that I was sorting the results (primarily by relevance and interestingness, as per Flickr’s API). Moreso, I was not able to find many images that were of the sky and only the sky- I had to reject many of the scraped images outright: clearly manipulated images, “astrophotography” type images of the sun or deep sky objects, monochrome images, illustrations, aerial images, or images with obtrusive foreground objects. Foreground objects were the most common reason for rejection; all together about 45% of the scraped images were rejected.

Many of the other images I scraped were acceptable in that the sky was clearly the primary subject, yet some landscape remained. This is an understandable compositional choice in photography but still was not appropriate for the analysis I wanted to make; with Golan’s help I developed a tool in Processing that would allow me to quickly crop images to just the sky.

The Unsorted Images

Arranged in a grid based on the order in which I downloaded them, they already reveal some information about the way the sky is photographed.

My primary observation at this stage is just how much variety there is in the images. The sky is traditionally thought of as blue, yet blue isn’t necessarily dominant in the collage. A huge amount of different sky conditions are represented, and the editing treatments span from the subtle to the incredibly exaggerated. Beyond this though, the unsorted collage is hard to interpret.

The Sorted Images

Seeking a greater sense of order in the images, I chose to sort using t-SNE, or t-distributed stochastic neighbor embedding. For this, I used the ofxTSNE add on by Gene Kogan. The sorted image itself is compelling, but can also better reveal the trends and variation within the dataset.

Now with some kind of organization, trends within the dataset start to emerge. Night skies are popular, but specialized (often requiring equipment like tripods, high ISO capable sensors); there are distinct categories here- auroras, the milky way, and lightning were the most dominant. Sunsets and sunrises dominate the top edge of the collage- this is a time when the sky is predictably interesting, so their high representation seems logical. The photographers here are clearly not shy about bumping up the colors in these images either.

Rainbows have a small but still notable presence; this is a compelling sky event, but is less predictable. Gray, stormy skies also make up a large portion of the image. The cloud formations here seem to be an attractive subject, but have less representation in the image set— perhaps because it isn’t always pleasant or feasible to go out and make images in a storm.

The largest sections, represented in the right side of the collage, show mostly blue skies with medium and large cloud formations. What varies between these two sections is how they are edited; I saw a distinct divide between images that were processed to be much more contrasty, and those that were less altered.

Even within the “calmer” images, where no large cloud features were present, there was a large variation in color. It’s safe to say that many of the more vibrant images here were also edited for increased saturation.

Applying this same process to my own images (albeit a more limited set; I took these ~200 images over the span of a few weeks from my window in Amsterdam) also allows me to compare my habits as a photographer to the Flickr community at large. I generally prefer not to edit my photos heavily, and leave the colors closer to how my camera originally captured them- Flickr users clearly have no problems with bumping up the vibrancy and saturation of their skies to supernatural levels.

Moving Forward

I would like to continue adding to this repository of images of skies and eventually run a larger grid, using a more powerful computer. I seemed to hit the limits of my machine at 2500 images. There are definitely diminishing returns to adding more images, but if I can further automate and streamline my scraping/culling process it could be worth it.

I am also considering what other image categories on Flickr that this method could provide insight into. I’d be particularly interested in exploring how people photograph water.

Additionally, I’m exploring how the collage itself might continue to exist as a media object- I  would like to produce an interactive online version that allows a user to zoom in and explore individual images in the collage, and view annotation and metadata related to each specific image as well as the sections.

As a physical object, I think the collage could make a nice silk scarf.


supercgeek-Final

Augmented reality portals for Historical Photographs

Historical realities of environments through portals, juxtaposing the past against the present in a HoloLens AR application.


About a year ago, I saw a post on overheard at CMU with photos of campus circa WWI and at first I genuinely didn’t believe them. I even told a friend I thought they were photoshopped. To me, the idea that a place I’m so familiar with could at one point have had such a divergent content was stunning. The idea I set out to capture was time.


I describe my process of visiting the Carnegie Mellon archives and ‘finding history’ in my place process post.

To allow for people to see these versions of time, I created a version of the historical reality (3D Model) that could be “captured” in infinite different ways by those using looking at the experience in the HoloLens. The process of creating this 3D reality from a 2D photo scan was a challenge in itself – see the diagram below to understand this process – in many ways, it was the key technical breakthroughs that enabled my project.

Click to View Fullscreen
In order to experience the recreated environment, I placed it into a mixed reality environment with HoloLens. I believe the mixed reality nature of my project brings together two ideas that had previously not intersected directly:

1 // Juxtaposition of History

The Old & New Directly Compared
HistoryPin App

2 // User-Centered Perspective

The ability to interactively control a perceptive of a virtual or augmented reality

CardBoard Sample App
I believe by connecting two these concepts, a richer understanding of the historical juxtaposition can be gained because the viewer is personally in control of the capture process – in a way, my project does not declare a produced capture result, but actually allows each participant to capture their own perspective on history.

Video & Experience


Process

The process of creating this project can be found across a number of blog posts, see below.

Personal Evaluation & Reflection

When I set out on this project, I had no idea how many technical challenges would have to be overcome. I assumed much of it could have been done easily, but found instead that each and every step between original image and mixed reality experience was its own significant undertaking. When I started this project, I had no idea of the steps that would be required or how I would tackle them, I can confidently say now that I know all of them intimately. That said, I can’t say I’m actually happy with how they’re all integrated in my project.

ngdon-Final

Image Sequencer

My final project is a continuation of my experiments in the event project, which is a tool to computationally sort images into sequence based on their common features.

The project runs three modules step by step to achieve this:

1) Image segmentation, extracting object of interest from the background,

2) Comparison, comparing the similarity between two given extracted objects, and

3) Sorting, ordering a set of images into sequence using comparison function.

Last time, the algorithm used in each module is fixed. For the final project, I devised several alternative algorithms for each module, so the process can be customized into different pipelines suited for a variety of datasets.

Speeding up

I only had the time to sort one dataset (horses) for my event project since processing time take more than 24 hours. So the first priority is to speed it up.

I designed several numpy filters applied on images as matrices to replace pixel by pixel processing. This made the comparison part of my program run around 200 times faster. However the image segmentation is still relatively slow because the images are uploaded and then downloaded from the online image segmentation demo.

Now that the program runs much faster, I had the chance to apply it on a variety of datasets.

Sorting Objects

475 Bottles from Technisches Museum Wien

Sorting faces

My previous algorithm compares two images based on the outline of the object of interest. However, this is not always desired for every dataset. For example, the outlines of people’s heads might be similar, yet their facial features and expressions can be vastly different so if made adjacent frames, it wouldn’t look smooth.

I used openCV and dlib for facial landmark detection, and compared the relative spatial location of pairs of key points. Then the program iterates through all faces and place the faces with the most similar key points together. Sorting 348 portraits from MET, this is what I get:

Alternative sorting methods and morphing

From peer feedback, I realized that people are not only interested in the structural similarity between objects in two images, but also other properties such as date of creation, color, and other dataset-specific information.

However, the major problem sorting images using these methods is that the result will look extremely choppy and confusing. Therefore, I thought about the possibility of “morphing” between two images.

If I am able to find a method to break a region of image into several triangles, and perform an affine transformation of the triangles from one image to another, slowly transitioning the color at the same time, I can achieve a smooth morphing effect between the images.

Affine transformation of triangles

In order to do an affine transformation on a triangle from original transformation to target transformation, I first recursively divide the original triangle into many tiny triangles using a method similar to the Sierpinski’s fractal, but instead of leaving the middle triangles untouched my algorithm operates on all the triangles.

The same step of recursion is done on the target triangle. Then, every pixel value of every tiny triangle in the original transformation is read, and then drawn onto the corresponding tiny triangles in the target transformation. Below is a sample result:

Morphing

Since facial landmark detection already provided the key points, a face can now easily be divided into triangles and be transformed into another face. Below is the same portraits from MET sorted by chronological order, morphed.


The problem now is to find a consistent method to break other things that are not faces into many triangles. Currently I’m still trying to think of a way.

Re-sorting frames of a video

An idea suddenly came into my mind, what if I re-sort some images that are already sorted? If I convert a video into frames, shuffle them, and sort them using my own algorithm into a video, what would I get? It will probably still be smoothly animated, but what does the animation mean? Does it tell a new story or give a new insight into the event? The result will be what the algorithm “think” the event “should” be like, without understanding the actual event. I find this to be an exciting way to abuse my own tool.

Left: Original  Right: Re-sorted


Alternative background subtraction

I ran the algorithm on my own meaningless dance. It transformed into another, quite different, meaningless dance. I wonder what happens if I do the same on a professional dancer performing a familiar dance.

When I tried to run the image segmentation on ballet dancers, the algorithm believed them to be half-cow, half-human, armless monsters. I guess it hasn’t been trained on sufficient amount of costumed people to recognize them.

So I had to write my own background subtraction algorithm.

In the original video, the background is the same, yet the camera angle is constantly moving, so I couldn’t simply median all the frames and subtract from it. I also couldn’t use similar methods because the dancer is always right at the middle of the frame, and the average/median/maximum of the frames will all have a white blob in the center, which is not helpful.

Therefore I used a similar method described in my event post, which is for each frame, learn the background from a certain region, and subtract the pixels that resembles this sample surrounding the object of interest.

I sample the leftmost section of each frame, where the dancer has never been to, and horizontally stack this section into the width of the frame, and subtract the original from this estimated background.

Combined with erode/dialect and other openCV tricks, the it worked pretty well. This method is not only useful for ballets, as it’s a common situation in many datasets to have relatively uniform backgrounds yet complicated foregrounds.

Using the same intensity based registration (now 200x faster), the program complied a grotesque dance I’ve never seen before:

Bierro – final

The pulse of Shibuya

An organic visualization of the dynamics and movements inherent in the iconic Shibuya crossing in Tokyo.

The project

The hustle and bustle happening all day long in Shibuya crossing is unique in the world. During rush hour, it has as many as 2,500 pedestrians crossing every time the signal changes. My project consisted in capturing the dynamics of this place through the lens of a public webcam and visualizing them as a set of almost biological parameters: pulse, flows and lights.

While the flow is directly coming from the motion of the pixels in the video, the pulse is derived from the average speed at which the pixels are moving, and the crosswalk light is captured based on the number of moving pixels at the same time (more pixels implies that people are crossing the street in all directions).

I tried to make this project novel by considering the city as a living being whose health features can be monitored. In a time when many efforts are made towards the planet’s sustainability, rethinking the city as a living being emphasizes the need to preserve its essence and to check upon its health status.

This work was inspired by famous timelapses, such as the Koyaanisqatsi by Geoffrey Reggio and Philip Glass or Tokyo Fisheye Time Lapse by darwinfish105, that managed to capture the dynamics of cities.

Fascinated by these works, I also tried to deviate for their form. Although time lapses are very effective at condensing the multitude of movements happening over a long span of time, I was interested in a more real-time and organic output.

In the final version of my app, we can clearly see a pattern in the pulse of Shibuya: the red light sequences are subject high variations in the graph and precede a more stable curve when the crosswalk light turn green. In this way, we see that the fingerprint, the heartrate of this place is actually perceptible

However, this effect could be conveyed more intensely if the app was accompanied by a heartrate monitor sound and if the frame rate was higher. Moreover, the real-time version of the app is not working steadily yet and this would benefit from being fixed in the future.

The App

The media object that I created is an OpenFrameworks application. The following video was recorded from my screen while the app was running. Unfortunately due to the recording my app was running slower and the frame rate gets quite low.

Making-of

Bierro-place

Sayers-Final

Premise/Summary

I started with the idea that I was going to go to a graveyard to get scans of graves to turn into music.  This eventually evolved into scanning the Numbers Garden at CMU with Ground Penetrating Radar with thanks to Golan Levin, the Studio for Creative Inquiry, Jesse Stiles, and Geospatial Corporation.  I then compiled these scans into music which I then placed into a spatialized audio VR experience. 

Ground Penetrating Radar Overview

A short description is GPR works basically by reflecting pulses of radar energy that are produced on a surface antenna.  This then creates wavelengths that go outward into the ground.  If an object is below ground, it will bounce off that instead of merely the ground, and will travel back to the receiving antenna at a different time (in nanoseconds).  The most important type of data that you receive from GPR is called a reflection profile and looks like this:

Essentially by finding the aberrations in the scan, one can figure out where there were underground objects.

History of CMU/Scanning With Geospatial

One of the things that we scanned was the buried artwork Translocation by Magdalena Jetelová.  This was an underground room that was put underneath the cut in 1991.  I talked with the lovely Martin Aurand (architectural archivist of CMU) who told me some of the stories about this piece.  In the late 80s/early 90s, a CMU architecture professor that was beloved by many of the staff had died in a plane crash on her way to Paris.  To honor her, the artist Magdalena Jetelová created a room beneath the cut in a shipping container, with lights and a partition.  There was a large piece of acrylic on top of it so that you could actually walk around on top of it.  This artwork was buried somewhere around 2004 however, as water had started to leak in and ruin the drywall/fog the acrylic.  Most people on campus don’t know that it exists.

Another area that I explored was the area by Hunt Library now known as the peace garden.  This used to be a building called Langley Laboratory (although this was often labeled Commons on maps).  I went and visited Julia Corrin, one of the other archivists on campus to look through the archives to find old pictures of CMU.  One part of Langley Laboratory in particular caught my eye as it was a small portion that jutted off the end that appeared in no photographs except the aerial photos and plans.  Julia did not actually know what that part of the building was for and asked me to explore it.  After looking through the GPR data, I don’t believe any remnants of it remained.  It is likely that the building’s foundation was temporary/were completely removed for the creation of Hunt Library.

The last big area I explored was the Number Garden behind CFA.  This area was interesting particularly because Purnell Center is immediately below it.  This was particularly interesting to scan as we could see the ways that the underground ceiling sloped beneath the ground we were walking on/the random pipes and electrical things that were between the sidewalk and the ceiling.

The people at Geospatial were amazing partners in this project and went above and beyond to help me and our class learn a lot about GPR and its uses.

Hearing the Ground

After scanning, I used SubSite’s 2550GR GPR Software to get the scans from .scan files into a more standard image format.  I  went through them all and organized each swath of scans into folders based on what part of the scan it was, whether it was the shallow or deep radar scan, pitch range etc.  I then took the swaths and put them into photoshop and edited the curves and levels so that I could filter out most of the noise/irrelevant data.  I put these edited photos into a Max MSP patch.  This patch would take an array of pixels and depending on each pixels color/brightness, it would assign a pitch to that pixel. I did this for both the deep and shallow scans which I used as bass and treble respectively. I then combined all the different swath’s audio clips for the deep and shallow to make two separate pieces which I then joined together at the end in Audacity.

Spatialized Audio with Scans in VR

One of the later portions of the project was putting this audio into a spatialized VR project.  I used splines in Unity to map our path in the Numbers Garden.  I then attached the audio source to it so that the audio would travel through the Vive space in the same pattern as we did while scanning.  I put a cubes on the audio source so that it would be easier to find.  I created two splines (one for the bass/deep and one for the treble/shallow) and put them accordingly in the space with the bass being lower to the ground.  I then used the occulus audio sdk to make it so that the participant would be able to find the audio source merely by moving their head.  I finished by writing a few scripts that allowed me to have the scans as spinning, slightly pulsating skyboxes.  Another script changed the scans when that swath of the scan’s sound had ended.

Continuation

I am really hoping to continue this project over this coming summer and next year.  I hope that I can scan more places to hopefully create isosurface profiles.  These I could then use so that in every single place in the Vive area, there would be a separate sin wave that would correspond to the Isosurface model in a similar fashion.  By moving around the space, this would allow participants to physically hear when they are moving their head near an object.

mikob – final


First Kisses – A collection of 1000 answers for the question “Where were you when you had your first kiss?”


This project was developed from a previous project sparked by several questions including, what extent will I be able to learn about a stranger? Are the experiences we regard as personal truly personal? Where do these personal experiences potentially overlap with others and become shared experiences? At first, I sought to find answers to these questions by asking a selection of password security questions to ~200 people on Amazon’s Mechanical Turk. With this pilot study, I discovered some interesting patterns on where people experience their first kisses. For the final project, I expanded the scope of the project by asking a little over 1000 respondents on Turk with the help of Golan’s funding from the STUDIO.

I read through every answer and categorized them into themes, which were essentially both physical and conceptual “places.” (i.e. Garage, birthday party)


In terms of representing these “places”, I wanted to retain the poetic quality of my previous project and include some visual aid for the reader to better imagine where these experiences occurred. I gained inspirations from various types of maps such as Mark Bennett’s TV show blueprints and IKEA’s direction maps. I drew an imaginative map with Illustrator for the table of contents, with page numbers as labels and included additional illustrations for certain locations including different rooms in a house and various types of vehicles.

Final PDF

Now that I look back, I think it would have been more personal for myself if I hid my own answer in the book. Someone suggested that it would have been also fun to collect answers from the class anonymously to include in the book and guess who’s answer was who’s.

This exploration has answered some of the initial questions I had. It’s fascinating to watch how readers experience nostalgia through other’s stories of their first kiss. First Kisses is a book of collective secrecy and an exploratory reflection on memories.


fourth-final

High Speed Portraiture

High speed footage and audio recordings provide not just a montage portrait, but insight into the photographers perspective while capturing a traditional portrait.


The work is composed of two portraits. The first, a traditional printed portrait, as captured by me in a completely non-experimental way. The second portrait is a view of the subject as I, the photographer, see them. Their movements, mannerisms, how they talk about themselves, how their face moves and slides between expressions, and the other elements that I am paying attention to when choosing how and in what instant to capture my portrait. This was captured in high speed to draw attention to details, micro-expressions, fidgets, and face movements that otherwise would go hidden or diminished.

This project is interesting because it gives a behind-the-scenes look at the process without actually being a behind the scenes look. The high speed portrait stands alone as a portrait, related yet distinct from the printed portrait.


I am not the first photographer to experiment with high speed cameras or working to deny the characteristics of high speed cameras to make them appear like other works, in aesthetic. Sam Taylor-Wood’s Hysteria, is one example, Bill Viola’s The Passions another. I was also inspired by radio work, such the podcast Beautiful/Anonymous hosted by Chris Gethard, and the style of first person characterization utilized in episodes of The Truth and The Heart, a form I have utilized in my own radio work before.

These portraits do not hinge on the high speed camera, and I did not use the high speed technique to reveal or re-contextualize someone, but instead to just draw focus and attention – this is also how I chose to edit the clips, quickly and impatiently; denying the high speed footage of the time it takes for one to discover ultra slow motion details.


This project succeeded in my primary technical goal, which was to use the (all things considered) cheap high speed camera in such a way as to achieve results that looked good and didn’t have a ‘high speed’ aesthetic. This included a great deal of color grading with a variety of techniques. The footage was shot high key and low key, and was often both over and under-exposed, which posed interesting color and post-production challenges. I utilized de-flicker techniques as well.

The main technical failure was being unable to tackle the noise artifacts remnant on the footage. This is possible and not even experimental, I just didn’t have the time or tools available. Using this camera going forward, noise reduction is essential.

The other failure was that I did not complete enough portraits. At least 3 things are needed for these to conceptually fall into a set. As just two – one high-key and one low-key, they play in opposition to each other when observed; making or failing to make statements I have no intention of making. Various methods were considered to tackle this, such as numbering the portraits arbitrarily or using a wrapping aesthetic of ‘test footage’ with bars/tones and so on to imply the existence of other films. These were ultimately decided against.


High Speed Portraits: evan from Smokey on Vimeo.

High Speed Portraits: lexi from Smokey on Vimeo.


Making Of

First was the audio recording. Here’s a video explaining what I did to get the audio how I wanted it.

Then the process of capturing the footage. First I set up and took test shots of my regular camera until I got the lighting how I wanted it, and to loosen the subject up. The high speed camera was set to a 50% buffer, and I triggered both cameras at the same time when aiming for an actual portrait capture. Each video takes a few minutes to save out of the buffer when capturing, so the process is slow. Keeping my stereo system on and a conversation running helps keep the subject from getting bored. I also made sure they were not moving too much by having them remember and return to a home position – this way I didn’t lose focus (hopefully).

Editing was the last and most time consuming aspect. Nothing magical and no tricks. Color grading was done with the lumetri tools in premiere, and starting working with my white balance and color balance so it’s not so incredibly red. Then I played with cooler lookup tables’s as a starting point, as they tend to add cyan as opposed to just desaturating reds. This keeps my image natural while balancing out the color. Evan’s was always intended to be black and white, which helped deal with color grading, and I used the red channel to adjust his skin tones separate from his jacket and background (which I darkened).

There was some after-effects work, rotoscoping or painting out reflective elements that were distracting, such as the chair Evan was sitting in. Again, time-consuming work that isn’t too difficult.

This project is a whole lot of simple things that came together in a complicated way. By focusing and giving myself the time to do everything (except that dang noise reduction) right, I was able to achieve a technically polished project in the class environment where I don’t usually have time for these details.

caro-Final

@the.circles.of.life

Finding the center and radius of Instagrammed pregnancies.

Link to code

The Project

My project is an investigation into the geometry of pregnant women on Instagram. I downloaded over six hundred images of pregnant women, and using a tool I built with Processing, annotated each photo to find the center and radius of the belly.  After collecting all of these photos, I have been periodically re-uploading them to Instagram under the name @the.circles.of.life and reporting the data.

Through this project, I’ve created an absurd a way to objectively evaluate women that’s completely useless and has no basis in traditional beauty standards. This turns social media into an even stranger evaluative process than it already is.

There’s also a certain amount of ridiculousness in the fact that someone would spend so much time doing this. To poke at this, I’ve included several screen capture videos on Instagram of me annotating the pregnant women, so that people will know I’m doing this all by hand. I want there to be a hint of the weirdo behind the project, without actually revealing anything about who I am or why this is happening.

Context

The most similar projects I can think of are other works that make you question “who on earth would spend the time doing this?” My favorite comparison is to anonymous Internet people who use video games as platforms for strange art projects, such as this person who built a 210 day long roller coaster in Roller Coaster Tycoon, or this person who beat Sim City with an incredibly intensely planned out metropolis. It’s funny, and it clearly took an impressive amount of effort, but you have to wonder who’s behind it. They also leverage popular culture through video games in a similar way that I’m doing with Instagram.

I have been evaluating my work based on how well the humor lands. The project has been getting in-person reactions that are similar to what I was hoping for, which is a lot of fun. I’ve shown people and had them be shocked and bemused as they scrolled through dozens and dozens of Instagrammed photos of geometric pregnant women, which was exactly my goal. I hope to continue posting these photos until I have only 50 or so left, and then try and throw the project into the world and see how/if people react.


Media Object

My media object is the ongoing Instagram account. I’ve also compiled all of my pregnant lady images into this Dropbox folder for safe keeping.

Example photos

Example GIFs

I also created a print sorting about 200 of the images from least to most pregnant from left to right.


Process

Creating this work was an incredibly explorative process. I tried a lot of things that worked, I tried a lot of things that didn’t work, I regularly got a lot of feedback from a lot of people, and I regularly revised and improved my ideas.

I started where I left off with my last project, with some new insights. My final project really originated during a conversation with Golan, where he pointed out a really amusing GIF from my previous iteration of the pregnant women project.

The idea of a person hand-fitting a geometric shape to a woman’s pregnant stomach is very amusing. We brainstormed for a while about the best format to explore this potential project, and settled on Instagram as a medium. What if there was an account that analyzed pregnant women from Instagram, and re-posted the analysis back online?

I quickly registered @the.circles.of.life, and started coding. Unfortunately I had accidentally deleted the tool I made for the first draft of the project, so I had to rewrite the data logging tool.

Finding the Images

“Where did you get 600 images of pregnant women?” is a question I get a lot. I’ve developed several methods. The first method is searching hashtags such as #pregnancy, #pregnantbelly, and #babybump. The second method is that after I search these things, I can occasionally find themed accounts that are a great resource for photos of pregnant women.

Since you can’t click-and-drag download images from Instagram, I had to find a workaround. If you go to “inspect element” on an Instagram image, you can find a buried link to the image source and download it. So I did that, 600 times.

Working with the images

I went through several drafts of the design of the circles. I had several versions, all with different colors and varying degrees of fonts. After conferring with people in the STUDIO and getting a lot of valuable feedback, I settled on light pink semi-opaque circles, with the circle data adjusting visibly on the circle as it’s being dragged. I began creating videos like this, and posting them on Instagram to test.

However, I realized quickly that scrolling through dozens of videos on Instagram is pretty uneventful. The videos don’t autoplay, and the thumbnail of the video isn’t very interesting looking. If I wanted to hold people’s attention, I realized that I needed to start posting images. This also made the data collection a lot easier: where previously I had to take a screen recording of the women and split it up by which woman was in the video, I could now simply tell my processing app to save photos of women once they were finished. I began to create photos like this, but still it wasn’t quite right.

Do you see the problem? The top dot isn’t on the woman’s body. In a few of my photos, I wasn’t using exclusively the woman’s body to determine the circle, which is a very important element of the project. Throughout this time, I got better and better at marking up the images.

I settled on creating images like this.

The dots are all on the belly, the center and radius are very visible, and the circle is semi-opaque so that you can see the woman’s body through it, but the text is still visible on top of patterned clothing.

Now, I had hundreds of images and a processing sketch that would save these photos and log the data for me. At this point, it takes me about an hour to mark up every photo: not bad.

Posting the photos

There was also some debate about how to post the photos. Instagram is really difficult to post on, because they actively try to discourage bots, and will ban you if they think your account is doing something suspicious. I looked into it a lot, and decided that to be safe, I could only post about 10 photos an hour. I originally wanted to compensate for this by creating a temporary twitter account, but decided that Instagram was the correct medium. I have to post them all by hand, as there’s no Instagram API. I’ve been posting them a few at a time for several days now, and should have most of them up within the next few days.

Creating the print

Creating the print was simple once I had all of the belly data. I just sorted all the women from largest to smallest radius, and created another processing tool where I could tag the images for whether the full belly was in the circle or not, because I didn’t want any cut off circles in the print. I went through several drafts of the print, and ultimately decided on the pink and grey.

Special thank you to Golan Levin, Claire Hentschker, Cameron Burgess, Ben Snell, Avi Romanoff, Anna Henson, Luca Damasco, the ladies of Instagram, and all the other people who helped me out and gave me opinions. Additional shout-out to my eight loyal Instagram followers (Smokey, Chloe, Adella, Golan, Me, Anne, Anna, and some random person), who are still following me even though I post over 30 pregnant ladies a day.


DMGordon – FINAL!

I expanded upon my event project, which used a generative neural network to ‘rot’ and ‘unrot’ images.

diagram of information flow through a standard neural network

Summary of Neural Networks
Neural networks are an artificial collection of equations which take some form of data as input and produce some form of data as output. In the above image, each of the leftmost circles represents input nodes, which accept a single decimal number. These inputs can represent anything, from statistical information to pixel colors. Each input node then passes the input on to every node in the next layer. The nodes in the next layer accept every number from every one of the input nodes, and combine them into a new number, which is passed along to the NEXT layer. This continues until we reach the output layer, where the numbers contained in the output nodes represent the ‘final answer’ of the network. We then compare this final answer with some intended output, and use a magical method known as backpropagation to adjust every node in the network to produce an output closer to the intended one. If we repeat this process several million times, we can ‘train’ the neural network to transform data in all sorts of astonishing ways.

pix2pix
pix2pix is a deep (meaning many hidden layers) neural network which takes images as input and produces modified images as output. While I can barely grasp the conceptual framework of deep learning, this github repository implements the entire network, such that one can feed it a bunch of image pairs and it will learn to transform the elements of each pair into each other. The repository gives examples such as turning pictures of landscapes during the day into those same landscapes at night, or turning black and white images into full color images.

I decided to see if the pix2pix neural network could grasp the idea of decay, by training it on image pairs of lifeforms in various stages of putrefaction.

My dataset
I originally wanted to do my own time lapse photography of fruits and vegetables rotting, but quickly realized that I had neither the time to wait for decay to occur, nor a location to safely let hundreds of pieces of produce decay. Instead, I opted to get my data from Youtube, where people have been uploading decay time lapses for decades. I took most of my image pairs from Temponaut Timelapse and Timelapse of decay, both of whomst do a good job of controlling lighting and background to minimize noise in the data. By taking screenshots at the beginning and end of their videos, I produced a dataset of 3850 image pairs.

rotting watermelon
rotting bowl of strawberries
rotting pig head
rotting pig head close up

I trained two neural networks: one to ‘rot’, and the other to ‘unrot’. After training each network for 18 hours, they were surprisingly effective at their respective grotesque transformations. Here is an example of the unrotter puffing me up in some weird ways.
Normal:

Unrotted:

However, the pix2pix network can only operate on images with a maximum size of 256 x 256 pixels, far too small to be any real fun. To fix this, I tried both downsampling and splitting every image into mosaics of subimages, which could be passed through the network, then put back together, resized, and layered on top of each other to produce larger images:

LOS ANGELES, CA – DECEMBER 19: Television Personality Paul ‘Pauly D’ DelVecchio arrives at Fox’s “The X Factor” Season Finale Night 1 at CBS Televison City on December 19, 2012 in Los Angeles, California. (Photo by Frazer Harrison/Getty Images)

rotten

unrotten

However, the jarring borders between images had to go. To remedy this, I create 4 separate mosaics, each offset from the other such that every image border can be covered by a continuous section from a different mosaic:


We then combine these 4 mosaics and use procedural fading between them to create a continuous image:

Doing this at multiple resolutions creates multiple continuous images…


…which we can then composite into a single image that contains information from all resolution levels:

Using this workflow, we can create some surreal results using high resolution inputs:

tyson beckford

rotten

unrotten

—-
from Prada Pre-Fall 2015 catalog


—-


—-

Golan Levin provided me with Ikea’s furniture catalog which produced interesting, albeit lower-res, results:


Next Steps
The entire process of downsampling, splitting, transforming, and recompositing the images is automated using Java and Windows batch files. I plan to create a Twitter bot which will automatically rot and unrot images in posts that tag the bot’s handle. This would be both interesting to see what other people think to give the network, and a great way to get publicity.

The training dataset, while effective, is actually pretty noisy and erratic. Some of the training images have watermarks, youtube pop-up links, and the occasional squirrel, which confuse the training algorithm and lead to less cohesive results. I would love to use this project as a springboard to get funding for a grant in which I set up my own time lapse photography of rotting plants and animals using high definition cameras, many different lighting conditions, and more pristine control environments. I think that these results could be SIGNIFICANTLY improved upon to create a ‘cleaner’ and more compelling network.

Special thanks to:
Phillip Isola et al. for their research into Image-to-Image translation
Christopher Hesse for his open source tensorflow implementation
Golan Levin for providing Ikea images and suggesting a Twitter bot
Ben Snell for suggesting multi-resolution compositing
Aman Tiwari for general deep learning advice and helping me through tensorflow code

Kyin and Weija – Final Documentation


A Handprint & Footprint Recognizer

Introduction:

We created a handprint and footprint recognition system, by applying machine learning techniques to data from a Sensel Morph pressure interface.

We (Kyin and weija, sophomores at CMU) were really inspired by the potential of what the SenselMorph, a pressure sensor module, could do. With the SenselMorph we will be able to identify not only the physical shapes and surfaces of the objects that touch the sensor, but also the distribution of pressure.  With this idea in mind, we wanted to investigate how “identifiable” certain aspects of our body can be from others. The project was in part an exploration of machine learning, as well as what kind of new use cases we could project onto it.

Creating the Classifier 

Tools

  • Sensel Morph – The Sensel Morph is a pressure interface that is still in its early stages of production. It is a relatively small tablet that has approximately 20,000 pressure-sensitive sensors on the surface. More information regarding how the sensel morph is used can be seen on their website.
  • Pytorch – Pytorch is a python library used for training neural nets. A neural network is basically a probabilistic model that can be fed data and return predictions. It is trained on data, which in our case is the images of hands/feet with the person’s name as its label. With the training data, a neural net can “guess” new test images. PyTorch specifically is really nice, in that it has several options to optimize training the data using graphics cards. This allowed us to greatly reduce the overall time it took us to train the model.
  • OpenFrameworks – This was what ultimately tied our project together. There is a robust github repository with a senselmorph open frameworks addon. We bootstrapped onto this source code and adapted it to save train data, and run the neural net in real time.
  • MeteorJS – For our website, we used a combination of MeteorJS and p5.JS to create our probabilistic visual. Meteor is a great web framework for fast and rapid prototyping.

Training

In order to train a robust neural net, we needed several hundreds of photos. However, since the event we are recording is fairly short, repeating the event over and over wasn’t too hard. To further expedite this process, we made it so that our script can automatically save images when it detects that the event has “ended”. Across four people, we gathered about 400 sample images, and after removing poor samples, we ended with about 300. In hindsight, we probably should have trained it on much more data samples, but for the purposes of the assignment, 300 was more than sufficient.

With Pytorch, we were able to implement a convolutional neural network in Python and build a model using the 1200 train images that were collected. Here is more theoretical and technical information on Convolutional Neural Networks.

Special thanks to our lovely volunteers! (Photos shared with permission)

(From left to right: Jason, Kristin, Rohan, Changning)

In addition to the hand and footprints, we wanted to create an interactive exhibit for the final presentation. Since we can’t have our four trained people stand around a stand for hours, we decided to retrain our neural net on inanimate objects for viewers to try to classify themselves.

Results

Here are the outputs from some preliminary testing. When training a neural net, there is a concept called “epochs”, which is essentially how long we want to train the data for. If we overtrain the data, we suffer from something called over fitting, which is basically when the model is too hard coded on just recognizing the training data, and will fail to recognize any other external picture that isn’t identical to any of its training data. Therefore, to get the best results, we had to play around with how long we want to train the data. Overall, the results were around 85% –  90% accuracy, which is over our expectations.

We’ve noticed our accuracy actually drops when ran on the inanimate objects. Even though the pressure classes of the objects are vastly different, intuitively, we figured that since they are so apparently different, the neural network should be able to be much more accurate than the hand and foot prints, which look much relatively closer to each other than the objects:

(From left to right: Speaker, Mug, Car)

As we can see, the differences between the bases of the three objects are very different, and to the human eye, it seems as if they should easily be differentiated with respect to each other. On the contrary, beacuse of the lack of distinct features (edges, color gradients, corners, etc). the nerual net can only identify objective visual data of the images, and since these images lack significant features, it actually can’t tell the difference between the images as well as other images such as hand and foot prints.

Conclusion & Application

Once we were able to classify hands/feet, we were able to confirm our hypothesis that every hand is unique and are identifiable just like fingerprint. As we worked on this project, we’ve realized that thsi could have many more applications than just classifying hand and feet. Some other use cases include: butt classification for sit-down establishments like restaurants and barber shops, front door mat classifiers to identify visitors, and so on. We are optimistic from how accurate our foot and hand classifications ended up, and we definitely plan on thinking of more use cases for it.