sayers-GPRData

As many of you know, I decided to explore ground penetrating radar heavily this semester.  I have been interested in geology combining with artwork for quite a while, although I’m not completely sure why.  A lot of my art has to do with stratospheres of soil/minerals and their makeup.  Although this is primarily a tool for archeology and civil engineering/construction, I found it gave me some really cool data.

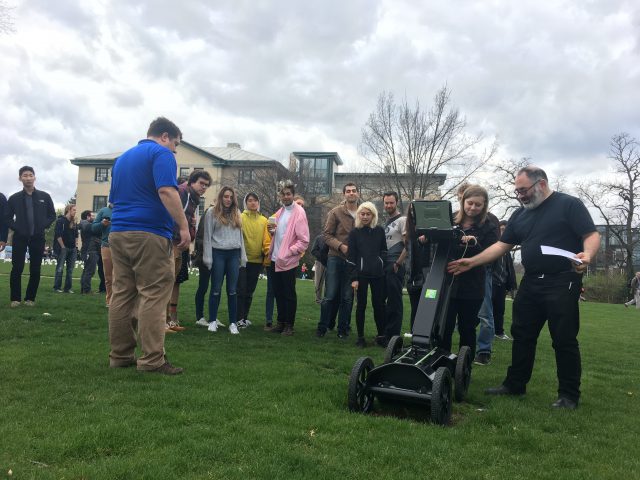
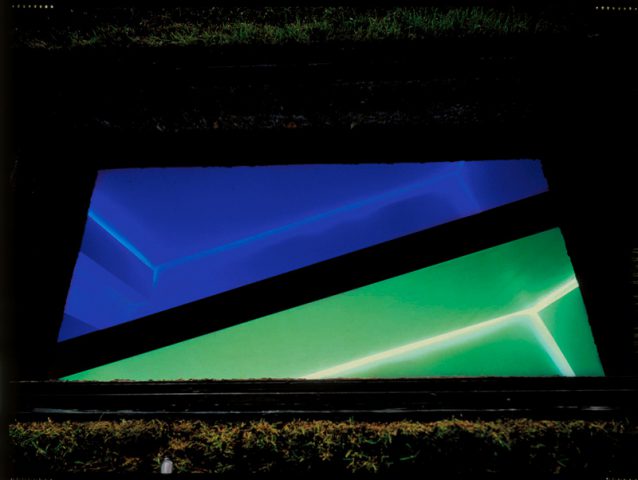
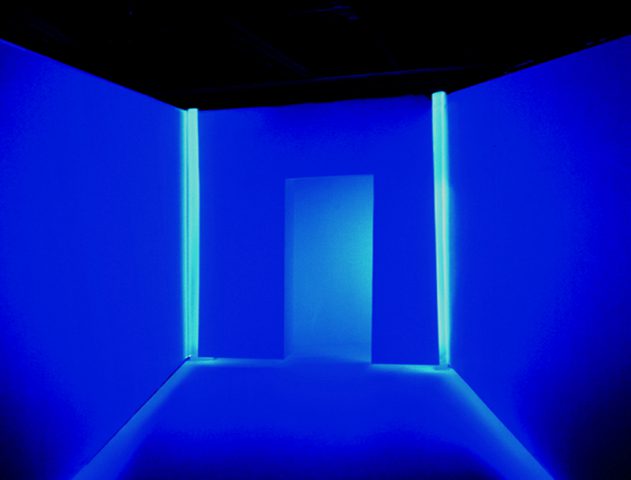
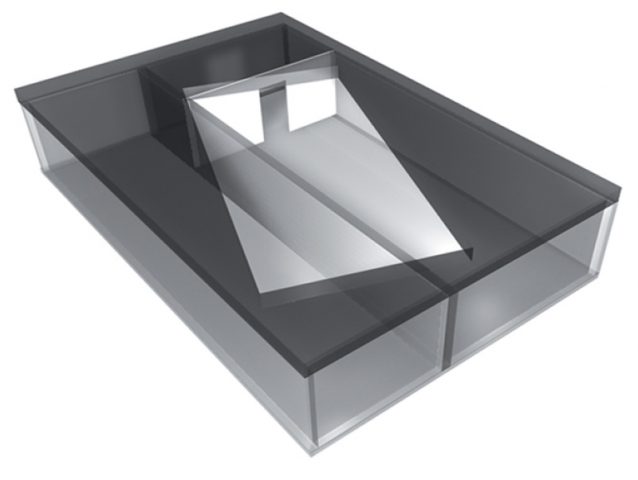
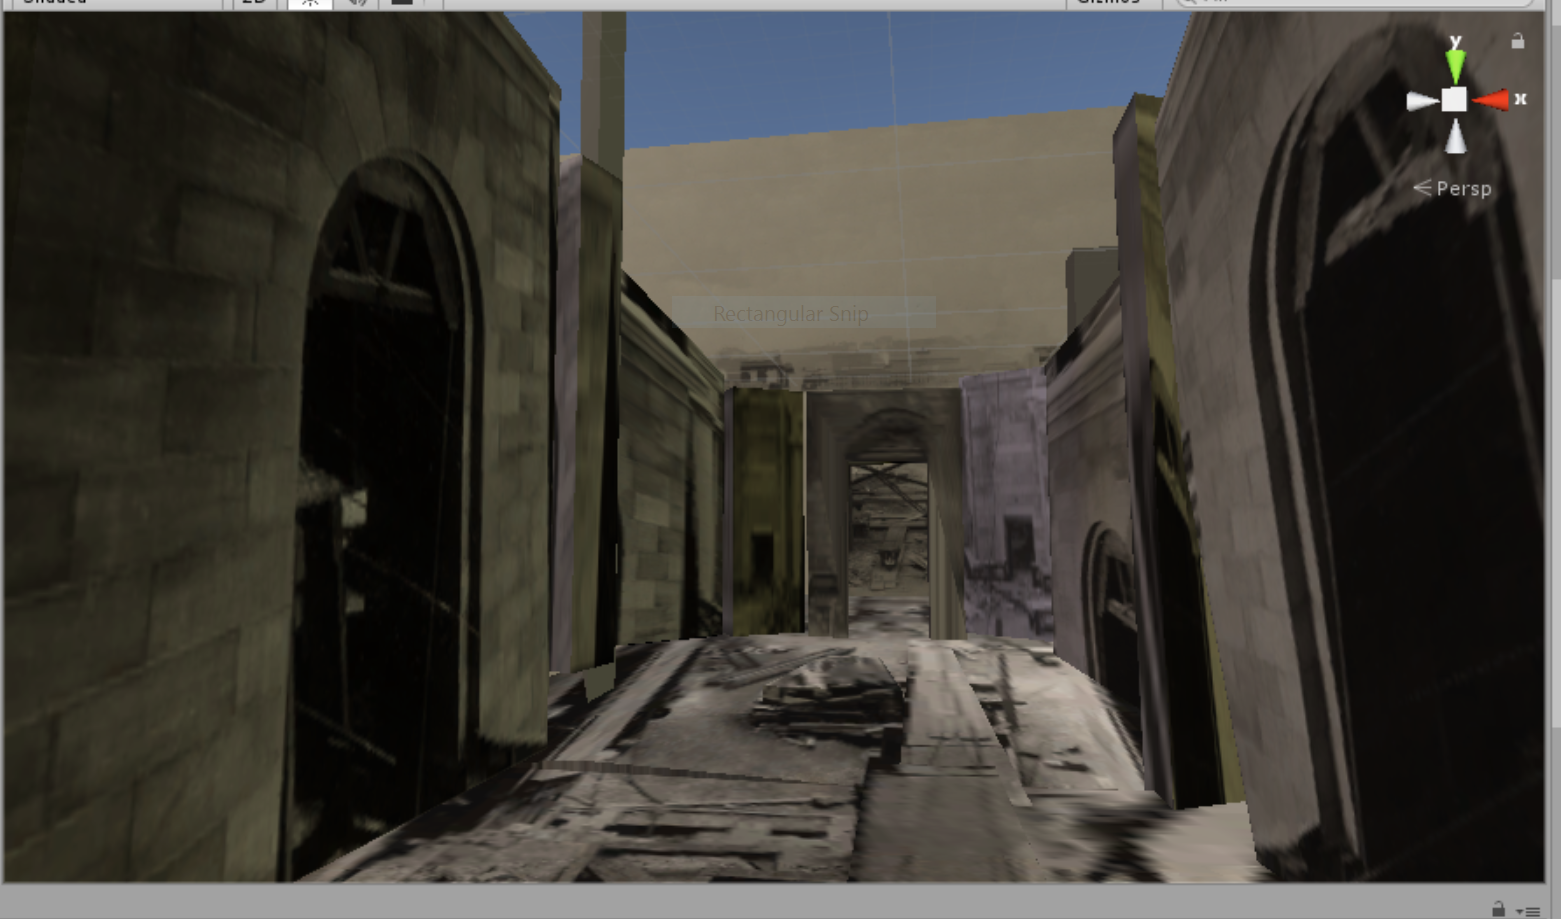
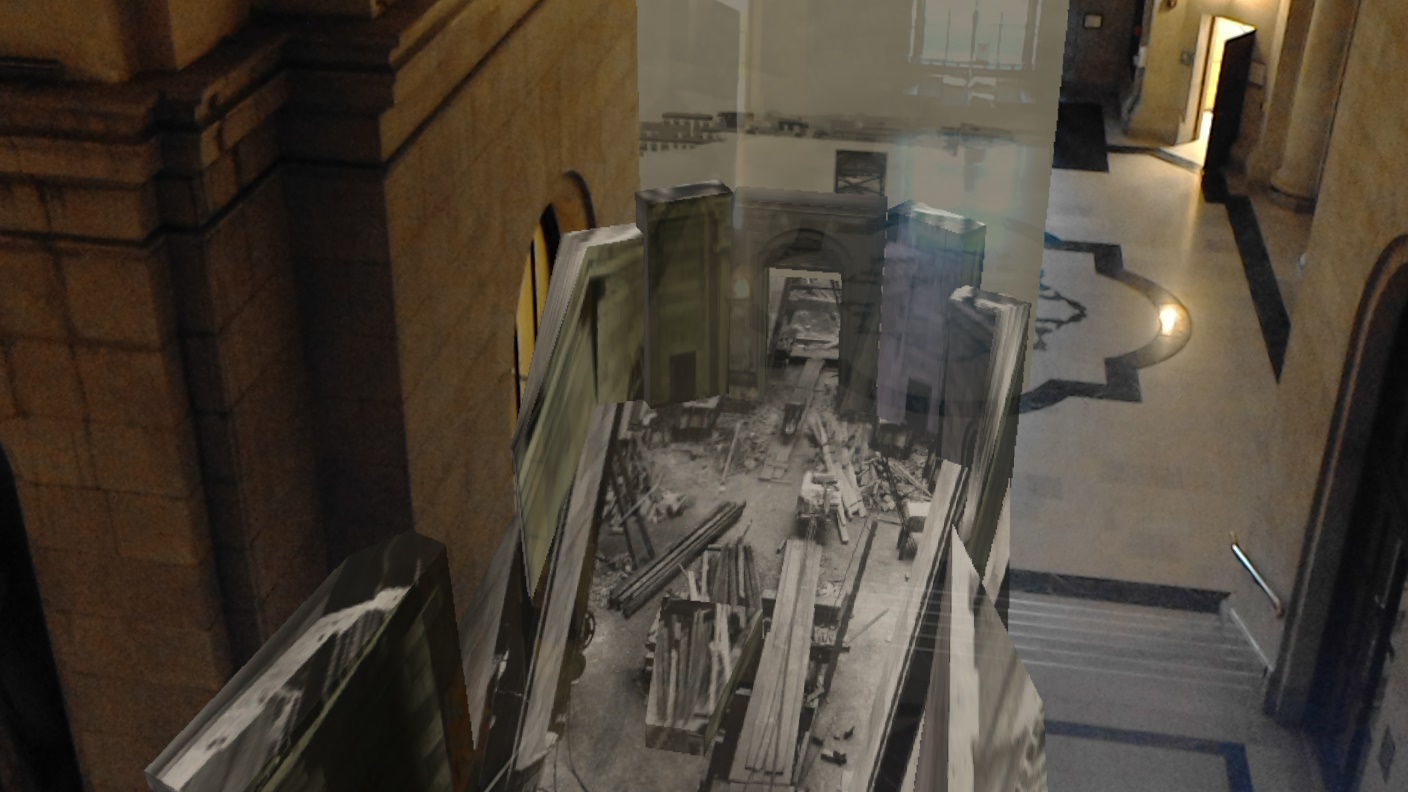
I started with the idea that I was going to go to a graveyard to get scans of graves to turn into music (in the process of being set up with GeoSpatial).  Golan was kind of enough to get GeoSpatial to come to CMU campus though, and I decided to look for some of images/things on the campus that most people never see.  Definitely by far the coolest thing was the hidden artwork Translocation by Magdalena Jetelová.  This was an underground room that was put underneath the cut in 1991.  I talked with the lovely Martin Aurand (architectural archivist of CMU) who told me some of the stories about this piece.  In the late 80s/early 90s, a CMU architecture professor that was beloved by many of the staff had died in a plane crash on her way to Paris.  To honor her, the artist Magdalena Jetelová created a room beneath the cut in a shipping container, with lights and a partition.  There was a large piece of acrylic on top of it so that you could actually walk around on top of it.  This artwork was buried somewhere around 2004 however, as water had started to leak in and ruin the drywall/fog the acrylic.  Most people on campus don’t know that it exists.  We were lucky enough to get a scan of this area which went in a grid-like pattern so that I can turn it into an isosurface rendering (more on this later).  

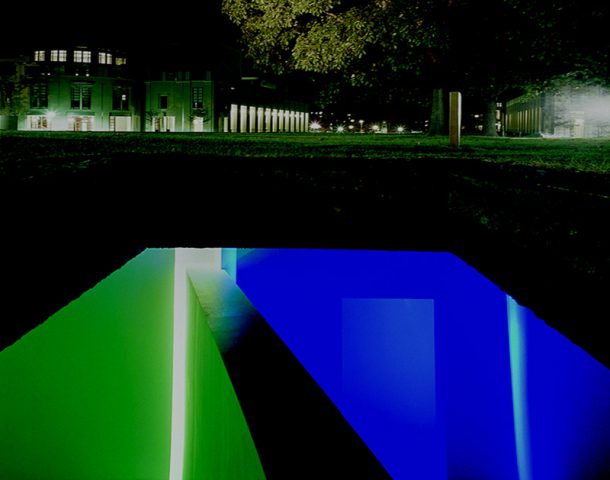
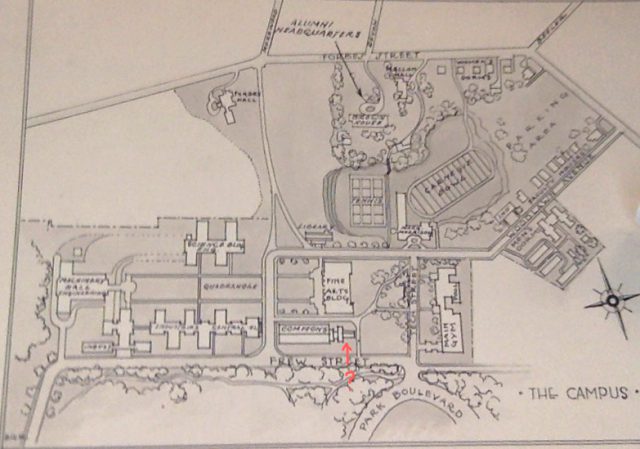
Another area that I wanted to explore was the area by Hunt Library now known as the peace garden.  This used to be a building called Langley Laboratory (although this was often labeled Commons on maps).  I went and visited Julia Corrin, one of the other archivists on campus to look through the archives to find old pictures of CMU.  One part of Langley Laboratory in particular caught my eye as it was a small portion that jutted off the end that appeared in no photographs except the aerial photos and plans.  Julia did not actually know what that part of the building was for and asked me to explore it.  After looking through the GPR data, I don’t believe any remnants of it remained.  It is likely that the building’s foundation was temporary/were completely removed for the creation of Hunt Library.

The last big area I wanted to explore was the Number Garden behind CFA.  This area was interesting particularly because Purnell Center is immediately below it.  This was particularly interesting to scan as we could see the ways that the underground ceiling sloped beneath the ground we were walking on/the random pipes and electrical things that were between the sidewalk and the ceiling.

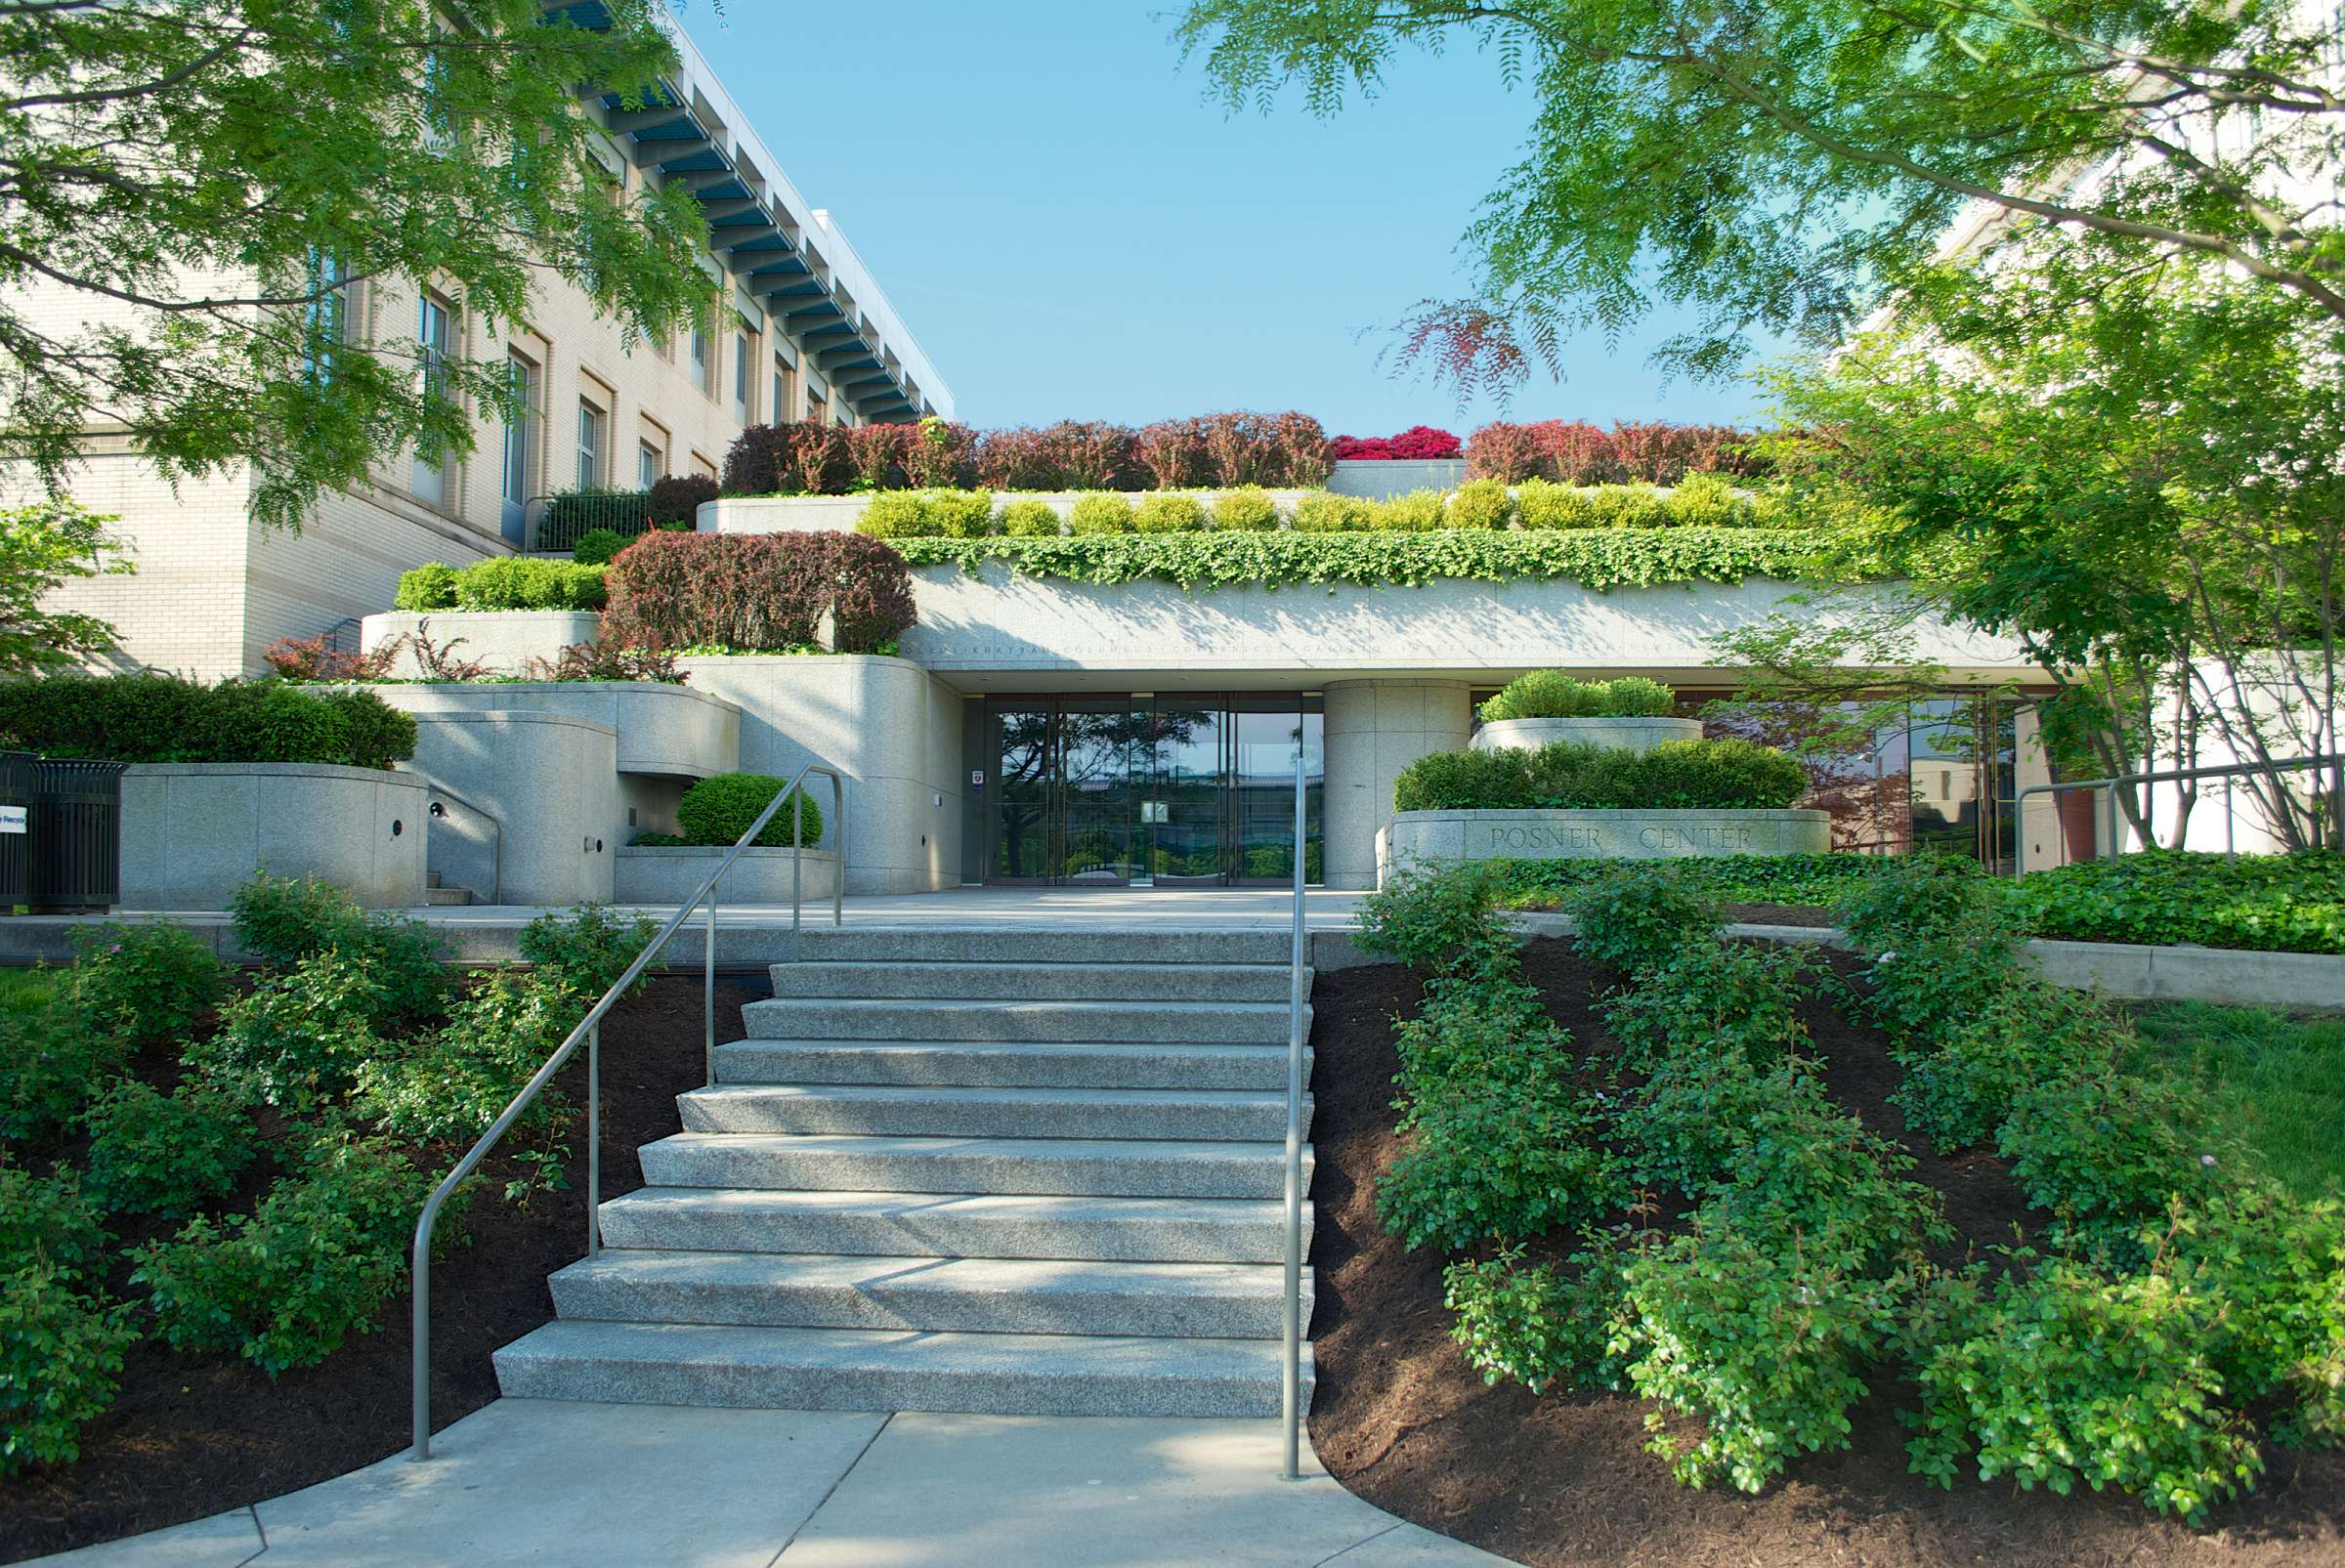
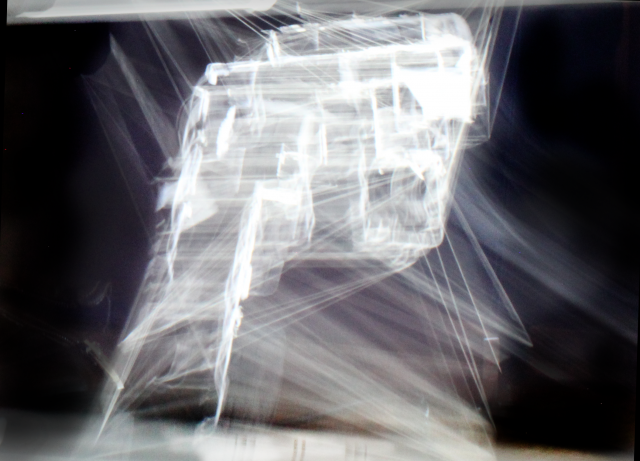
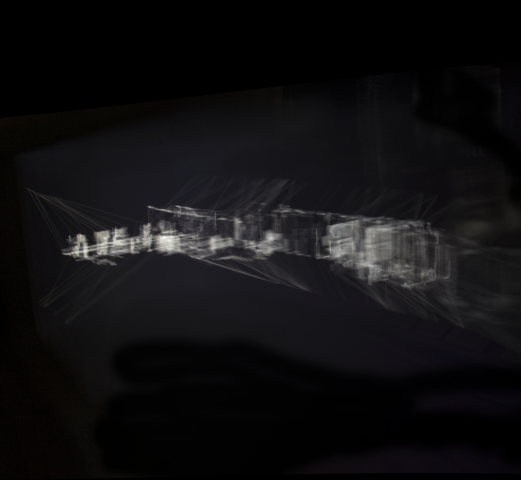
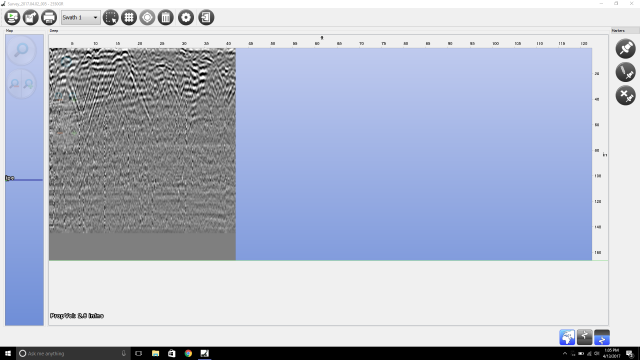
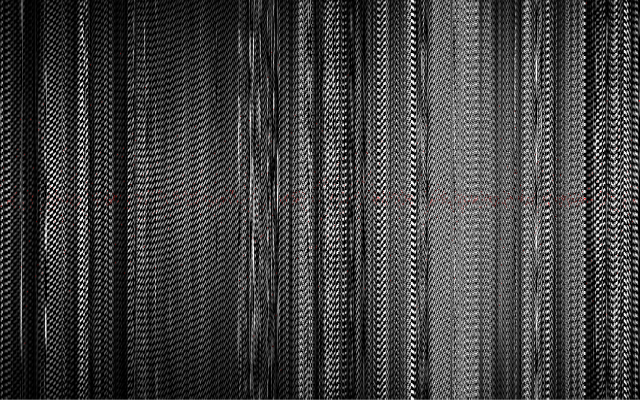
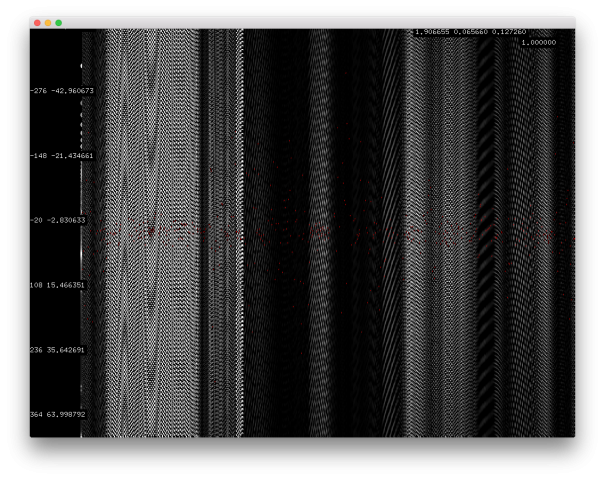
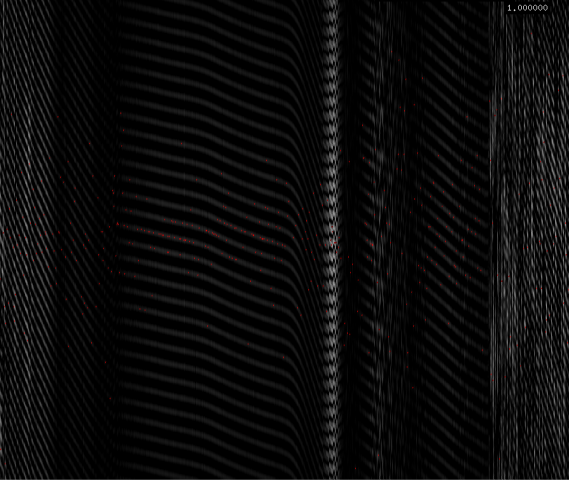
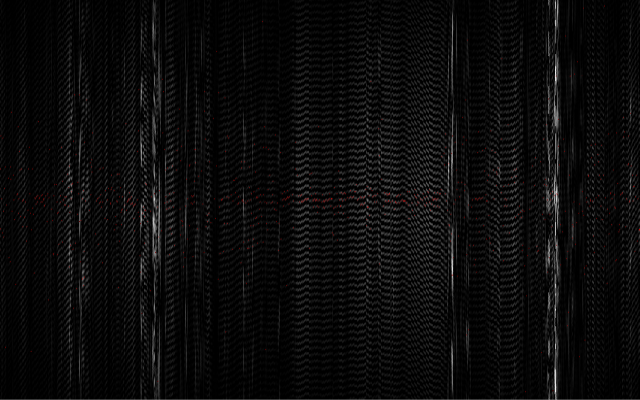
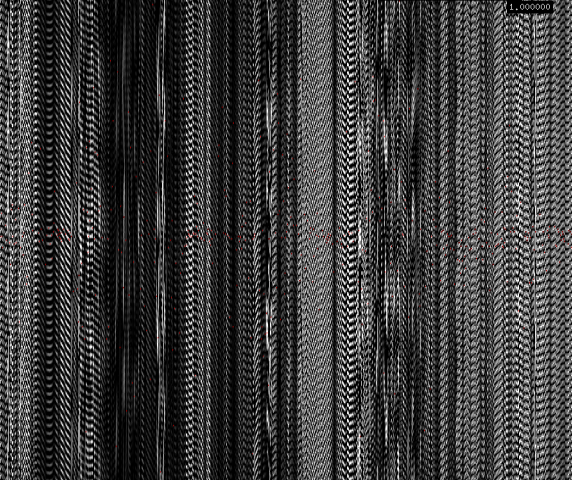
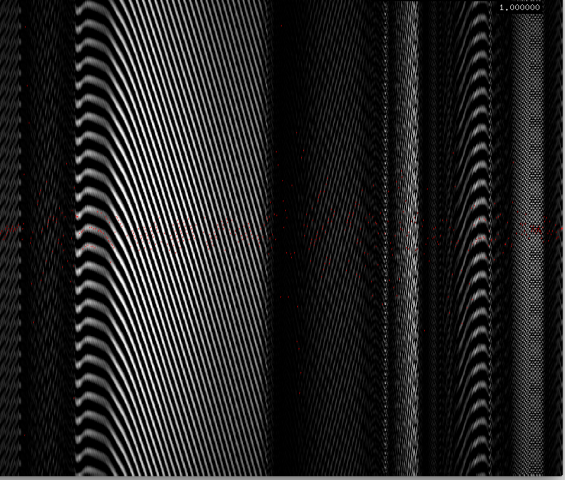
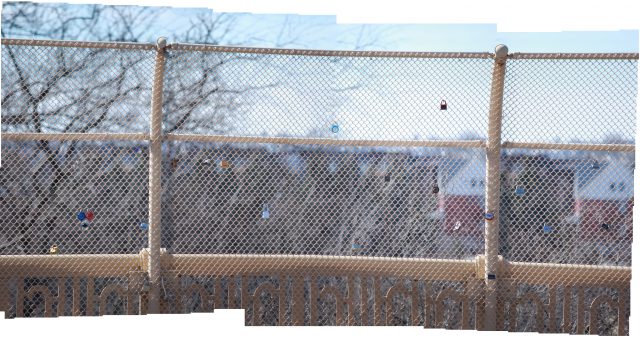
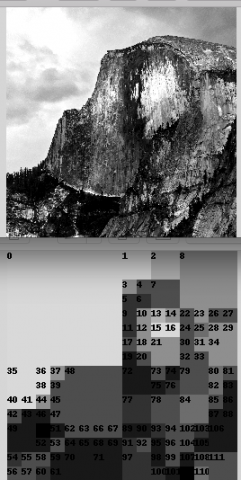
I also did a lot of research on how GPR works, particularly on the hardware portion and what antennas to use etc.  A short description is GPR works basically by reflecting pulses of radar energy that are produced on a surface antenna.  This then creates wavelengths that go outward into the ground.  If an object is below ground, it will bounce off that instead of merely the ground, and will travel back to the receiving antenna at a different time (in nanoseconds).  There are 2 main important types of GPR images.  The first thing is a reflection profile.  This is the long image that you do an immediate scan.  This will show the bumps in the ground and look like this:

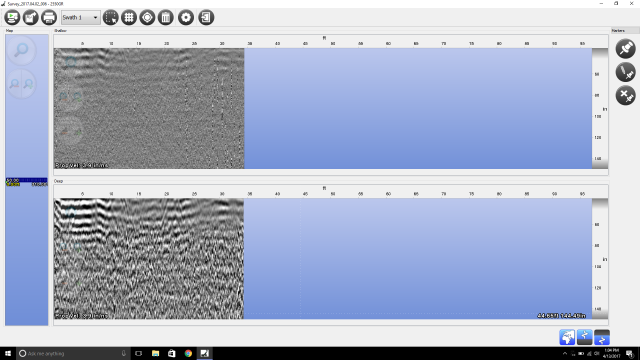
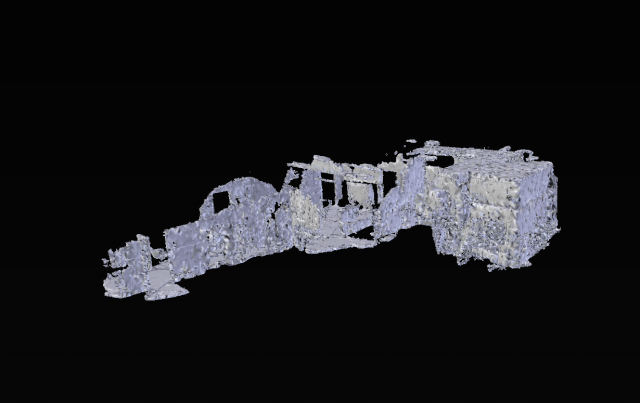
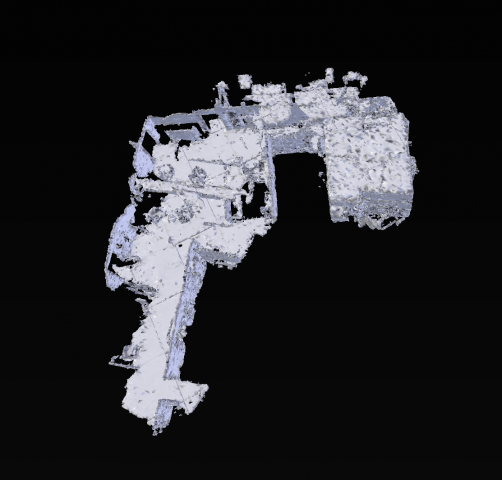
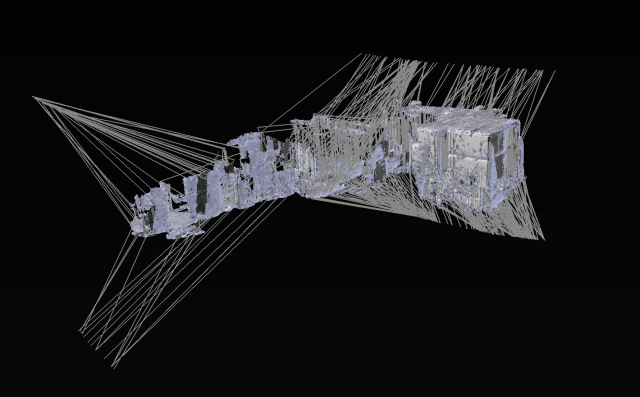
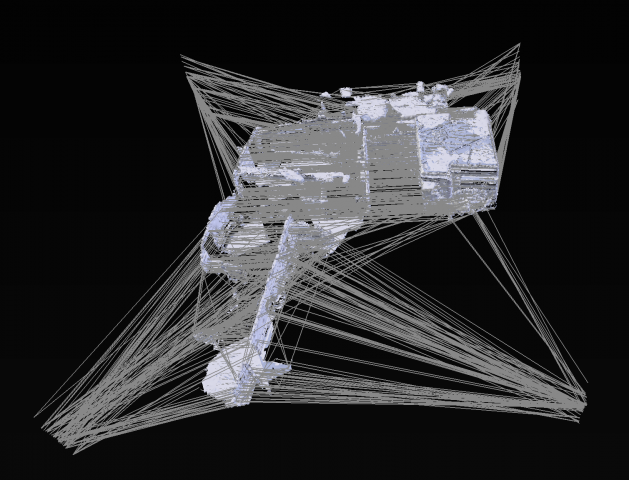
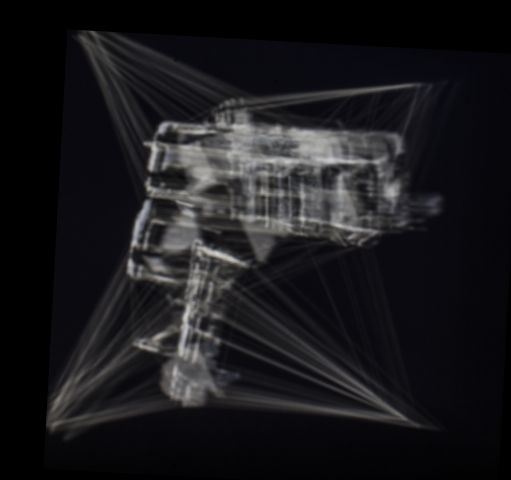
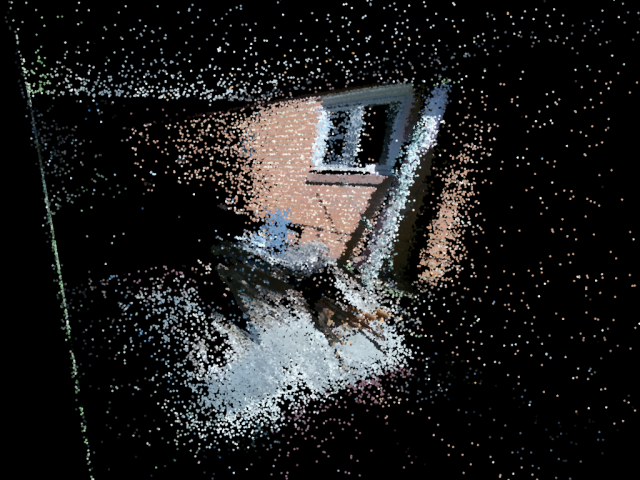
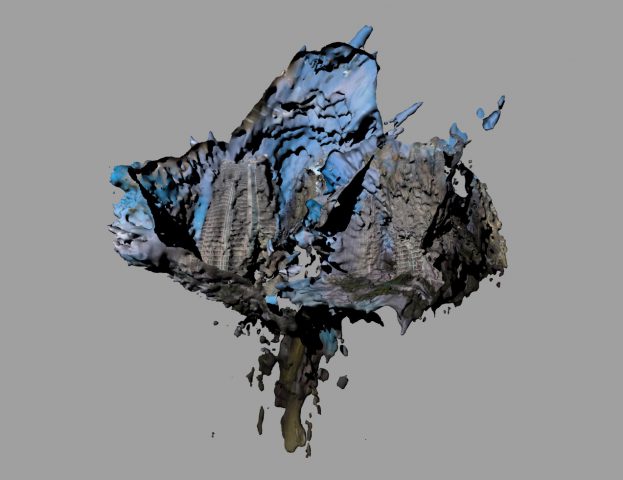
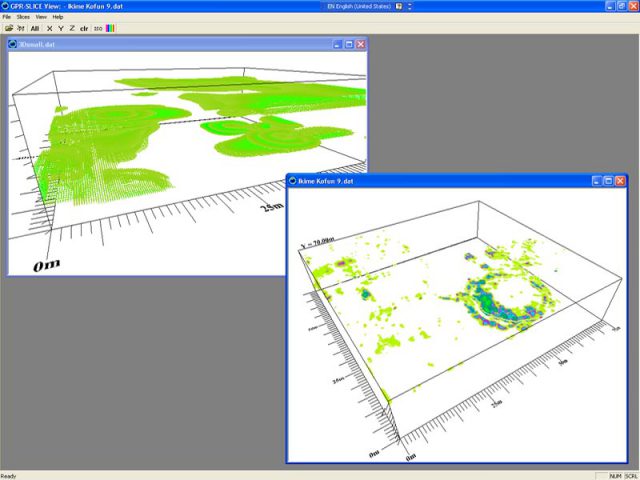
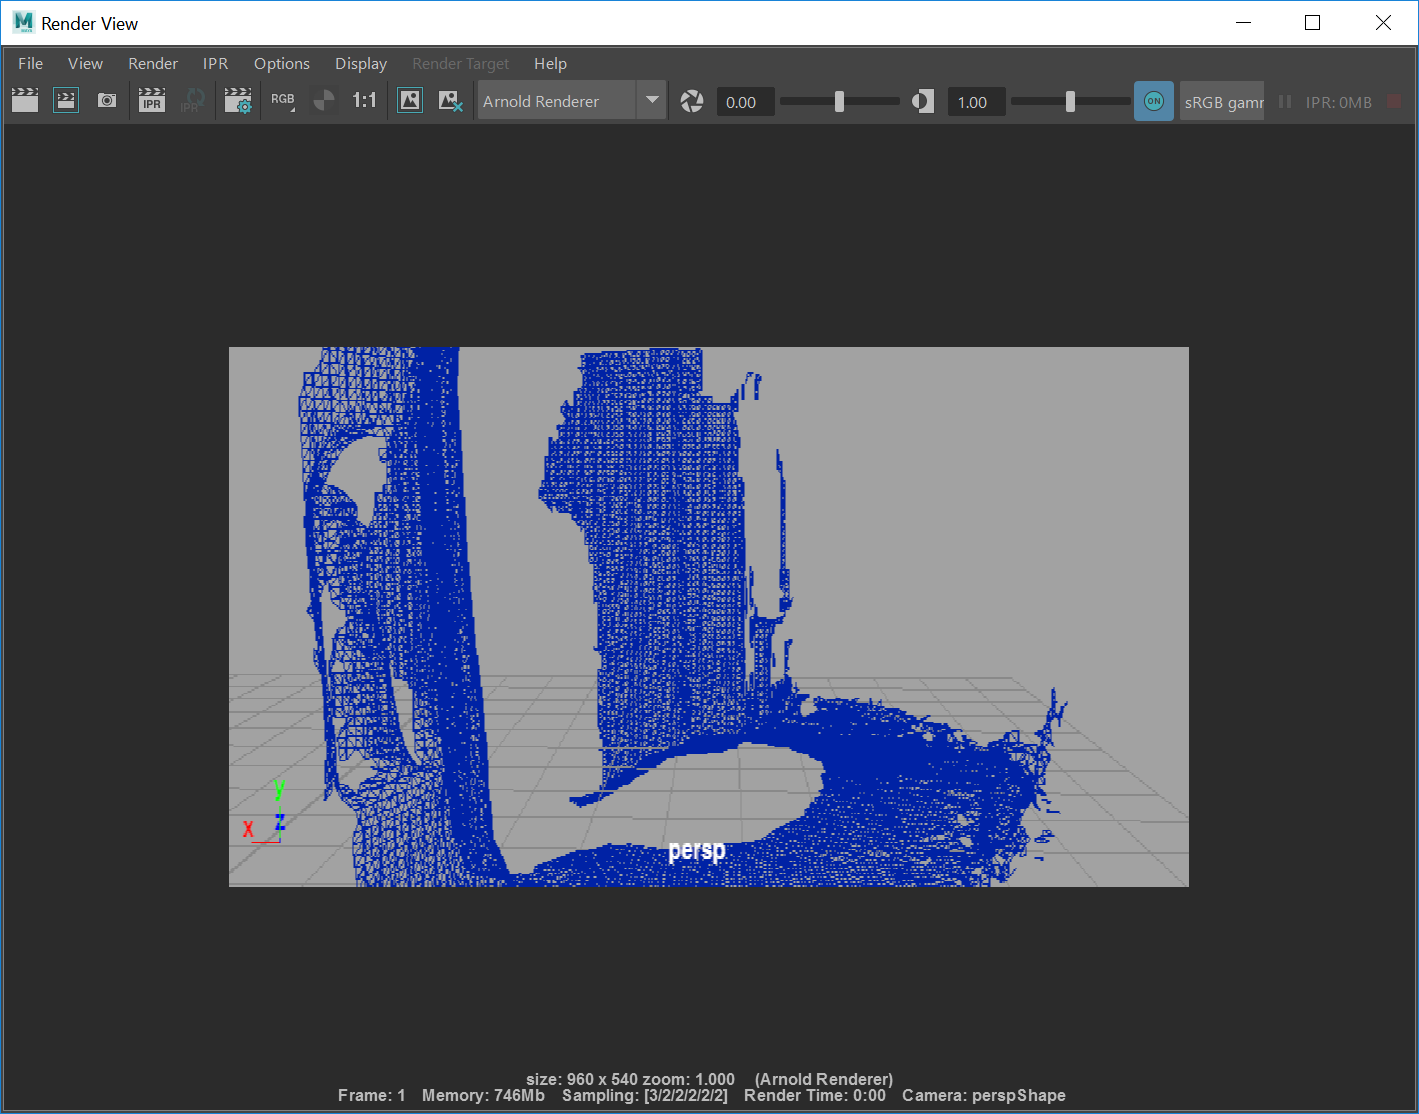
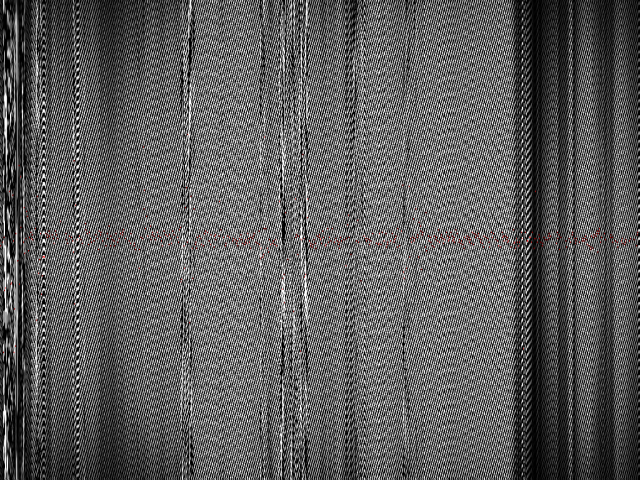
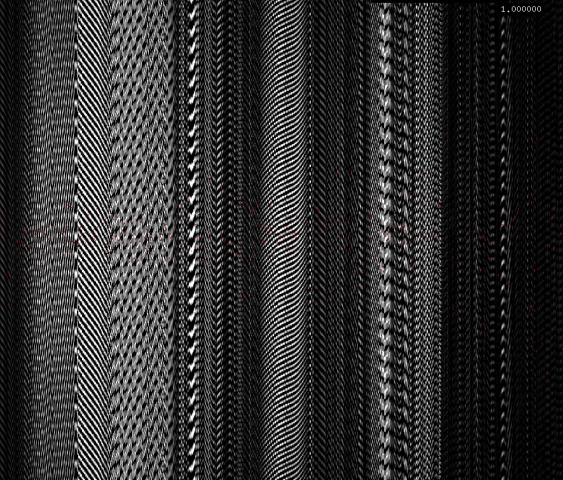
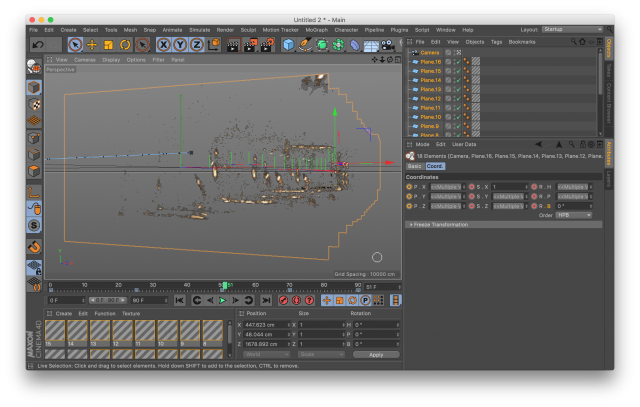
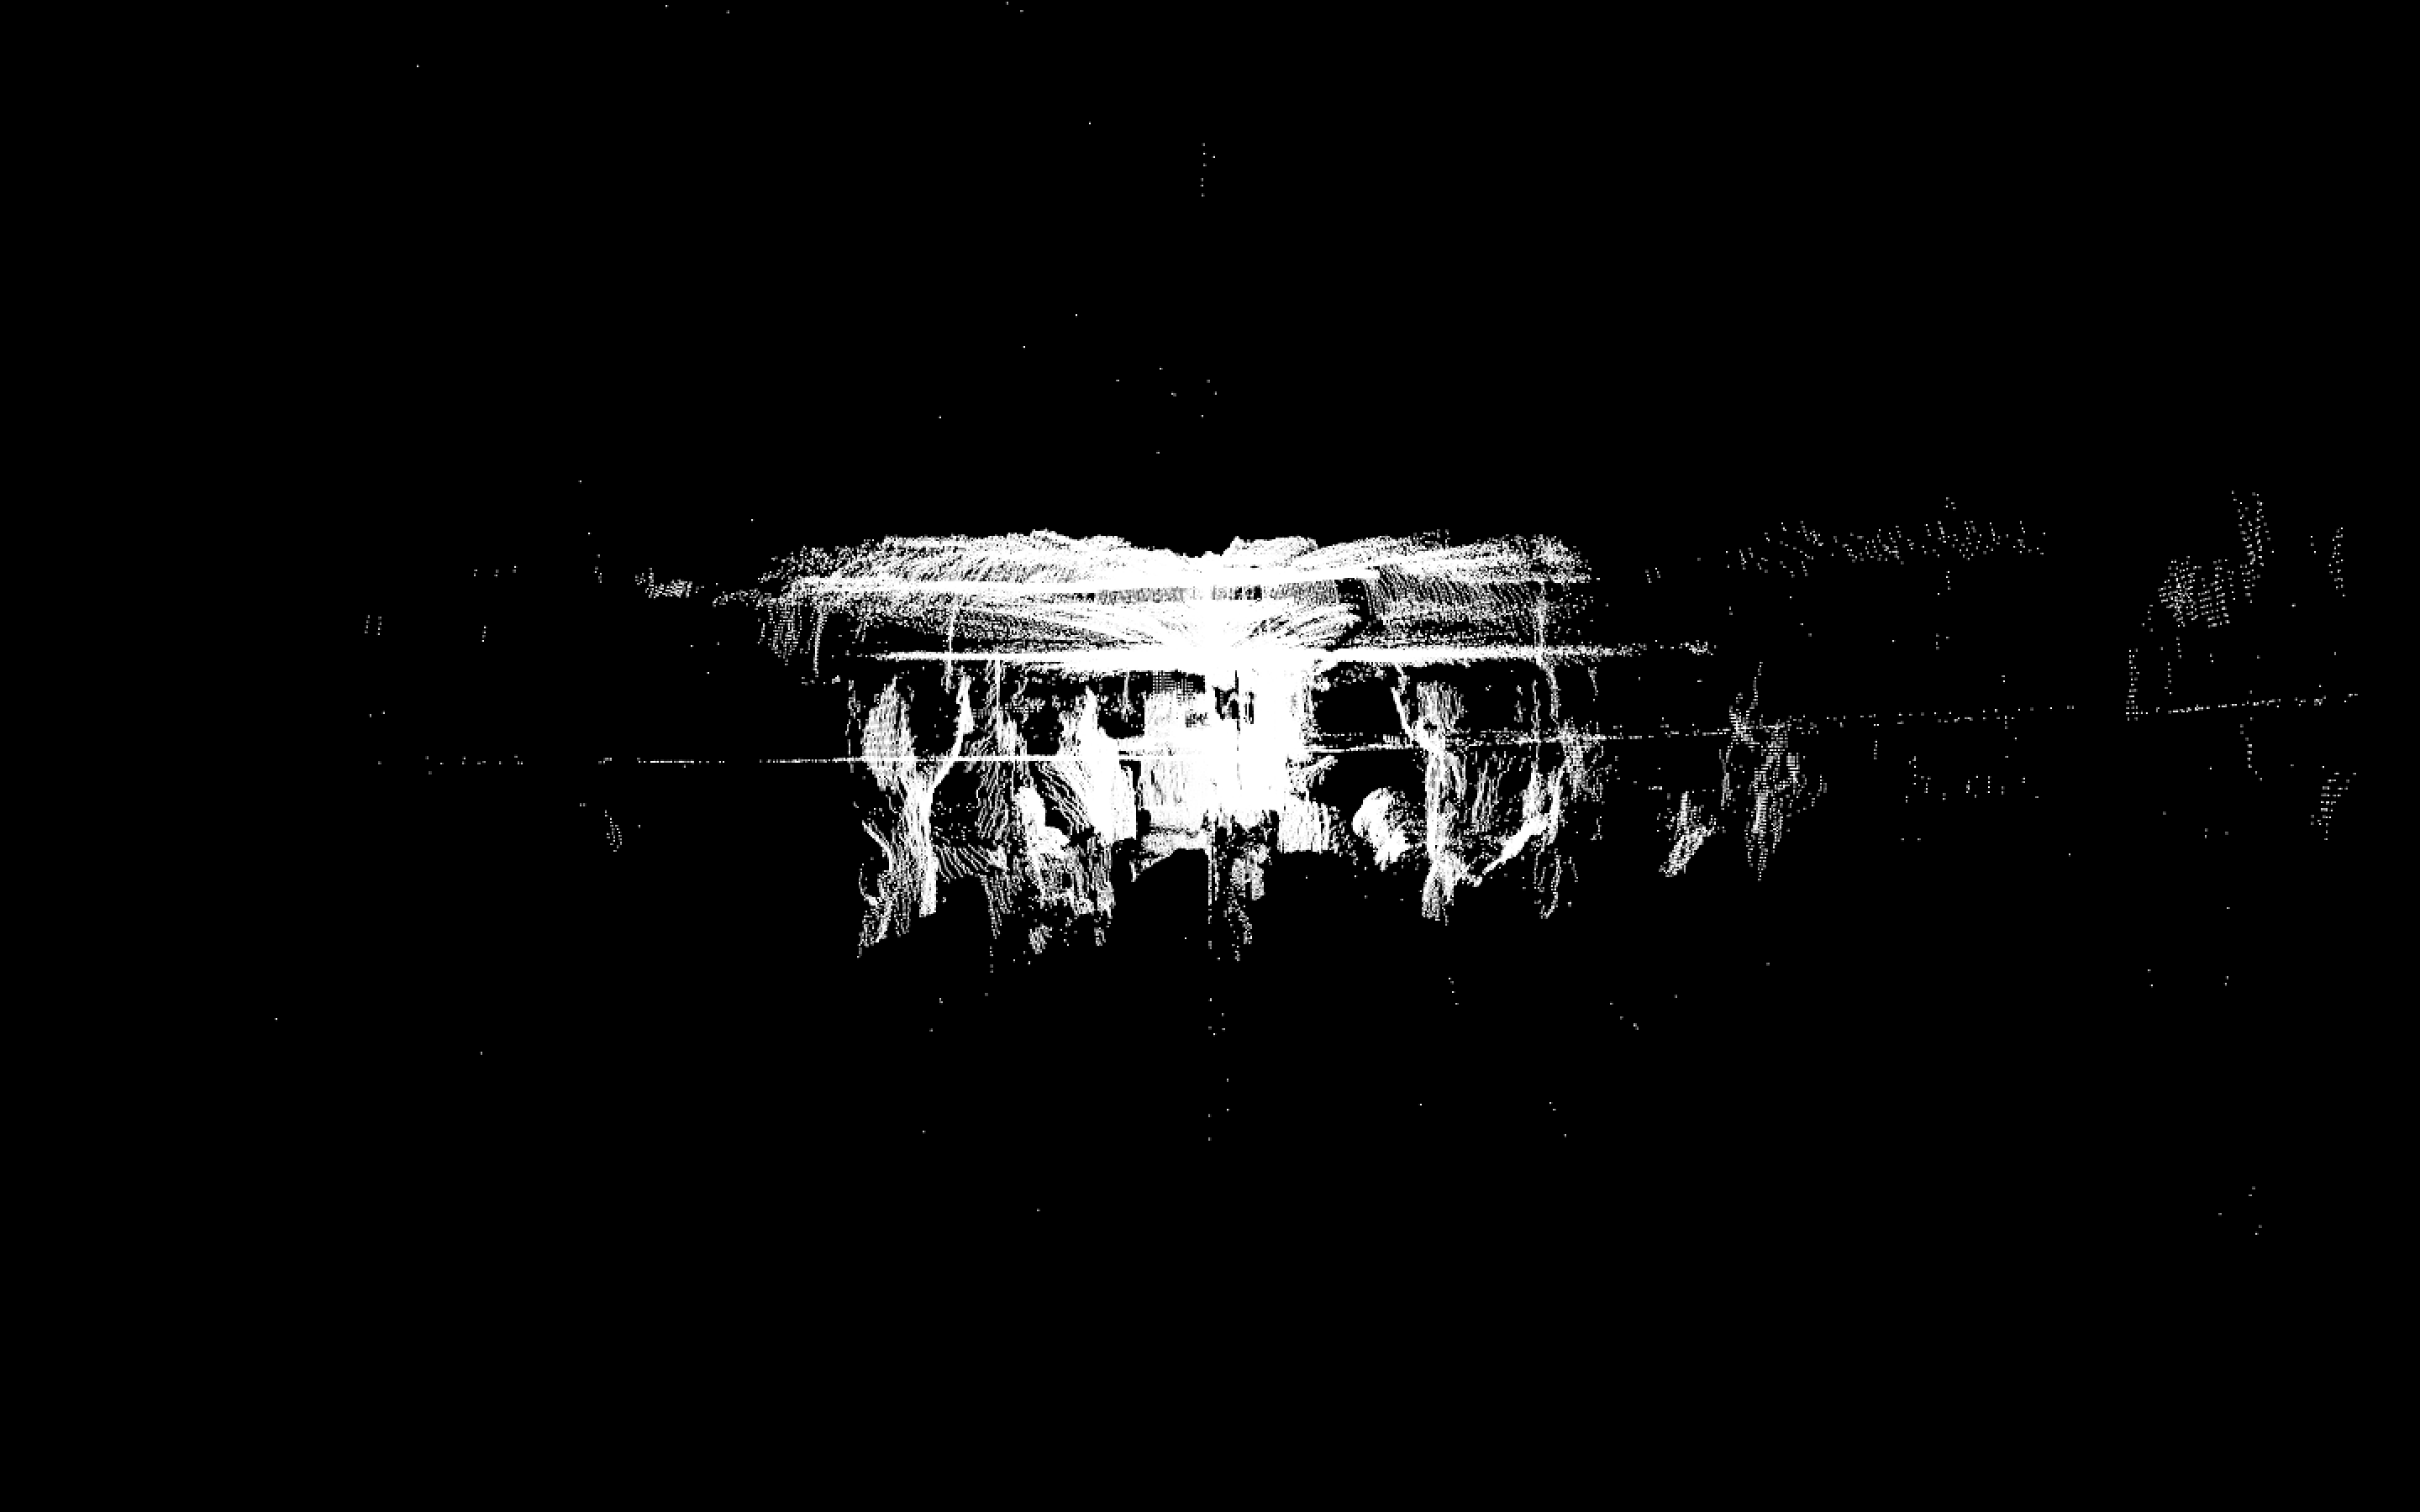
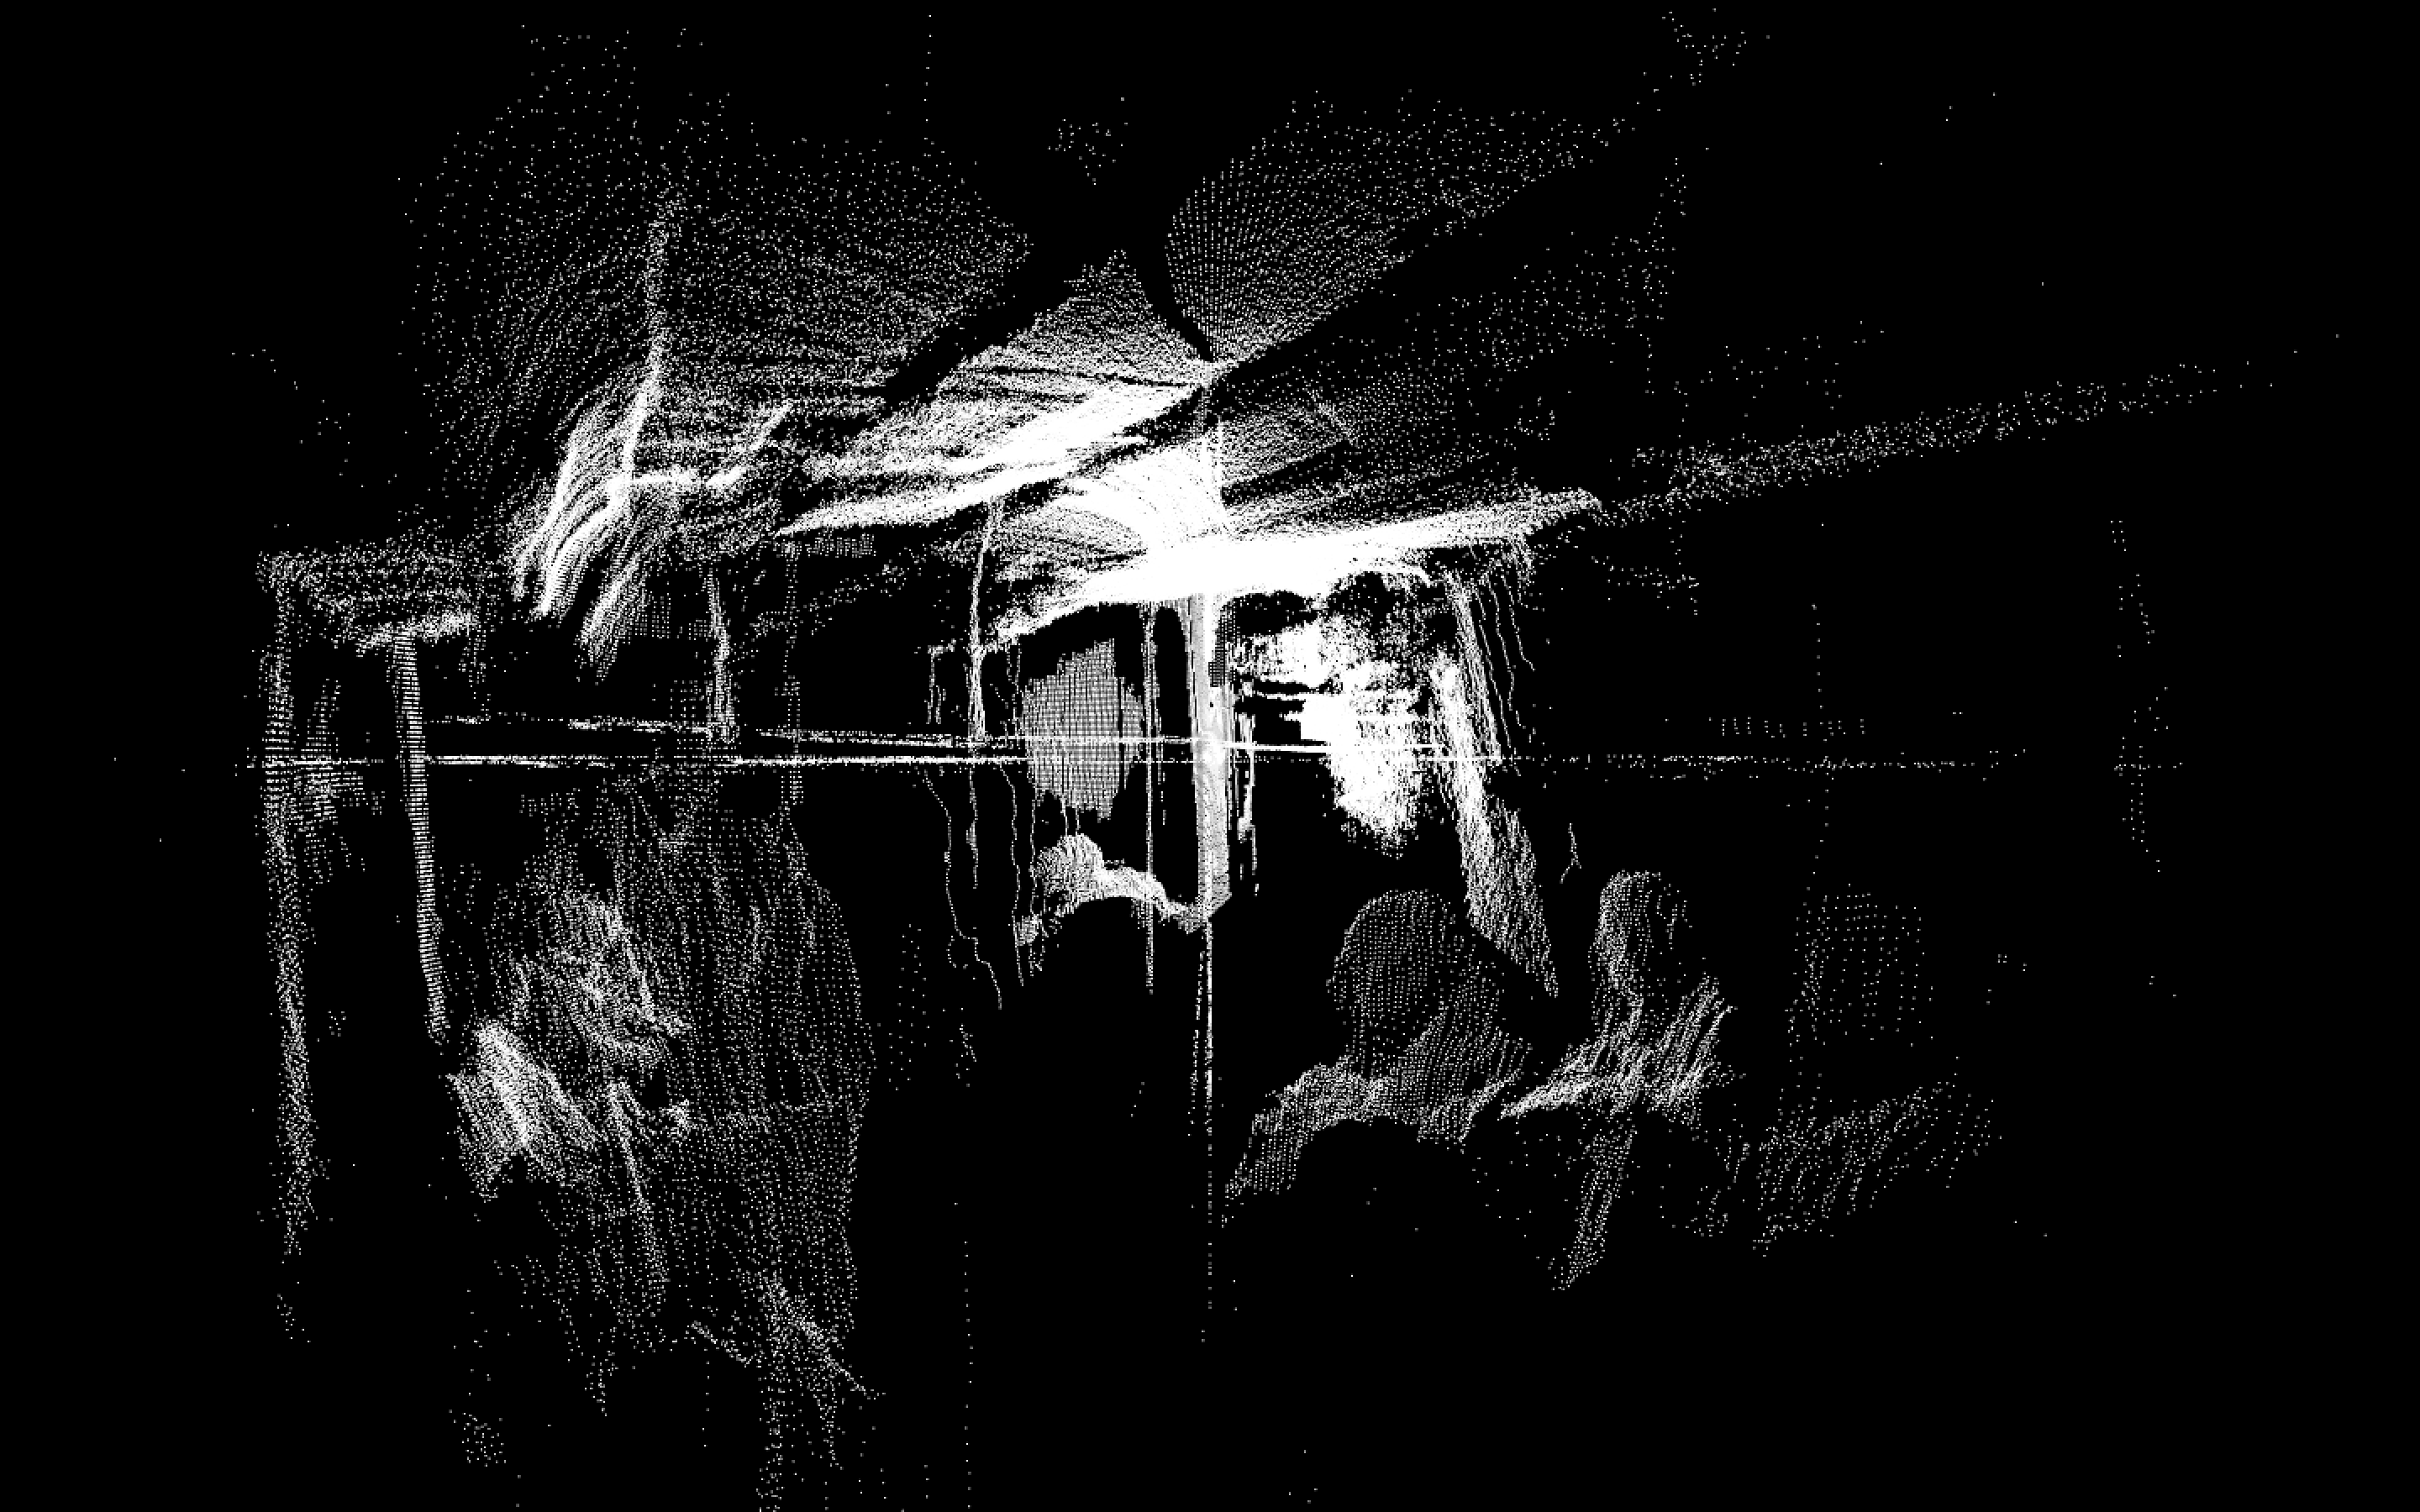
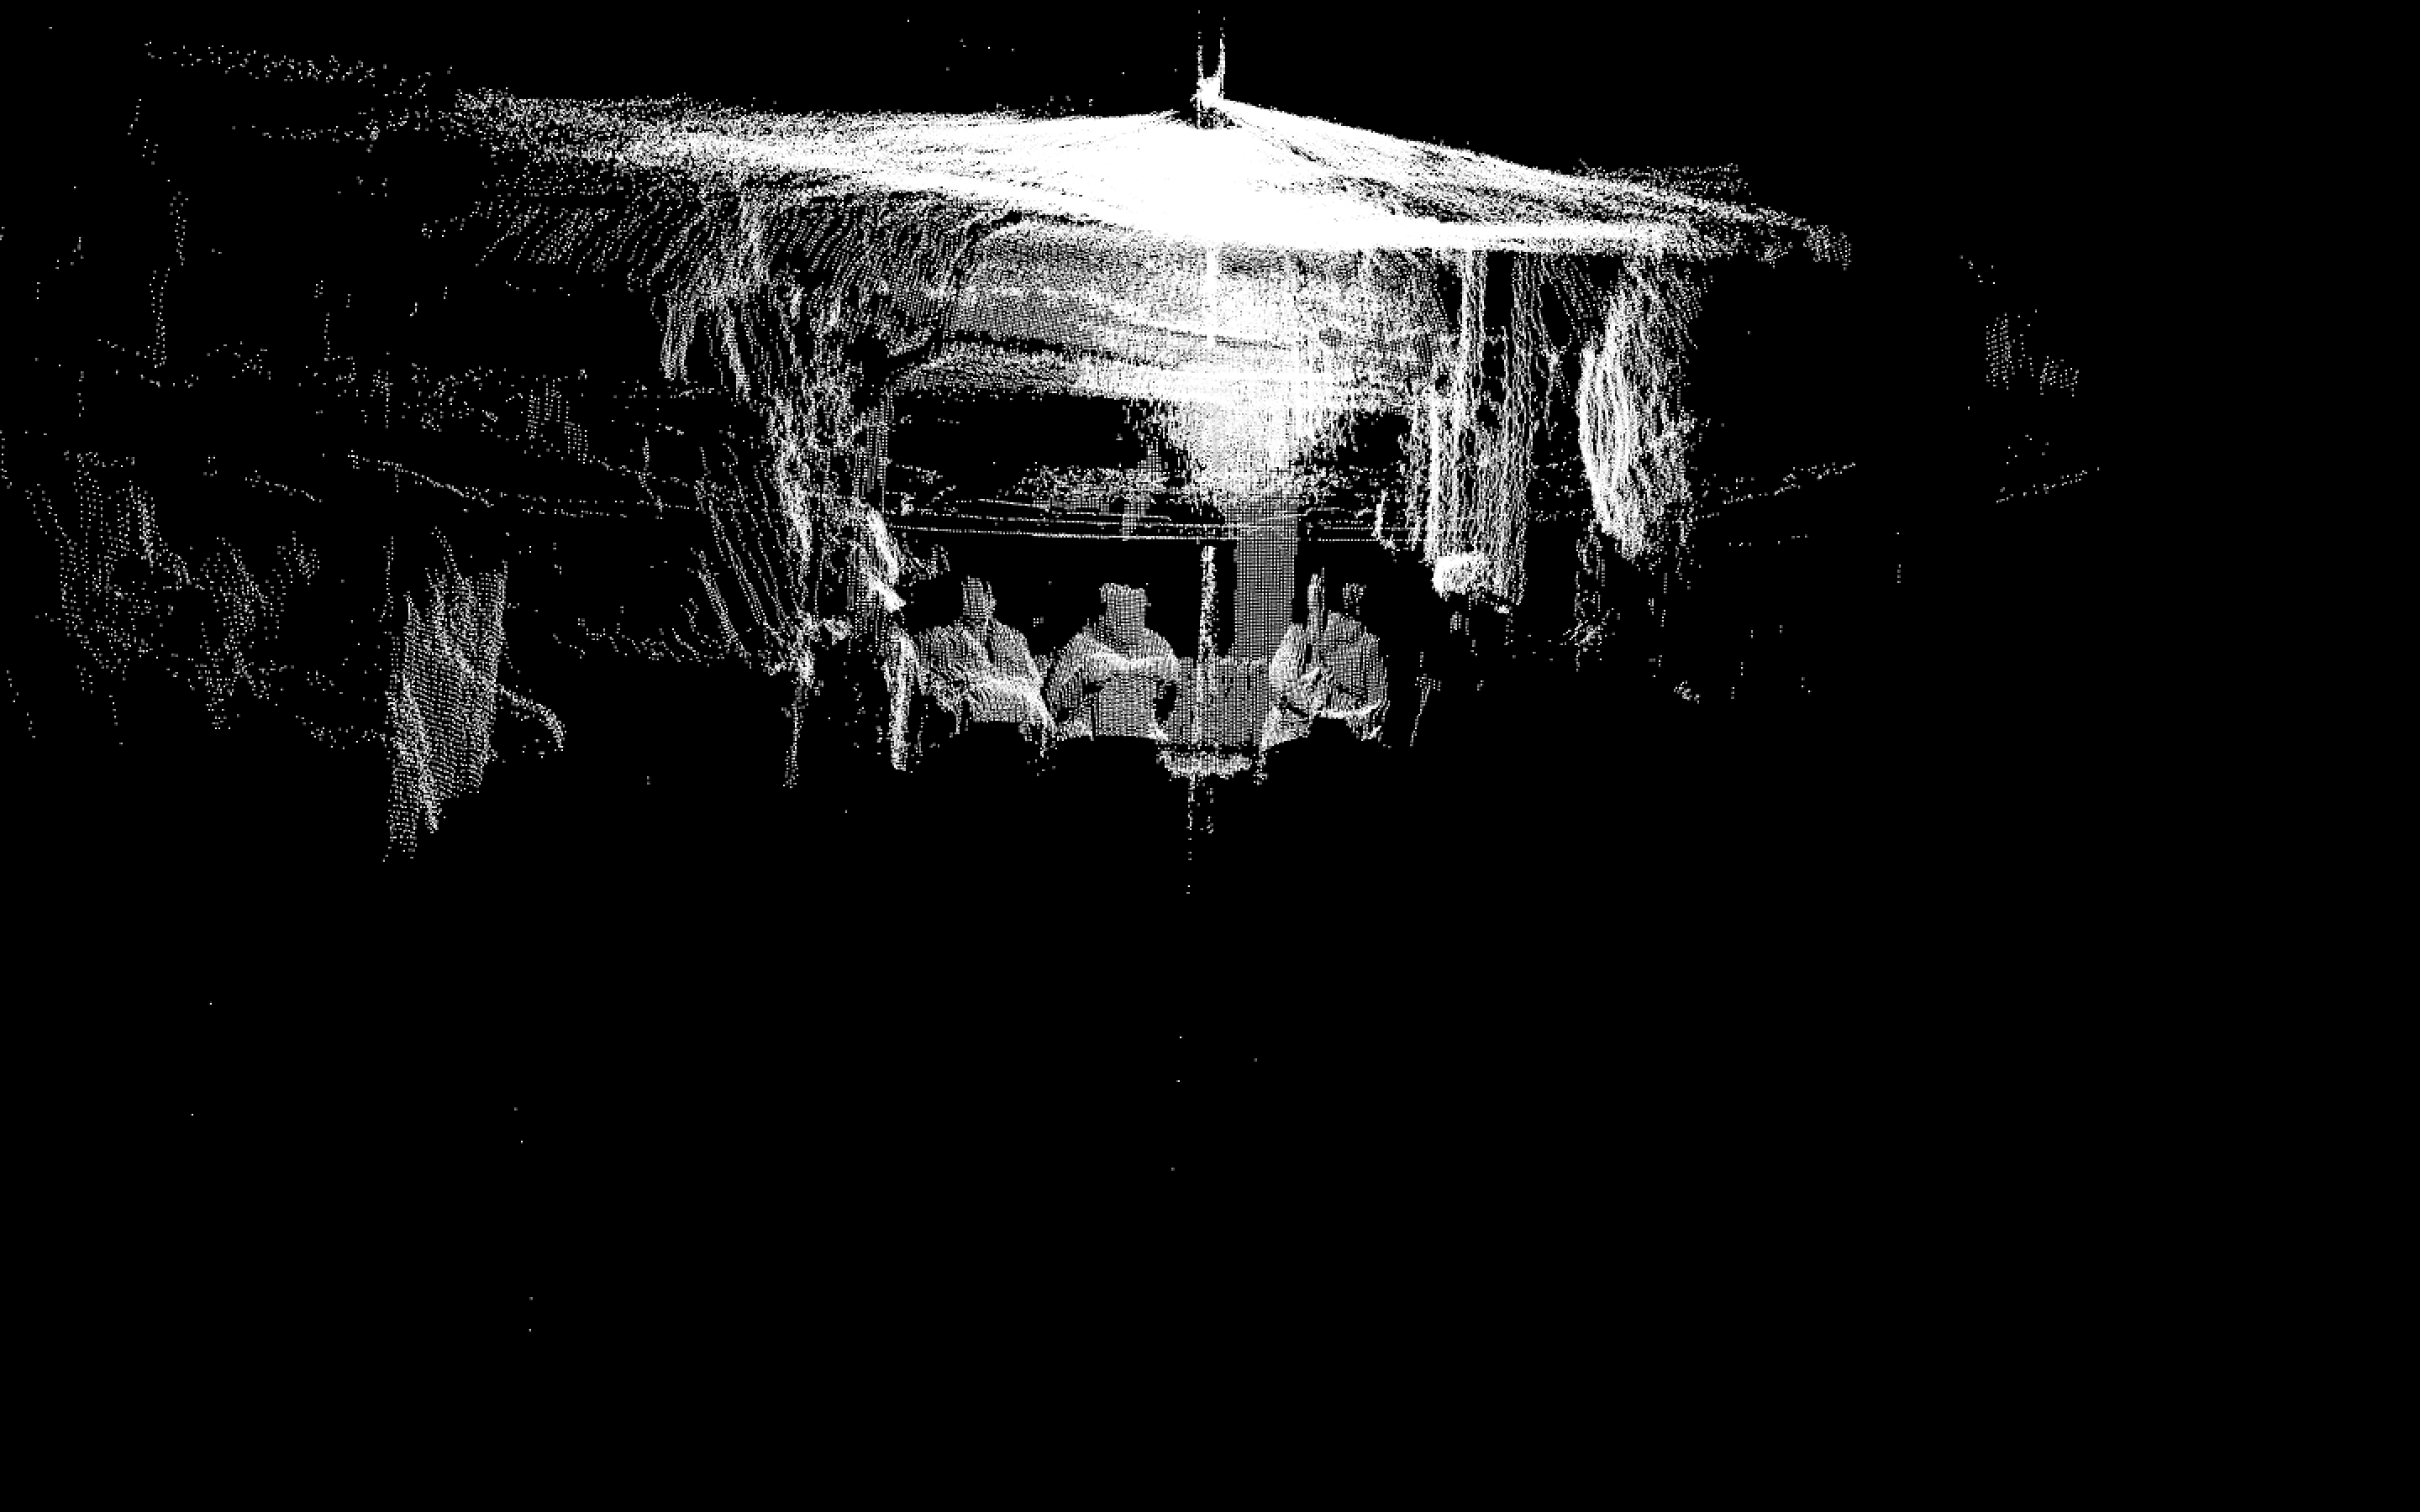
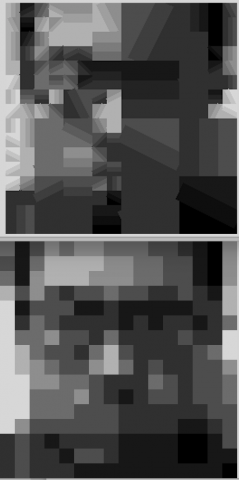
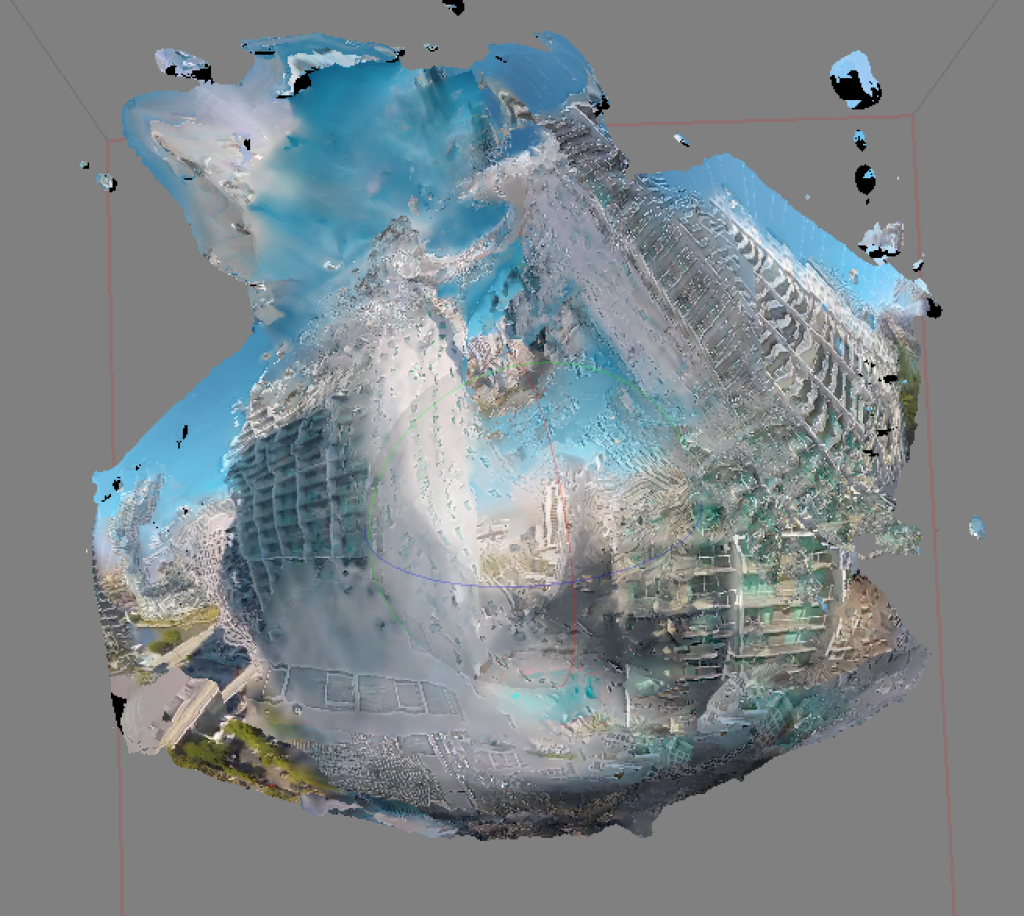
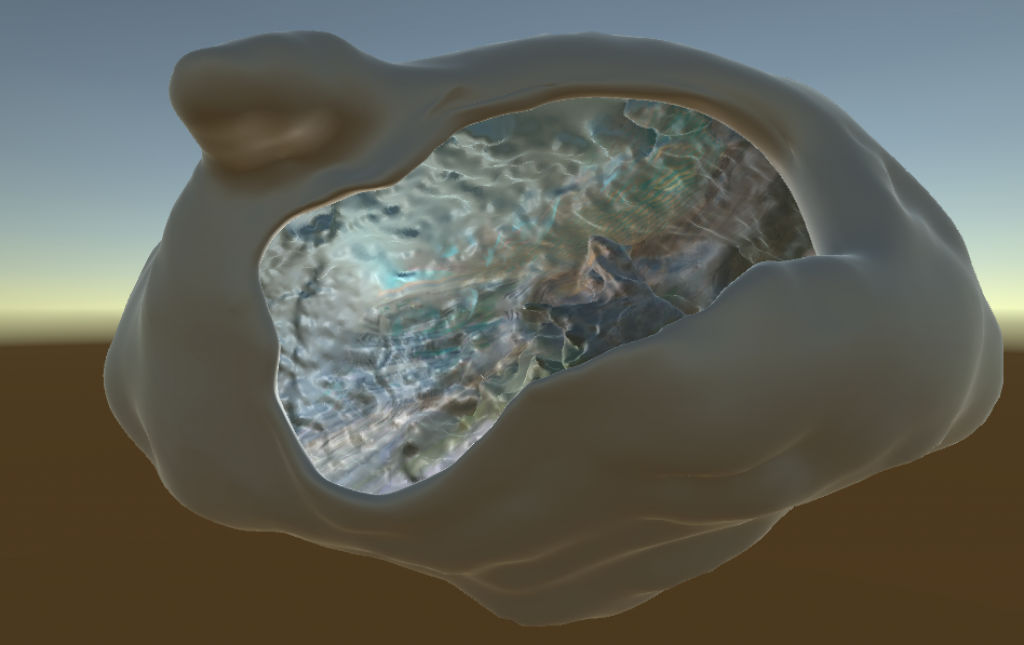
The next is an isosurface rendering.  This is basically what happens if you get a lot of scans in a grid.  If you line up a bunch of the scans, you essentially get horizontal slicing of what you can turn into a 3D model.  This looks something more like this:

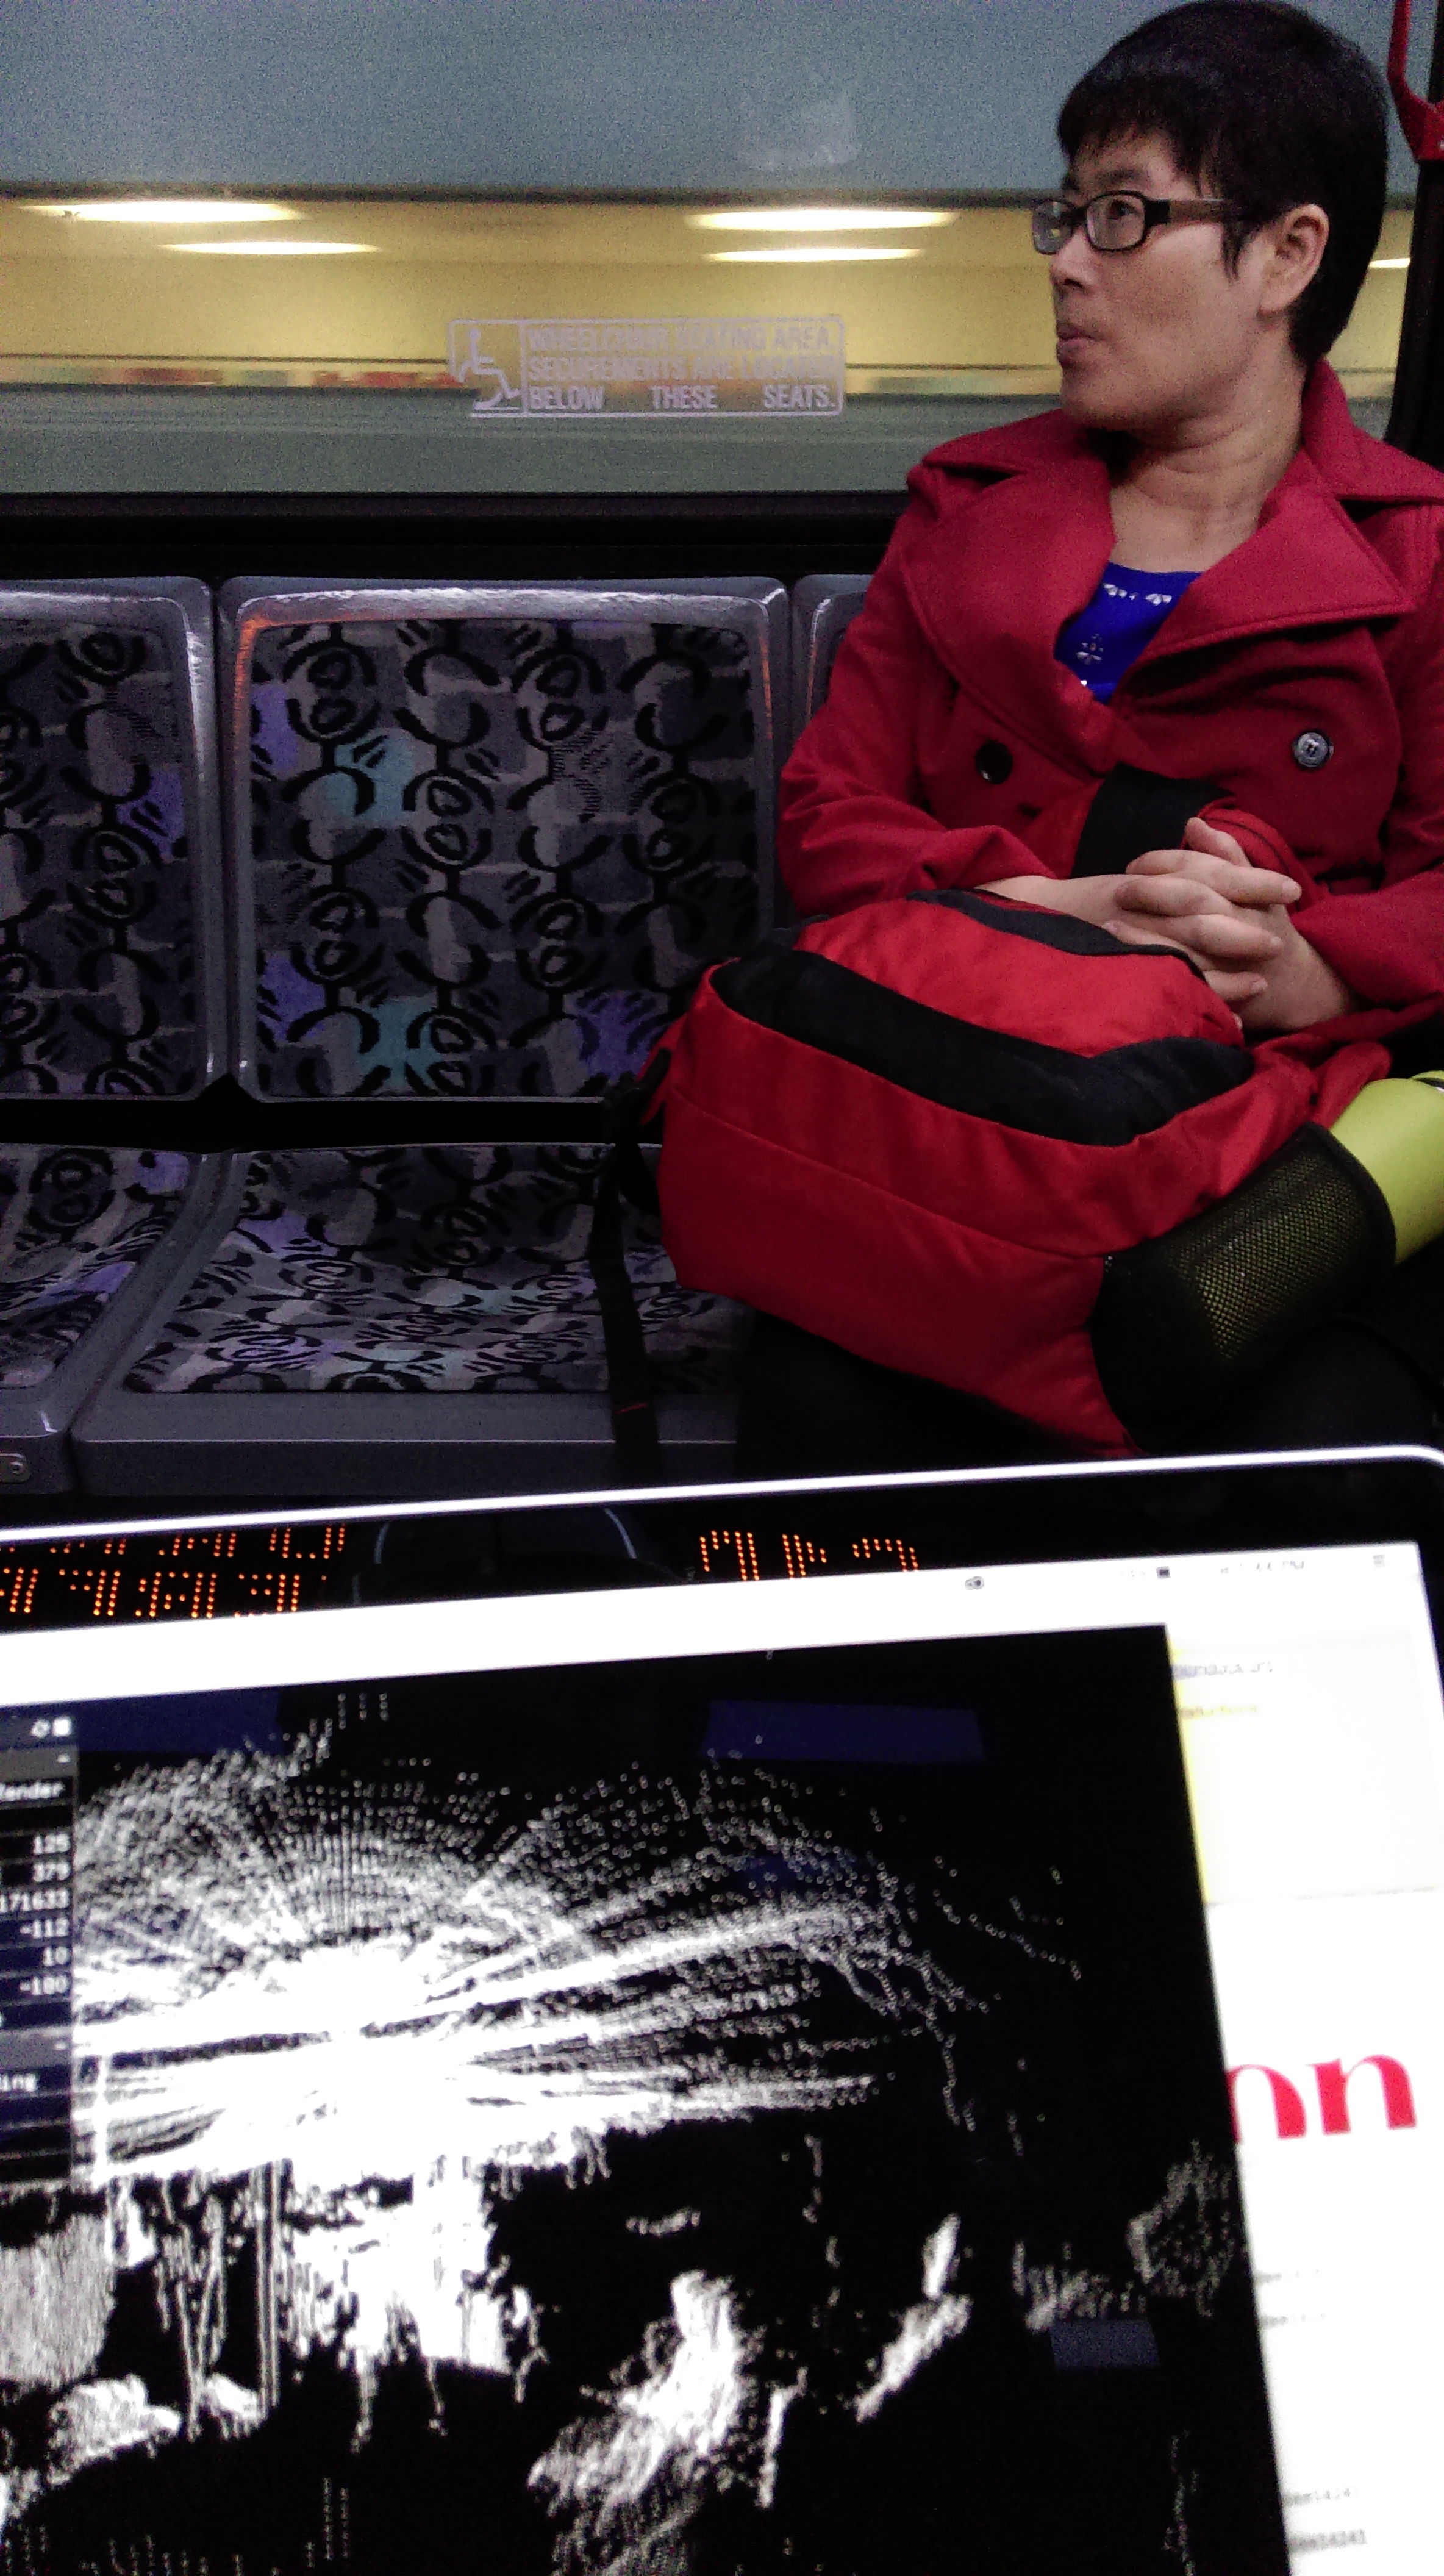
In some ways, as far as events, my event was helping to get GeoSpatial involved, doing research to find interesting places to go to, learning a lot about GPR to ask educated questions, and then having the day that we scanned.  The act of scanning itself is an event which can also be captured.

Because the data was slightly difficult to read at first (Thank you Golan for going through it with me through strange photoshop raw files with guessing bits) and getting very sick, I am slightly more behind than I would like.  I have the data and will be meeting with Jesse Styles on Tuesday to get opinions on how I could turn this into a 3D soundscape.  This is a very difficult project for me because it is big, involves people outside of CMU, and every part of it is completely out of my normal wheel-house.  My next big difficulty is going to be learning how to synthesize this into sound, as I very rarely work with it.  I feel like I am still learning a lot throughout this though.  I really want to thank GeoSpatial for being so kind and sharing their time and software with us!

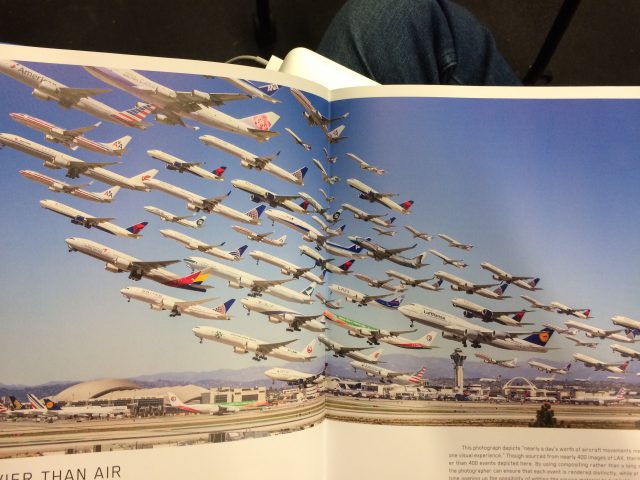
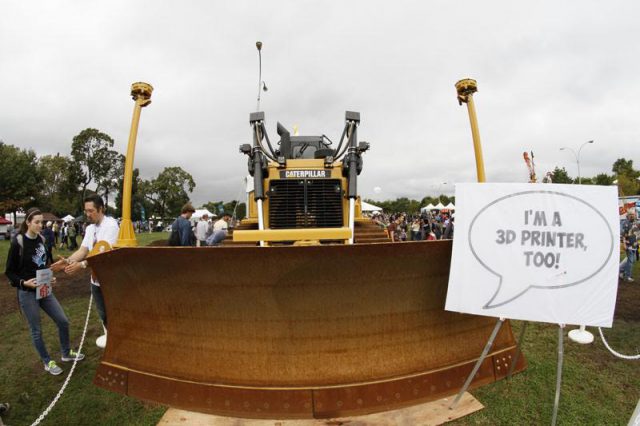
Golan also showed me this super cool artwork made by Benedikt Gross in which he uses computational tractors to create enormous earthworks.  These tractors/bulldozers can be programmed to go in set patterns and can act like a 3D printer/CNC router! 

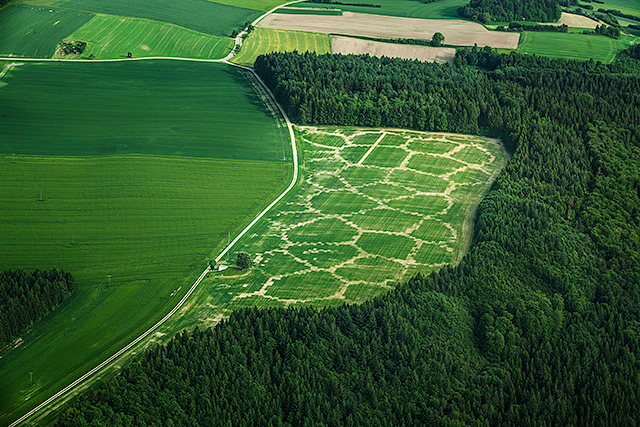
If you are interested in seeing any of the raw data, reach out to me.  I cannot unfortunately share the SubSite software as Google Drive will only allow me to share it with people at GeoSpatial.

a — place

I built an ultrasonic interferometer to map and visualize the sonic texture and echo-pathways of a place. Here is an example output:

In the above image, the x-axis corresponds to the time. Each spot on the y-axis represents a correlation bin, a bright spot represents that there was an echo at that time delay. The above image is produced from the STUDIO for Creative Inquiry ceiling.

why

i wanted to create sonic maps of a space mapping sound qualia that we wouldn’t normally pay attention to.

the final setup

A SoundLazer parametric speaker, connected to a moto pre4 usb audio digitizer. I use two AKG C542BL boundary-effect microphones connected to the digitizer as the sound input. The microphones are mounted 1.6 – 2 meters apart. Note that the SoundLazer is only powered up, but not plugged into any audio output. I then feed the sound input to openFrameworks, using the Eigen C++ scientific library to compute the cross-correlation of the two signals. I then plot the short-time cross-correlation of the two signals on the y-axis, sweeping the ‘cross-correlation brush’ across the x-axis. I also plot a small red dot at the maximum cross-correlation.

It is also possible send back the microphone input into the ultrasonic speaker, creating feedback effects that let you hear (in some way) what texture is there as you scan it (although, then it’s just a sonic interferometer).

he process

Originally, my project was going to be audio-source localisation of footsteps using contact microphones. The audio-source localisation works through computing the cross-correlation of the two microphones signals. The cross-correlation will have a peak at the predicted lag time. From this, we can calculate the extra distance the signal travelled from one microphone to another, from which we can calculate two possible angles the speaker was relative the baseline of the microphones. Using three microphones, we can figure out two angles from two different known baselines, giving us the approximate location of the speaker (including virtual speakers created from echos).

To improve the results, I whiten the cross-correlation using Rohr whitening.

Although I could get the localisation working in the air using the AKG boundary microphones, the contact microphones were not sensitive enough in the low frequencies to pick up footsteps at any distance. Although the boundary microphones could very easily pick up footsteps and movement across CFA, the output wasn’t satisfactory to me (and, every time I explained the idea to someone it seemed less and less interesting).

I realised that by computing the cross-correlation of a signal I send out myself, I would be creating a sonar. I also remembered I had a SoundLazer, and at 2am thought to change my project to using the SoundLazer’s beam to scan the acoustic reflections of a location.

The idea change required almost no change in the code (I ended up using PHAT whitening rather than Rohr whitening).

The following a debug screenshot, the vertical text on the left marks the lag (in samples, and in projected speaker angle) that the y-axis corresponds to.

the results

The following is produced from scanning my room.

The following is produced from the entrance to the STUDIO, the bright white smudges coming from people’s speech.


The following is produced from scanning the scene outside the window of the STUDIO for Creative Inquiry at noon.

The following is a hardwood table with other people sat around it.

The following were produced from scanning the north foyer of the College of Fine Arts.


UR5: Painting the Aurora Borealis

Equipment:

-UR5 Robot Arm

-Canon Camera

-Arduino

-Neopixel Ring – 24 LEDS

Objective:

The most astounding thing about the robot arm is how accurate it is.  It can move in specific paths down to the millimeter.  I thought it would be interesting to utilize this to “capture” something by accurately recreating it.  Without using a pen and paper to, I decided light painting would be an interesting way to recreate something using the robot arm.  I chose the northern lights because as seemingly random as they are, every image has a trajectory.  I thought it would be interesting to accurately recreate something as random as the northern lights.

Workflow:

  1. I used Openframeworks to do analysis on the various frames of the Aurora.
  2. I took the baseline that I extracted and used that as the path of the robot.
  3. Lit the Neopixel according to the gradient of the aurora (height of the Neopixel ring being proportional to the height of the aurora)
  4. Colored the Neopixel ring in an aurora gradient.
  5. Took long exposure photograph of the Neopixel ring, moving along the baseline.

Original Gif:


Aurora Filtered:


Aurora baseline and upper bound detected:

Light Painting Gif:


iciaio-place

I had a lot of ideas for this project. I  tried to make my fishbowl into a camera obscura, then I tried to mod my Sims 4 game to track the sims location. I settled on creating a panorama of the bridge on Schenley Drive– it’s covered in locks that signify love. I have very limited experience  with photography and photo editing and photo stitching so I wanted to learn about the process.

I started by using a telephoto lens and a tripod. I moved the tripod along the sidewalk across street. This would minimize distortion. I made two passes along the bridge, moving towards Oakland to capture the top part, and back towards Schenley to capture the bottom. Unfortunately as the sun dipped behind the clouds the lighting was a bit inconsistent between photos and because the sidewalk was uneven, distortion became inevitable.

I planned to use Autopano, but because a large number of the photos contained similar landmarks, the Autopano algorithms were confused and stacked the photos on top of each other, ignoring the location of the locks. I used Photoshop instead, which was more successful.

My final plan was to create an annotate-able photo of the entire bridge so that the owners of the locks could identify and write something about their locks.

Quan-Place

Full process

First Try —

I went to a large tunnel for my first iteration of steel wool photography, with the intent of creating a spacial mapping of layered pictures. A singular photo looked like this:

and the stacked photo looks like this:

Second Try —

I realized how distracting those circles were in long exposure, so I wanted to eliminate them. One option was photoshop, but a cleaner and more interesting method was with the use of video. This is one ‘slice’ of the tunnel that I chose to map.

I did this every 5 feet for the entire length of the tunnel, and then texture mapped these videos with alpha values  on planes in space.

Final Result—

Vid 1

Vid 2

mikob – place

My portrait project developed from a question of “How much will I be able to learn about somebody else?” This project inspired me to question whether the experiences and memories we regard as personal, could be predicted or asked by a stranger.

I always felt that password security questions evoke interesting nostalgia and upon research, I picked out the most common security questions relevant to a place. I picked out two questions, which suggested more ambiguous answers.

  • In what city were you born?
  • What was the house number and street name you lived in as a child?
  • In what town or city was your first full-time job?
  • In what town or city did you meet your spouse/partner?
  • In what town or city did your mother and father meet?
  • What was the name of your elementary/primary school?
  • Where were you when you first heard about 9/11?
  • Where were you when you had your first kiss?
  • Where did you go the first time you flew on a plane?
  • Where did you go on your honeymoon?
  • In what city or town does your nearest sibling live?

I used Amazon’s Mechanical Turk to collect answers from these questions and see if there are any patterns or common answers. I was able to collect 181 answers and trimmed out some, but it was not as much as I anticipated due to the short amount of collection time.

I initially thought about making a map or a visualization but Golan suggested making a book due to the amount of data I have. I wasn’t sure about the book idea at first, but I realized how having a collection of these answers can be a mesmerizing narrative as well.

Some inspirations:

The Sheep Market     Paper Airplanes by Harry Smith


First Kisses

Download PDF

Local PDF Copy: book_kisses

hizlik- Place

Update: As of 2020, an updated documentation for this project is now on my website at hiz.al/mexico.

For this piece I searched all over the world for interesting patterns viewable from a birds-eye perspective. My tool of research included Google Earth and a few “aeronautical photography” compilations on the web with interesting ideas for locations. Below, you can find some of my other tests of locations, but for the final piece I decided to go with a subsection of Mexico City. I chose this because it was geometrically compatible when duplicated, and there were plenty of nearby locations in Mexico City with appropriate “filler textures” that could help reduce the replicated/patterned look of the final composition, and allow for some randomness and uniqueness. I also found the octagonal shape to be quite pleasant to look at.

Final Image

In order to create this piece, I first used photo stitching (using tools similar to AutoPano to stitch multiple photos together to create one large hi-res image) to create a high resolution rendering of the “square”. I scanned it top-down block-by-block to gather the screenshots to be stitched. Here is the original location in Mexico City:

After creating the stitched image, I started duplicating it and rotating it (to break up patterning) manually, in an ever-expanding state. I filled gaps in with other parts of the city and blended any seams manually as best I could. Here is a close-up of the block duplicated 4 times.

After creating the composition, I started going in and finding obviously repetitive locations and clearing them up to be more unique. Unfortunately I did not have time to finish this process, and I didn’t have the chance to change the center of each octagon (the most obvious repetition at this state), as well as other small locations. Here’s a gif portraying the before/after of the “cleaning” I did:

Lastly, after giving the entire image a overlaid texture to simulate different lighting conditions (from clouds/atmosphere) and scale, I animated a short video using Premiere, to demonstrate the detail that you can zoom in to. The final form of my project is a 2D image, preferably printed to a very large scale so the audience can look at it from afar, or walk closer to it to see detail. The video was meant to replace that for digital purposes. Unfortunately, the final image is too large to be uploaded online (500MB jpeg file).

If I had time, I would do more locations and perhaps automate (write a computer script) to generate infinitely expanding versions of cities. One such city I think would be most suitable for computer-generated cities would be Barcelona, as seen below.

Here are some other locations I considered, and my preliminary patterning:

Mexico City

Barcelona

France

N.Y.C.

L.A.

Mexico City

cdslls-place

LIDAR PHOTOGRAPHY (a naturalistic observation)

(I didn’t realize until it was too late that I forgot to deinterlace the video before exporting.  A better quality version will be up soon.)

I’ve always loved people watching in public transportation. I find people’s physical behavior incredibly revealing. This was my main source of inspiration for this project: Trying to capture the topographical organization of public transportation and people’s seating and positioning preferences.

To capture my space, I decided to use a lidar scanner, which provides some sense of anonymity and the physical ability to move through space and the people inhabiting it. It felt surprisingly intimate in more ways than one:

  1. People were curious and unintimidated, unlike what I had originally feared.
  2. The shots provide a glimpse into a commonly mundane activity. You wan notice phones, people looking away from the crowd, agglomerations and separation of groups etc.
  3. This capture walks the line between distance and proximity with strangers.

I was hoping to capture my place in a completely naturalistic way, without any interference from the observer. In order to do so, I needed to find a way to exclude myself from the 360° (in reality 270°) scan. I therefore tapped the lidar rig, which was created by the amazing Ben Snell (who also wrote the OpenFrameworks program I used), to a Carnegie Mellon Civil Engineering hard hat. I then proceeded to walk around with a 10 pound Uninterruptible Power Supply in my backpack connected by multiple wires to my laptop, arduino and additional usb port. Golan was nice enough to help me destroy the battery beeping (that occurred every 10 seconds) by opening the battery and hot gluing the mike. Beeps and wires sticking out of backpacks usually aren’t very appreciated on public transports.


Bierro-place

THE PULSE OF SHIBUYA

I decided to capture a place that has been fascinating me ever since my first trip to Japan: Shibuya crossing in Tokyo. The amount of people who cross the road in any direction (almost feeling too disorganized for Japan) is just huge and there more than ever you can feel that Tokyo is one of the most densely populated cities in the world. I wanted to somehow capture the motion, the dynamics, the hustle and bustle of that place.

I quickly discovered that there was a live stream of that crossing which could be accessed on Youtube at any time at the following link.

I was inspired by the work of Kyle Mcdonald, who managed to get a sense of the life in Piccadilly Circus in London thanks to a webcam (http://www.exhaustingacrowd.com/london), and decided to use this feed as my input.

Getting the Live Cam… On Windows!

The first part of my work, which actually lasted way longer than I thought, consisted in getting the live stream from Shibuya to my computer. This was not trivial: The Camera IP was not available to the public and Youtube doesn’t provide a way to access it due to its privacy policy. I somehow managed to get the HLS URL of the video through the command-line program “Youtube-dl”. However, this link didn’t seem to work on regular video decoder such as VLC (only the first frame showed up). After days of tweaking with this, I finally used another command-line software called “FFMPEG” to stream back this link to a port of my computer using a UDP protocol.

The stream was now available on my computer once I decoded it through VLC. You can see in the following picture that I actually get the camera feed more than one minute before Youtube published it.

If VLC was able to decode the video through UDP, I now had to do it in OpenFrameworks. After having a few unsuccessful attempts, and more time spent than I should have, I decided to move to the Computer Vision part and to use a 90 minutes recording from the webcam that I got through FFMPEG.

Future work will consist in either finding a better protocol than UDP to stream back the camera feed, or decoding the UDP stream in OpenFrameworks, perhaps using the same method than the one used in the ofxIpVideoGrabber (https://github.com/bakercp/ofxIpVideoGrabber) but using UDP protocol (and OfxUDPManager) instead of HTTP.

What to do with it

– Getting the position of the people in the video? Took measurements of the place through Google Maps

– Played with OpenCV reagular addon. But contour finder didn’t provide the information I wanted. Too complex to filter the important information

– Addon ofxCV from Kyle McDonald.  Windows version GML not good. Install the previous version from Kyle McDonald. Tweaked and got it to compile

– Started monitoring two factors: speed and movement. Differentiate cars and people. Will have to be adjusted based on the time of the day. But nice overview

– Output. Pulse. + Ghosty movements


fourth-place

A compressed version of the final image. Click to open.

The goal of my project was to capture the entire length of Baum Blvd. and present it in a single image. The image is about 41 feet long by 4 inches printed. It’s dimensions are 150454×1200 pixel’s. The aspect ratio is about 125.

Baum Blvd exists between, through, and across many different neighborhoods in Pittsburgh. Some sections function metaphorically as a living timeline of the history of the city while other sections truly represent the living and always evolving city as it changes. Portions are always under construction and from one end to the other, a mere 1.6 miles, you will find a little bit of everything.

Pittsburgh is often talked about via neighborhoods. “Shadyside”, “Easy Liberty”, Bloomfield”, “Oakland” and so on all have their own charms, their own ideas, their own subcultures, their own image – in conversation at least as much as in reality. They are at best, geographic regions and at worst, damaging stereotypes. I posit these labels can do harm. Underneath the labels, the images, of the neighborhood is a city both simpler in it’s humanity and more complex in it’s construction. By presenting Baum Blvd. captured in a single image, I hope to challenge the language that so often dictates how we conceptualize this city.


I took over 800 images, about one every 10 feet or so, down the 1.6 miles of Baum Blvd. I used Kolor Autopano Pro to take chunks of the images, usually between 3 and 26 at a time, and stitch them together. I then assembled these in Photoshop. I focused on editing to achieve a smaller number of apparent stitches, as opposed to editing the “worst” stitches to be less noticeable. Where the stitches function well, you will not notice. Where the stitches fail, it’s very apparent.

I laser cut a simple scroll for ease of storage and viewing. I wanted no accidental religious connotations (this is not a document to be revered) so I did not craft handles and tried to make the scrolls as simple, unobtrusive, and unnoticeable as possible.


For the curious, below are some of the failed stitches.


Below is a side-by-side comparison of the software’s automatic attempt, left, and a manual intervention, right.

Refinement to the stitches involved selecting different sub-images to stitch, deleting “bad control points (trying to keep those that lied on building facade’s at the cost of the quality of the road), and manually rearranging images. Smoothing of building edges and such can be done in Photoshop as well. It’s important to note that these are impossible images, and there is no “correct” version.


ngdon-Place

Conversion of image from and to barcode.

photoBarcoder from Lingdong Huang on Vimeo.

Inspiration

When Golan showed us his barcode scanner, I felt that there should be more barcodes in the world. So I thought about the idea of taking photos right in barcode format, printing out and pasting the barcodes everywhere so anyone with a scanner can view that picture. My project will not be a documentation of any particular place, but rather an interesting device people can use to observe places.

A rough calculation told me that it would take more than 50 barcodes to contain an average image. However I’m just so curious about the idea so I tried it out nevertheless.

Compression Algorithm

One barcode only holds a tiny bit of information while an image contains huge amount of information. Compression of images so that it can be contained within reasonable amount of barcodes is the key problem.

I used/developed a series of compression algorithms based on the idea that compression of data is elimination of redundancy. I try to pick out the repetitions, place them together, and describe them in a concise manner.

1. Image Compression

At first, I turned the images into greyscale, so there’s only one channel to compress instead of three.

I thought about the problem from three perspectives. First, I can group pixels that are adjacent to each other and have similar values into a “patch”.

I did this recursively:

  • The program first divides the whole image into four patches.
  • For each patch, if the standard deviation of pixel values in it is below a certain threshold, we’re done with that patch.
  • If not, further divide that patch into four patches, and repeat the same procedure with each of them.
  • If the standard deviation of all patches are below threshold, or that we’ve reached the pixel size unit, we’re done.

I then thought about a more efficient manner of describing image data then recording pixel/patch colors. For example, if the image is that of a green cat on a banana, and the computer already knows what that looks like, we just write down “green cat on a banana” instead of describing each pixel in that green cat picture.

So the idea is that I can teach the computer about predefined “patterns”, and for it to reconstruct the image, I can simply tell it which “pattern” to use.

I categorized eight possible patterns that divides a patch into an upper half and lower half, each defined by a function.

Then the program tries to apply each function to all the pixels in the patch. The function that makes the difference of average values in the two halves the greatest is the “best” function. The corresponding pattern ID is then recorded.

When rendering, gradient is used to fake smooth transition between the two halves in a pattern.

Last I thought about the compression of actual pixel values. Normally if say we have 3 bits, then we can express 2^3=8 different pixel values, if we have 8 we can express 256 of them, etc. I found that adjacent pixels usually have relatively similar pixel values, so if I record the relative value compared to the region it’s in instead of recording the absolute value, I can save even more space.

->

^ My algorithm(above) is smaller and preserves much more information than simply pixelating the image (below).

2. Image Format

I recorded the image data directly in bits, for in this way I have the best control over them to make sure no space is wasted.

The image data consists of an array of patches, and each patch is represented by the following groups of bits

00|00|00|000
1 |2 |3 |4

Group 1 denotes how many “quarters” we’ve taken during the phase of dividing the image to get this patch. This is the only positional information we need because with it we will be able reverse the recursion to infer exact size and location of the patch.

Group 2 denotes the value of upper half of the patch, while group 3 denotes that of the lower half relative to the upper half.

Group 4 is the pattern ID 1-8 that matches the patch. If more aggressive compression is necessary, we can reduce the variety of patterns into 4 or 2.

3. More Compression

The procedures above compressed the image a lot, but it’s still not good enough to be contained in just a few barcodes. Golan urged me to find more algorithms to compress even more.

Since the compressed image has almost reached the threshold of unrecognizably, I decided to do lossless compression directly on the bit data instead.

After doing research, I figured the best idea is to try every possible kind of lossless compression on my data, and see which works. So I applied each algorithm listed by Wikipedia.

Most of them increased the size of my data instead. But one of them, arithmetic coding, was able to reduce it by around 10%.

Basically what arithmetic coding does is that it divide a string of bits into groups, and substitute groups that are used most often with a shorter code and groups that are less used with a longer code.

I then use base 64 encoding to convert bits into alpha-numeric characters to be used in barcodes. Interestingly I didn’t know the real name of this method at first, and defined my own rules and character set for my program. Later Golan mentioned base64, and I realized that it’s what I’ve already been using, so I changed my character set into the standard one.

After the encoding, every 6 bits will be turned into an ASCII character, so the elephant image above becomes a brief nonsensical code:

5l8vky2c0LqKxCK6mu3jRrq6/KP1FN76+n8YhFch44cp6VP57n7XGHP2/IUMOQprFmYtl9Lf7Sfz/Arb2fz2YDfyo5U1l5mYbtrZ7OVMm/btqxZ57Jh0lRdUcfshxPRzMPJHjg

4. More Colors

Having done greyscale, I thought I can do three channels just for fun. I compressed each channel differently, and combined them to get a colored image. The result is exciting, because each channel is quartered and pattern matched differently, the overlaying created huge variety of (more accurate) shapes and colors, thus increasing actual recognizability.

After doing some more optimizations, I was able to compress a three-channel image into around the same size as the greyscale image. So I decided to use the 3 channel version in my final product.

5. Pre-processing images for better output

Since the number of different colors is limited in images produced with this method, increasing the contrast/saturation of the original image before compression improves the result. For example, if we have a grayish image with pixels whose colors are not too different from each other, the algorithm would treat them as a large gray patch.

So I wrote something to manipulate the histogram of each channel, cutting off excess at both ends, to make sure the whole spectrum is utilized. This is what makes my output images look so colorful.

6. Conversion to barcode


photoBarcoder

I decided that I’m going to present the product by making it into a mobile camera app, with which people can take pictures and convert them right into barcode. Then anyone can scan the barcode and reconstruct the picture in any device installed with my decompression algorithm.

I programmed everything above in Python, but I then realized that I need to translate it into some other language for it to compile for mobile platform. I found some Processing libraries that allows interfacing with the android system and sensors, so I decided to translate all my code into Processing.

After doing so I discovered that the above mentioned libraries are useless and can only do simple things. So I was forced to learn Java used in Android Studio to talk to the phone directly.

I took my phone and wandered around campus to test my app. Then I did a lot of tweaking, crashing, debugging, making GUI stuff, etc.

Below are some screenshots of an early iteration of the app.


Final Screenshots


Left: taking a photo. Right: preview a photo.

Left: generate barcode. Right: settings.

Using non-photoBarcoder barcodes to produce glitch art

^ Barcodes from coke bottle as red channel, cup noodle as green channel and delivery box as blue channel.

You can even directly type text into the program and produce images. Below is the course description used as if it’s content of barcodes.

Printing and Distributing Barcodes

I’m currently learning ESC/POS language to control a thermal printer so it can print out the barcodes to be pasted everywhere.

Gloeilamp-Place

Freestyle Drone Photogrammetry 

http://gph.is/2mKWBsn

Download a build of the game HERE.  Controls are WASD and IJKL.
Control forwards/backwards movement and roll with WASD, control up/down thrust and yaw with IJKL.

Freestyle drone flying and racing is a growing sport and hobby. Combining aspects of more traditional RC aircraft hobbies, videography, DIY electronics and even Star Wars Pod Racing (according to some), drone pilots use first person view controls to create creative and acrobatic explorations of architecture. My brother, Johnny FPV, is increasingly successful in this new sport.

For my capture experiment, I used Johnny’s drone footage as a window into Miami’s architecture. By extracting video frames from his footage, I was able to photogrammetrically produce models of the very architecture he was flying around. While position-locked footage from videography drones such as the DJI Phantom has been shown to create realistic 3d models, the frenetic nature of my footage produced a very different result.

http://gph.is/2mLD37d

As I produced models from the footage, I began to embrace their abstract quality. This lead me to my goal of presenting them in an explorable 3D environment. Using Unity, I built a space entirely out of the models from the drone footage. Even the outer “cave” walls are, in fact, a representation of a piece of Miami architecture. The environment allows a player to pilot a drone inside this “drone generated” world.

Technical Details & Challenges

My workflow for this project was roughly as follows. First, download footage and clip to ~10-30 second scenes where the drone is in an interesting architectural space. In Adobe Media Encoder, process the video to a whole number framerate, then export as images through FFMPEG. More about my process with FFMPEG is discussed in my Instructable here. Then, import the images to PhotoScanPro and begin a normal photogrammetry workflow, making sure to correct for fisheye lens distortion. After processing the point cloud into a mesh and generating a texture, the models were ready for input into Unity.

In the end, the 3D models I was able to extract from the footage have very little structural resemblance to the oceanfront buildings they represent. If not for the textures on the models, they wouldn’t be identifiable at all (even with textures, the connection is hard to see). I found that the drone footage more often than not produced shapes resembling splashes and waves, or were otherwise heavily distorted, and were much more a reflection of the way the drone was piloted than a representation of the architecture.

In Unity, I imported the models, and almost exclusively applied emissive shaders which would allow both sides of the model to be rendered (most shaders will only render the back faces of models in Unity; because my models were shells or surfaces with no thickness I needed to figure out how to render both sides). I found that making the shaders emissive made the textures, and therefore the models, much more legible.

I am still very much a beginner in Unity, and I realize that if I were to develop this scene into a full game I would need to make a lot of changes. The scene currently has no colliders- you can fly right through all of the structures. Adding mesh colliders to the structures made the game way too laggy, since the scene contains millions of mesh faces. Regarding the player character, making this into a true drone simulator game would require me to map all the controls to a RC controller like an actual pilot would use; I don’t yet know enough about developing player controllers to make this a reality. I also need to research more about “reflection probing,” as I would like to tweak some things about the mirror/water surface.

With help from Dan Moore, I also explored this game in VR on the Vive. Very quickly I realized how nauseating the game was in this format- so for now VR is abandoned. I may revisit this in the future.

What’s next?

Moving forward, I would possibly like to explore tangible representations of the 3D models. Below is a rendering of a possible 3D print. I discovered that some of the models, due to the input footage capturing a 360 degree world, became vessel-like. I would like to create a print where the viewer can hold this little world in their hand, and peer inside to view the architecture.

I would also like to begin creating my own footage, using more stable drones which are better suited to videography. One possibility is to create a stereo rig from the knockoff GoPros, and film architecture in stereo 3D.


kyin-place

Intro & Inspirations:

I was really inspired by Philipp Schmitt’s Camera Restrictaand wanted to use a similar method of crowd sourcing data while using geolocations. Therefore, I made a machine that given a latitude longitude coordinate and a picture taken at the location, will crowd source pictures that people have posted online and fuse them to create a single picture of the location.

Process:

First, I wrote a Python script using Temboo/Flikr API to extract all the picture information given a latitude longitude coordinate as input. I was able to get over thousands of images with one coordinate if the location is a popular spot, which was exactly what I wanted. Next I wrote another Python script to download all these images and save it somewhere in my laptop. However, I realized that it wasn’t realistic to use all the images at one location, since, people take such drastically different pictures. I had to figure out a way to pick our the pictures that looked closest to the “picture I am taking”. With Golan’s help, I was able to use the Openframeworks add-on ofxTSNE to create a grid that sorts all the photos by similarities.  
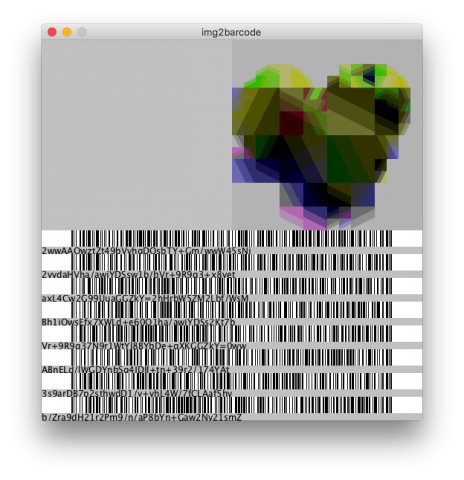
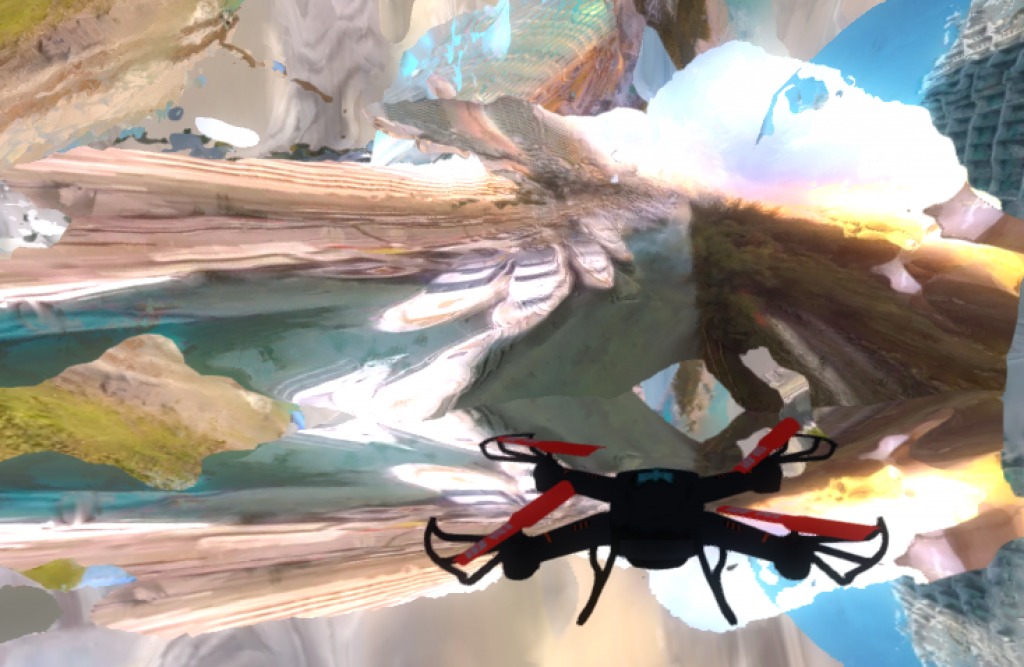
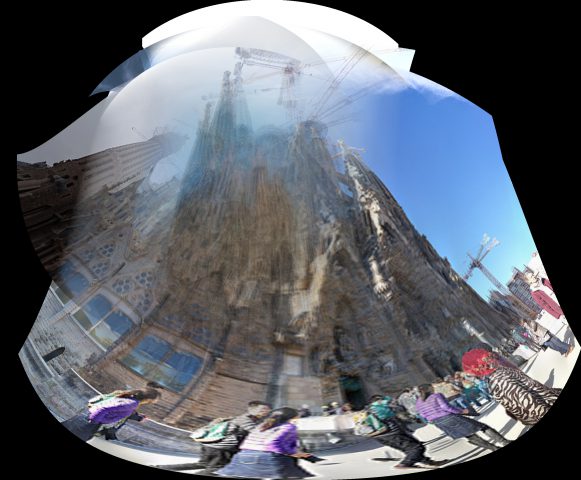
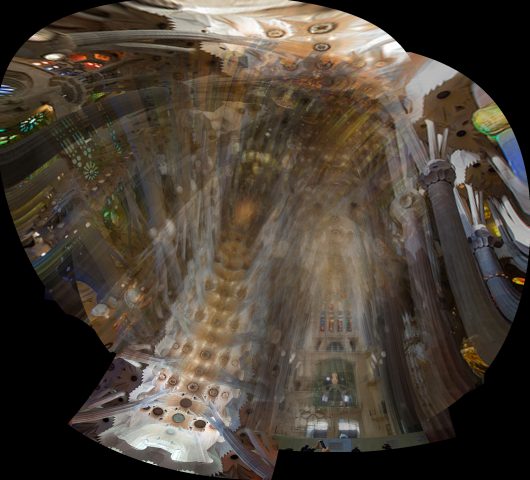
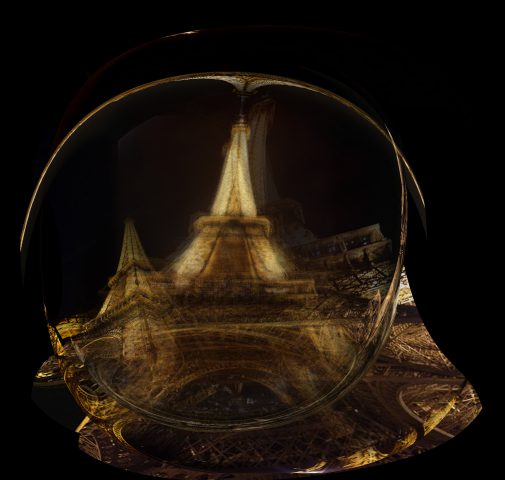
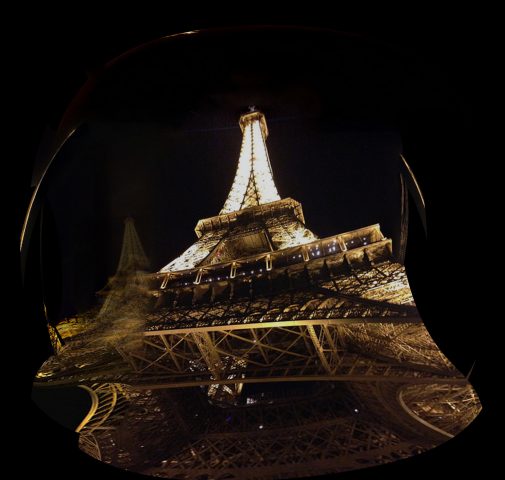
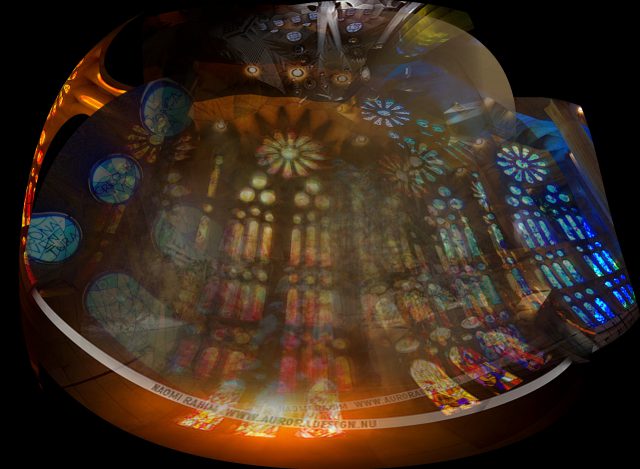
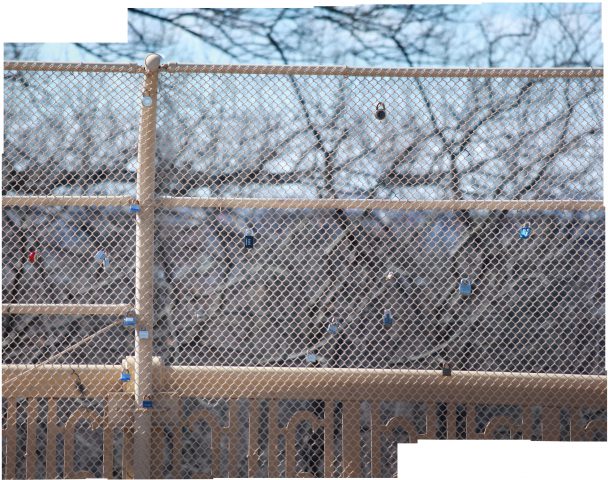
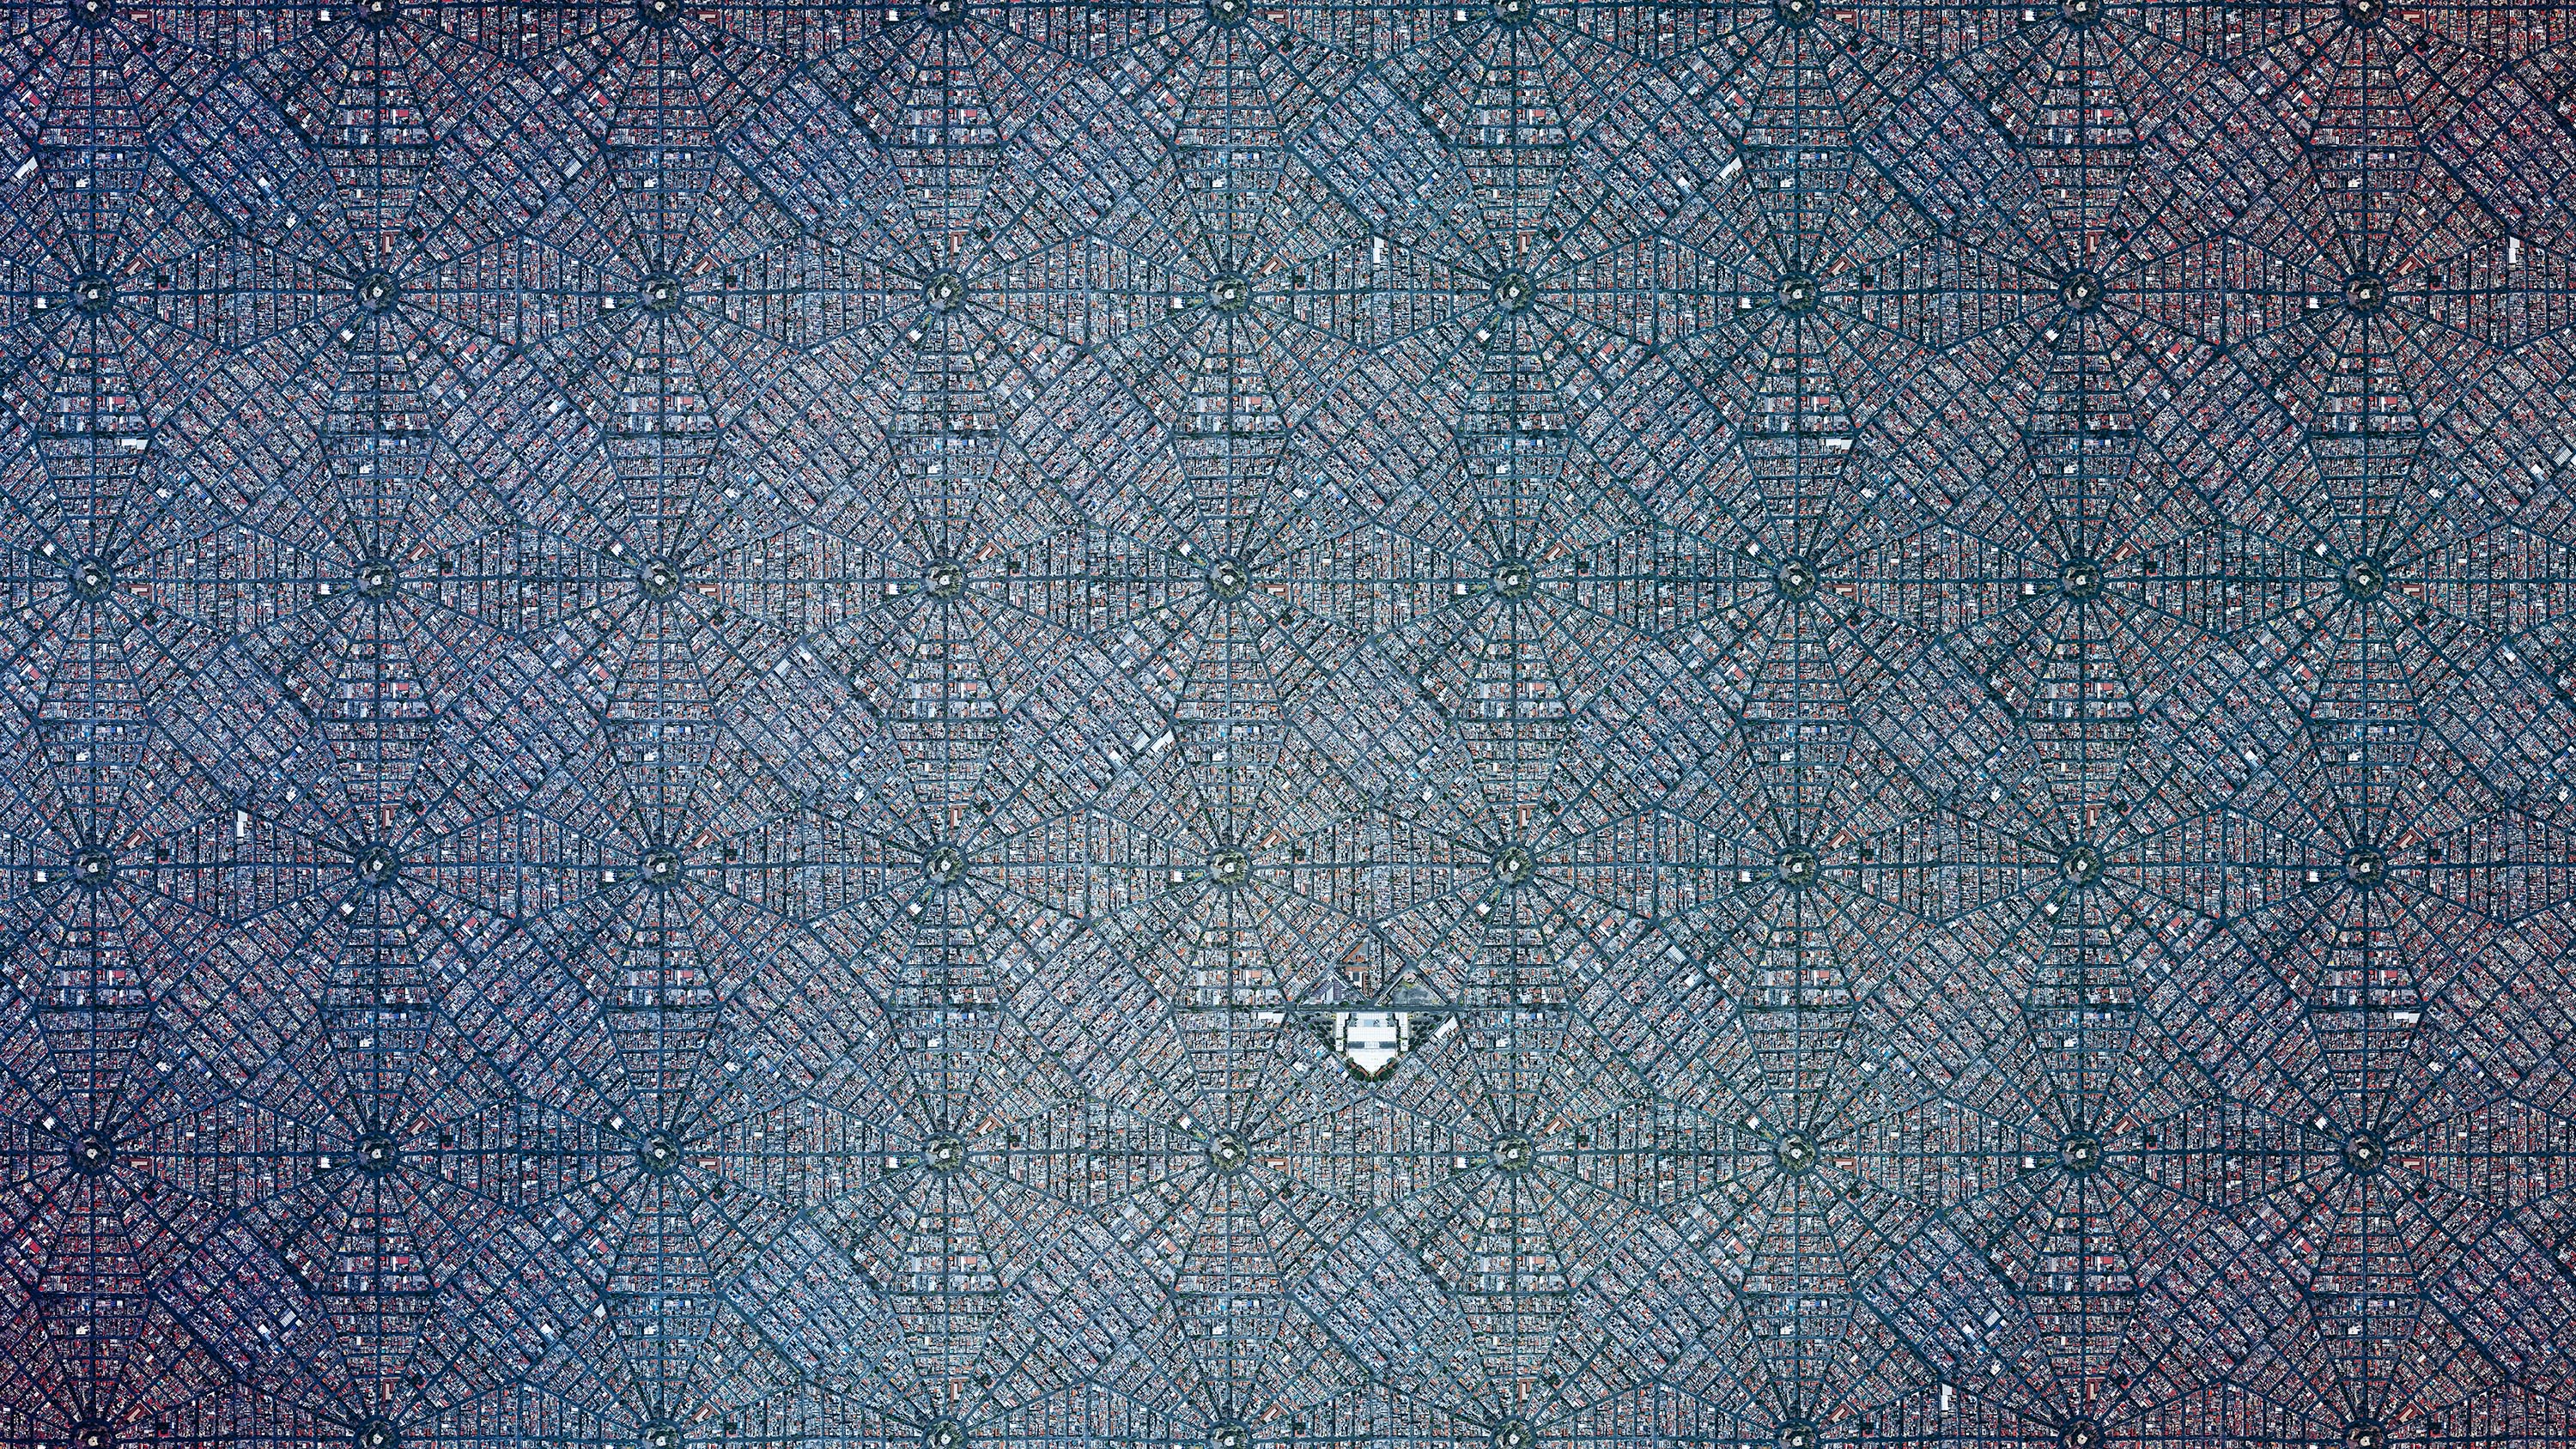
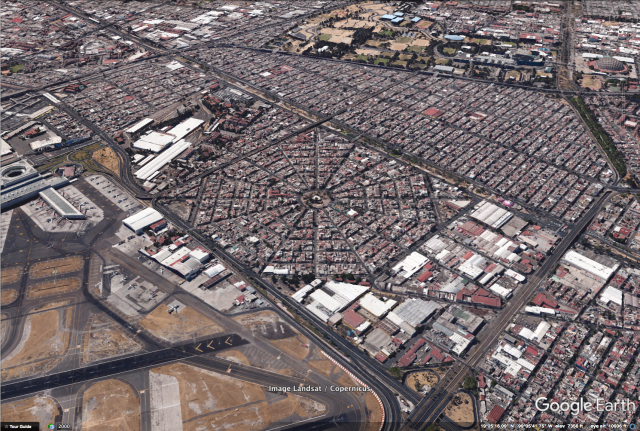
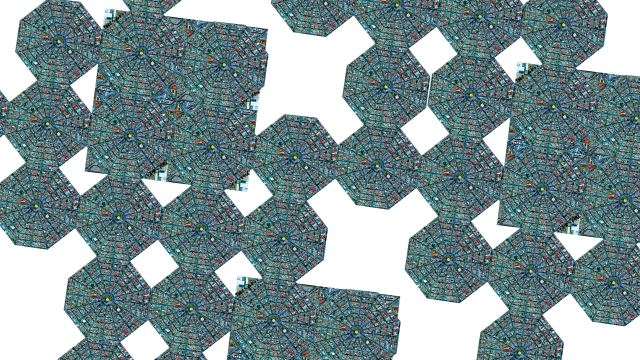
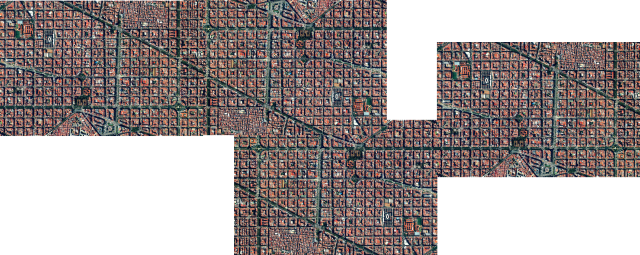
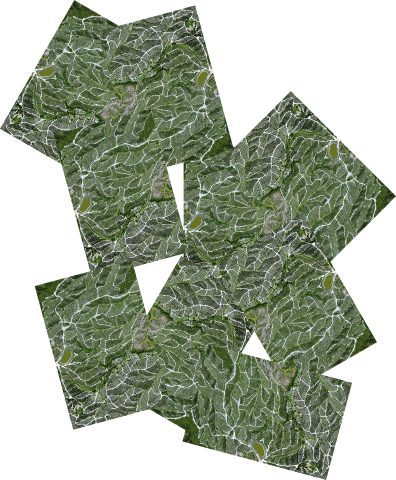
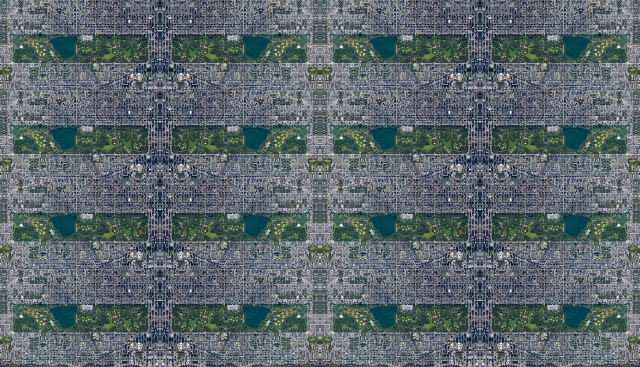
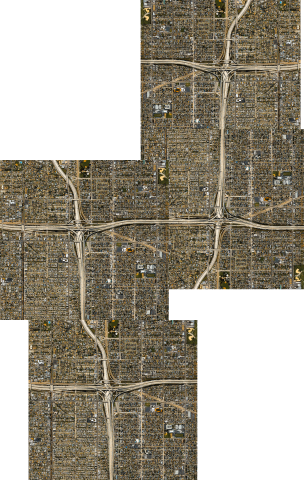
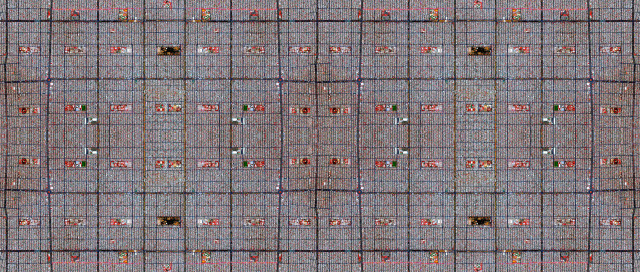
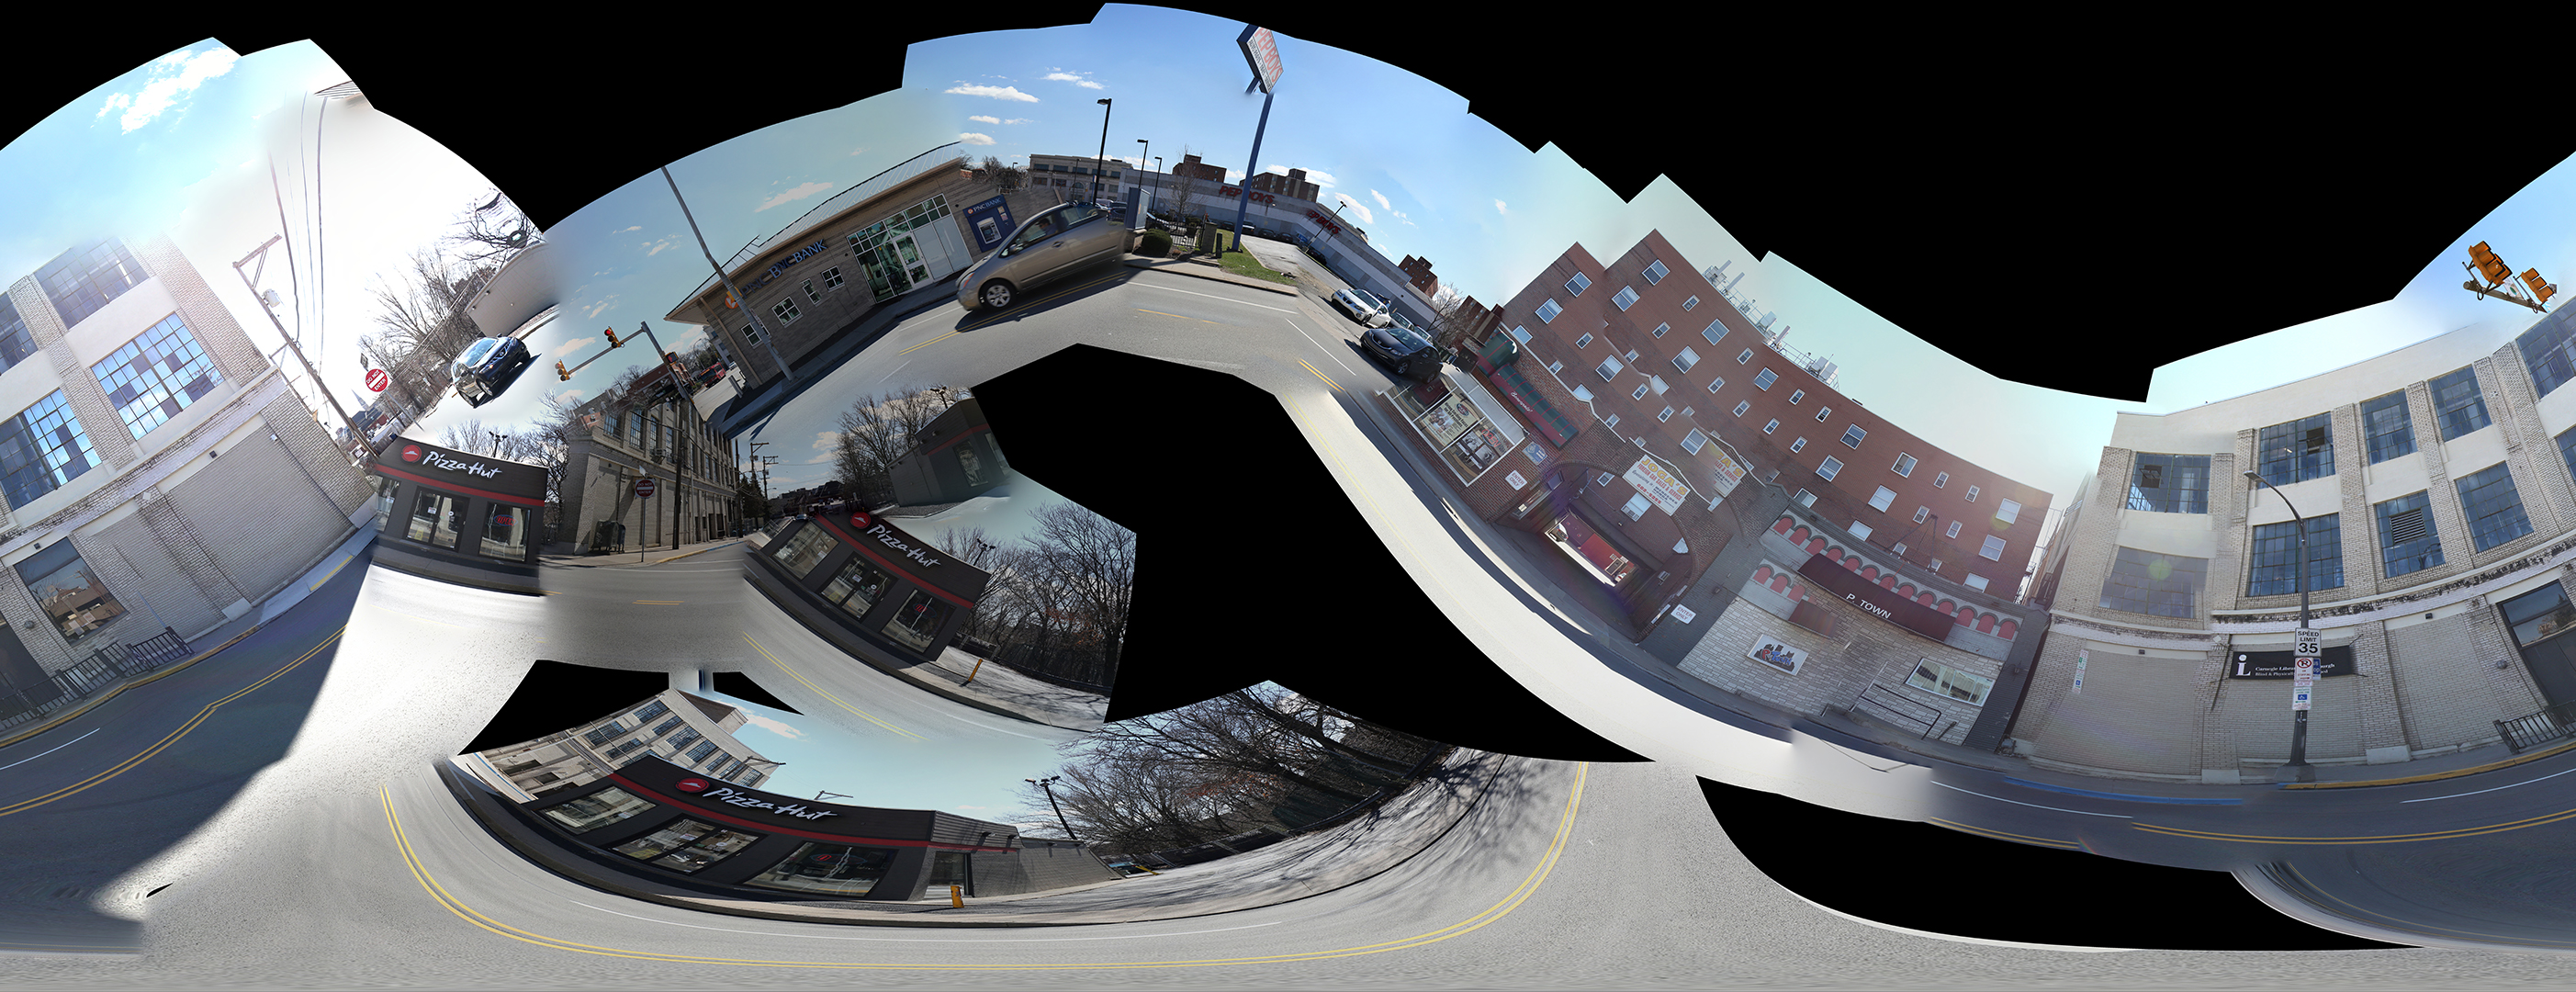
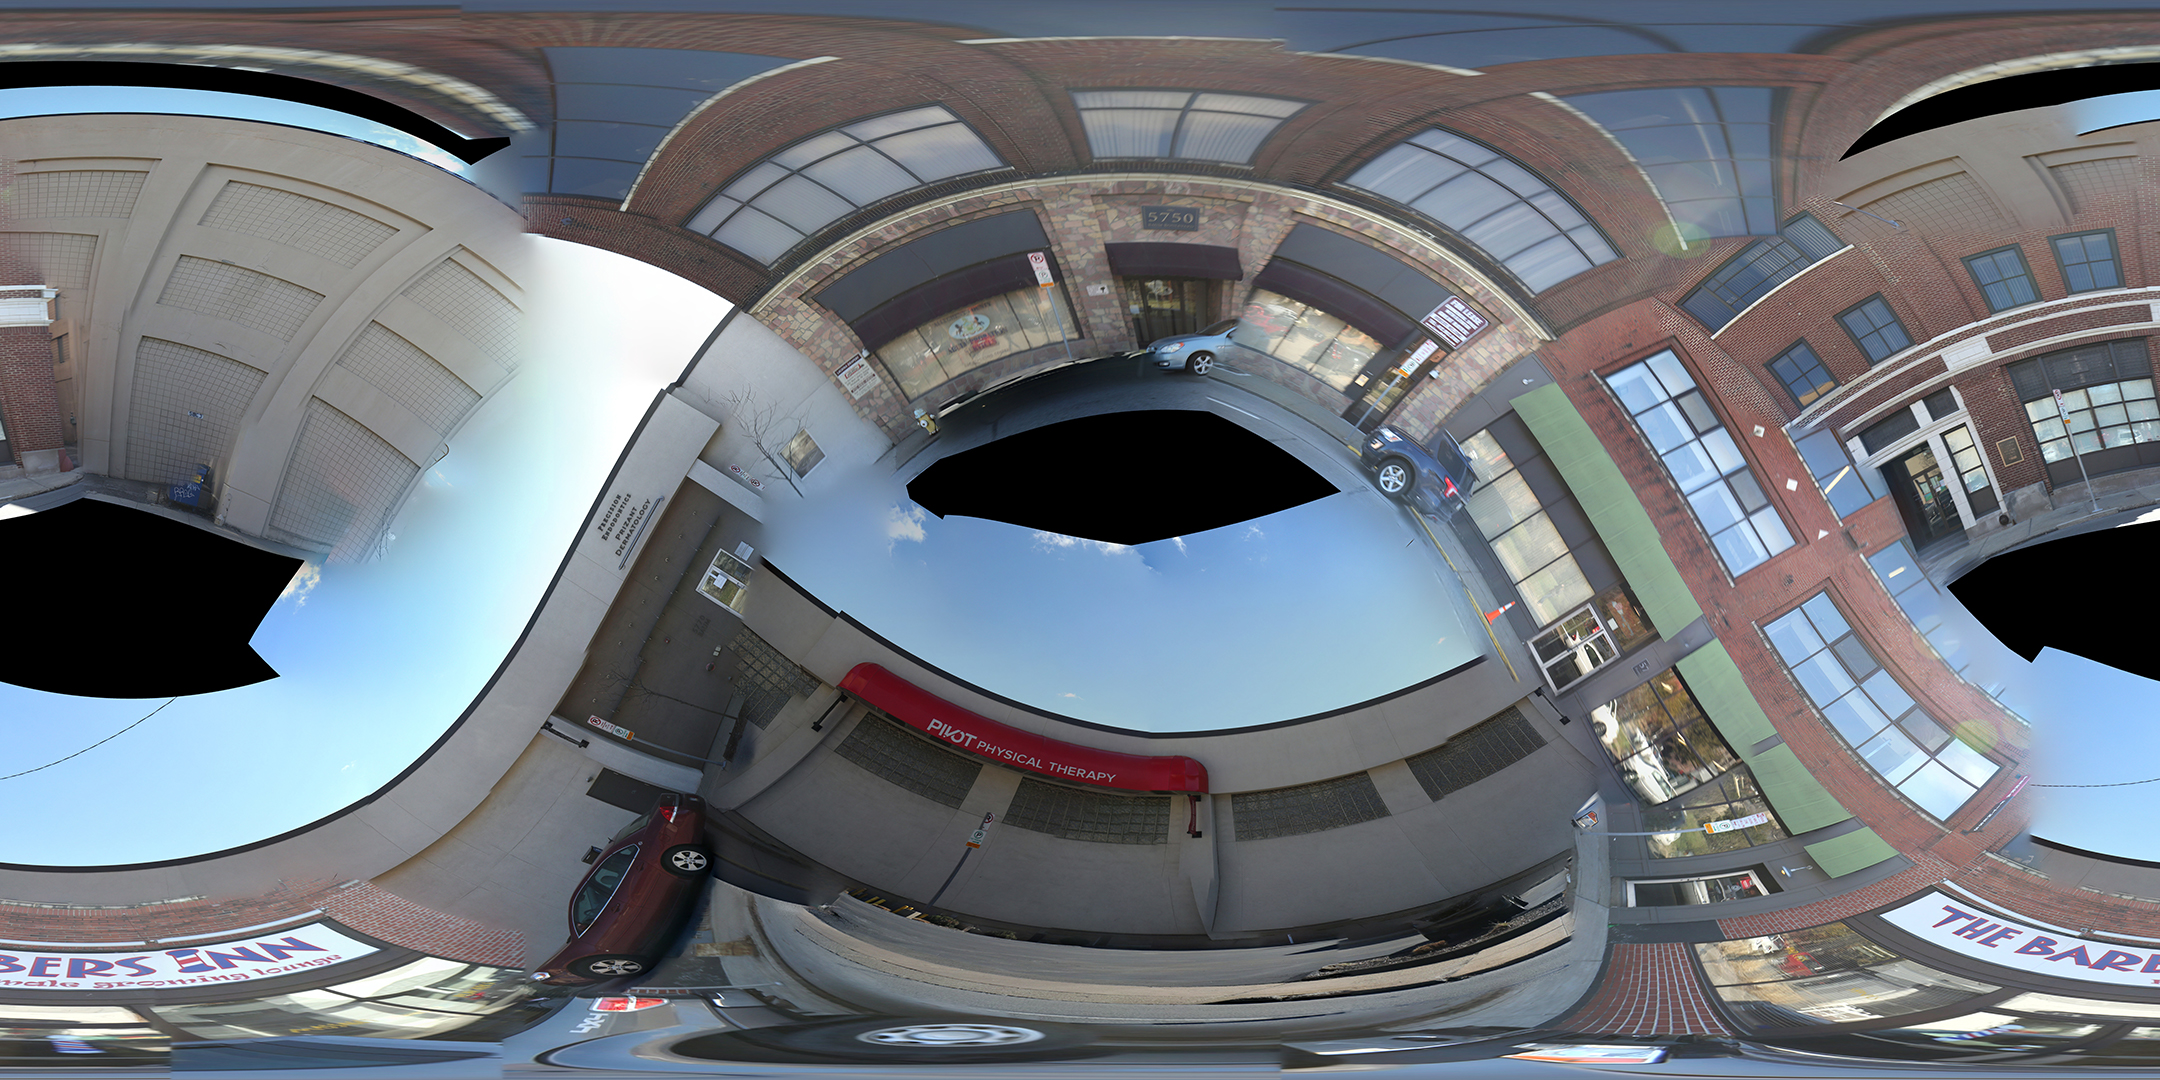
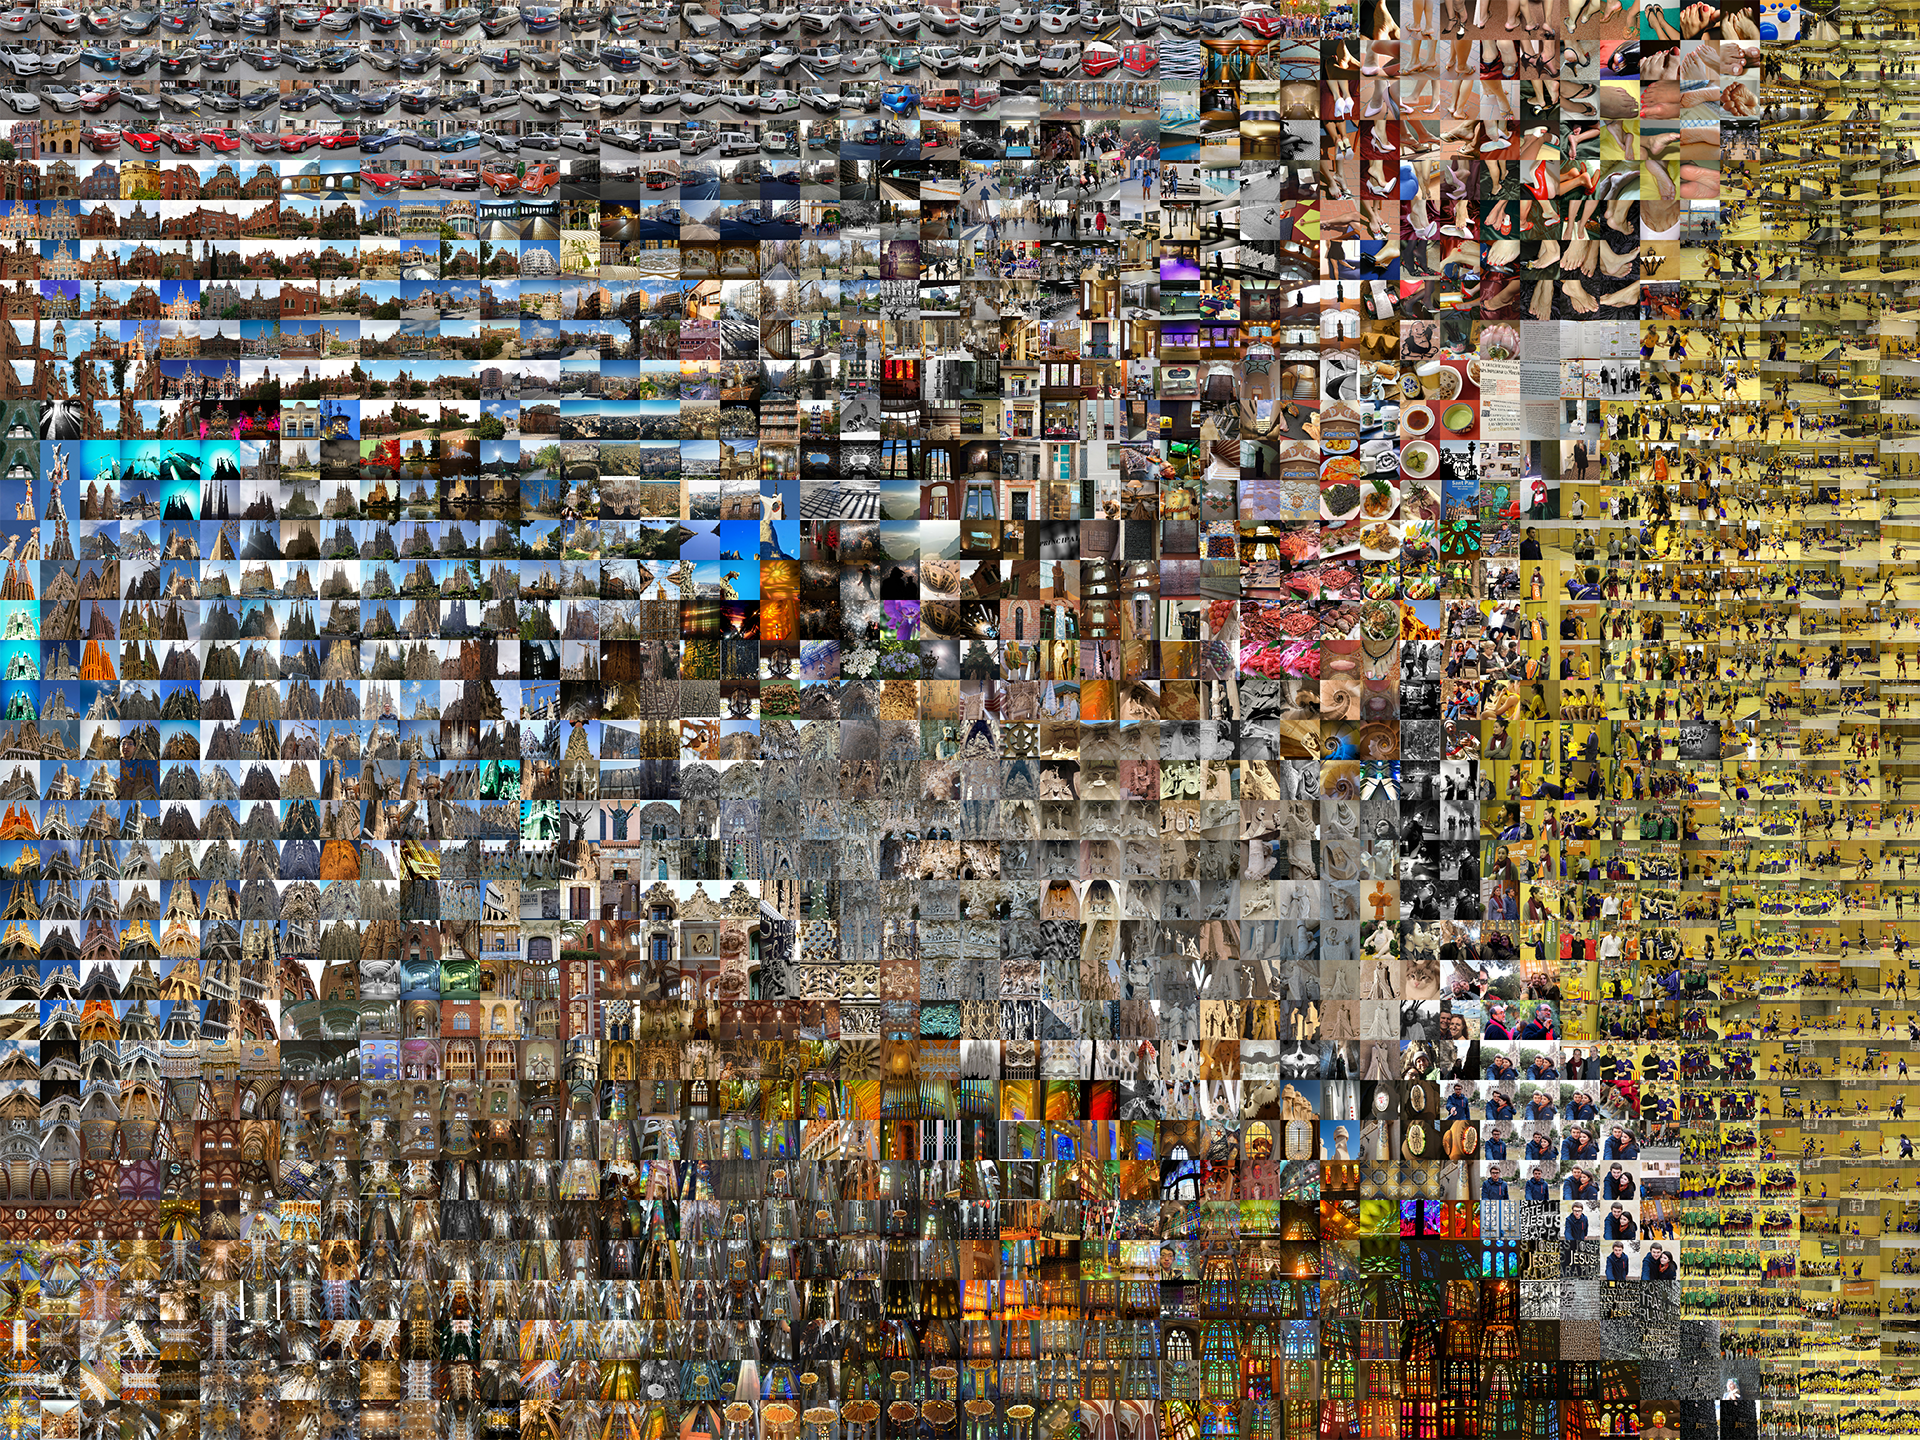
Finally I used a 7×7 grid to find the closest 49 pictures in the TSNE grid from a given image (ideally the image that I take), and put these batch of pictures into Autopano.

Results

The results turned out better than I thought. Some were fairly normal, and just looked like a shitty panorama job, and others turned out super interesting. Below are some results with anti-ghost/simple settings.

Conclusions & Future Plans:

Overall, I really enjoyed working on this project and was really impressed with my results. Since I’ve never worked with Autopano, I did not know what to expect. Therefore, it was very rewarding to see the results of this experiment, which turned out to be better than what I expected. Some things that I hope to do to expand this project is to create an actual machine that can do this in real time, and figuring our a more efficient way to filter through the pictures.

caro-place

Ultrasonic Exploration

Project Summary

What would it be like to navigate an environment using sound to navigate instead of sight?

To investigate, I built an echolocation device and used it to explore a room that I’d never seen visually. The probe is made using ultrasonic distance sensors that trigger both an LED and a speaker based on proximity.

I set up a 360 camera to document this exploration process, and wrote a simple processing sketch to add the brightness of the LED to each future frame of video. The end result is a recording of my path through the space.

Place: Somewhere I’ve Never Been

In documenting the process of visually blind exploration, it was important that I have no preconceived image of the room I’m documenting. I had my boyfriend come wander around campus with me and help pre-select mysterious rooms for filming. He chose the most unfamiliar room of all: the men’s bathroom in the basement of Doherty.

Capture System Part 1: Ultrasonic Probe

My probe consists of three ultrasonic sensors, an LED, a buzzer, and an Arduino. All of these are wired together onto an old crutch I had lying around in my closet.

The ultrasonic sensors use echolocation to determine distance. They emit a high frequency sound waves, and time how long it takes the waves to return. Whenever any of the ultrasonic sensors get within a certain range of an obstruction, the LED lights up and a buzzer beeps to let me know I’m close to something.

Here’s a longer video I made playing around with it (the buzzer was disabled for this because I didn’t want to wake people up):

At the end I wound up putting a “shield” on the LED to mitigate the classic “light painting” look of following a glowing dot around. This way it’s more about what’s being illuminated than the light source itself.

Capture System Part 2: 360 Camera 

I chose to document the exploration process using a 360 camera.

I had my boyfriend put the 360 camera in the room for me and turn off the lights so that I never saw the location. I blindfolded myself, and then began the process of blindly probing the room. My only spatial cue was the beeping of the speaker.

The 360 camera wound up documenting my exploration via only the LED light’s path around the room. Similarly, all I knew about my environment was a single beeping noise: in my mind, the buzzer and the LED are equivalent, but one is sonic and one is visual.

Media Product: Additive Brightness 360 Video

The original video I got was a light moving around a room in 360, turning on and off. Using ffmpeg, I split the video into frames. Then, I wrote a simple processing sketch to additively composite all of the bright areas from the previous frames into all future frames. This way, the LED additively paints the environment, similarly to how every new “beep” from the speaker gave me new spatial information.

The video is meant to be viewed in a Google Cardboard, so people can spatially experience the environment.


Evaluation

Blindly wagging a stick around deserted men’s bathrooms at 3AM with only beeps to guide me was quite an experience. It was very uncomfortable not being able to see what I was doing. It felt like I lost control of the product I was creating by not being able to see it. In the end, this was really the point of the project.

Result

weija-Place

Holograms

For my place assignment, I was really inspired by the long exposure photography from various artists that Golan showed us in class. The concept behind my idea for this assignment was to capture a stationary location such as a building in a unique way. Several works shown in class featured people capturing simpler renders of objects such as letters, or the wifi bar graph. I wanted to explore the boundaries of how accurate of a light hologram I could render on a camera. Aside from not even knowing the possibility of this form of photography, some other unknowns I faced were not even knowing what settings to use for this type of photography, how to capture it effectively, and what editing methods to best bring out the picture. After countless failed pictures, the one featured below was probably one of the better ones. It features the layout of the Software Engineering Institute office building located a bit off of Newell Simon Hall.

Some bigger sources of inspiration came from Dentsu London’s Vimeo video:

For the capture, everything sort of presented itself out of convenience (I had to get more tangible goals to get the project done in an effective time frame). I’m currently working on a nonrelated HoloLens project, so I had a decently detailed 3d mesh of the building I worked in. I knew what kind of long exposure photography I could get from simpler lights, such as just rectangle subsections in the Dentsu London’s video or the LED light strips from the wifi strength visualization project. I wanted to explore what kind of resolution I could get from more precise objects, such as a room mesh. Obtaining the mesh wasn’t too bad. Microsoft Hololens has a lot of support for extracting the AR mesh. Next, I imported the room into Blender, which I found a very suitable app to find the room subsections.

I used a blender method called “boolean intersections” where I intersected the object with several thin planes going in both the x and y-direction:

With these subsections, I made an animated gif in both directions:

Horizontal Subsections
Vertical Subsections

Which I then imported onto my iPad, and I dragged around space. Overall, the project took me a long time, as this was one of my first projects (lol) that I couldn’t resort to coding, and I had to learn new hardware and photography techniques.

In terms of reflection, I’m quite proud of what kind of photos I obtained, however I know there’s a lot of room for improvement in my handling of the photography. I’ve also learned a great deal about perspective and which angle to take photos of the subsections. I feel like my project successfully conveys the 3d aspects of the room mesh in a unique form of photography. Ideally, I would have liked the images to be more stable and have higher resolution, so that they could look even more accurate.

Results

Side shot from another angle:

Not the cleanest shot ever, but it captured a decent bird’s eye view of the building.

Conclusions and Remarks

In hindsight, I definitely undercut the potential of this project for picking such a commonplace location to map. I should have utilised this capture method on a much more impactful or meaningful location, other than the inside of workplace building. On a brighter note, however, I was quite pleased with how accurate my images ended up turning out. Since I started this project with virutally no knowledge of photography, I felt like I learned alot from this project.


fatik – Place

Place Project

I made a series of camera obscura time lapse videos in my dorm room. I’ve always heard about this technique from school, but I’ve never had the chance to make one and experience it. It was a very surreal experience to see the outside world projected into my room. I like the concept of integrating what is going on right outside of my window and projecting a very public space into my little compartment.

I have a bunch of videos, but this one is my favorite. When the light is projecting into the room the image is flipped vertically, so I edited the video so that my room is upside down.

This is the original video before it was flipped.

This video was around noon, so the light was extremely bright.

I thought it’d be interesting to see both videos in perspective of the room and the outside world together.

Gif #1

Gif #2

Some interesting photos from the plethora of photos

Process

I made three camera obscuras that led to my final one. I did one in Margaret Morrison with the help of some professors, one in my friends dorm, and one practice session in my dorm with different sized peep holes. I think the most difficult part was just making the room as dark as possible.

Margaret Morrison: attempt #1

Friend’s room: attempt #2

My room: attempt #3

I have a corner room, which is great because there’s a lot of movement outside. But it was a pain to cover up all of my windows.


DMGordon – Place

For my place project, I made a point cloud compositing system which condenses multiple point clouds into a single three dimensional pixel grid.

I began this project with the intent of capturing the freeway I live next to and a creek in Frick Park. I started with attempting to generate point clouds using a stereoscopic video camera and Kyle McDonald’s OFCV OpenFrameworks addon. The resulting images were too noisy for compositing, however, and I had to switch capture devices to the Kinect. While the Kinect provides much cleaner point clouds, it requires an AC outlet for additional power, tethering me to wall sockets. Others have found portable power supplies to remedy this, and my next step is to follow their lead in making a mobile capture rig.

The Kinect automatically filters its infrared and visible color data through its own computer vision algorithms to produce denoised depth data, which can then be projected onto the visible color image to create colored, depth-mapped images. I could then take each pixel of these images and use the depth data as a z-coordinate to populate a three dimensional color grid. By adding multiple frames of a depth-mapped video into a single color grid, we are treating the color grid like a piece of photopaper during a long exposure. The resulting images contain the familiar effects of long exposure photography in a three dimensional vessel:

In addition to containing an additional dimension of space, we can run colorpoint-by-colorpoint analysis on the grid to split and extract subsections of the image based on various factors. Here are some tests experimenting with simple color-range partitioning:

Full Spectrum:

Filtered for Greenness:

Filtered for Not-Greenness:

Going forward, I see several ways to expand these methods into provocative territory. With a portable capture rig, we could capture more organic and active locations, where movement and changes in light could lead to more dynamic composites. Also, more intense analytics on the composites, such as filtering blocks of the images based on facial recognition or feature classification, would produce more compelling cross sections of the data. Adding multiple Kinects compositing their point clouds into multi-perspective frames would open the door to volumetric analysis. Even rigging a single Kinect up to a Vive controller or an IMU could provide a global coordinate space for expanding the composites beyond a single frustrum of reference.

Here are a couple more images of backyard experiments:

BBQ + House true-color:

BBQ + House 360:

More BBQ related pictures to come

hizlik- PlaceProposal

I still haven’t decided on a place yet, and honestly haven’t quite decided on a technique yet either (I may do multiple techniques). I will list my ideas as such:

  • A “panorama” stitched together consisting of photos of the side of a building. However, the photos will wrap completely around the building (walking sideways while taking them), somewhat “unwrapping” the building I’m photographing by the end of the project. This could be a building or some other significant space
  • A photo-collage protraying a significance or pattern, or just looks cool, similar to the images below. I was thinking maybe some pattern amongst students walking along campus, or some off-campus location as well (but with enough “traffic” of people, vehicles or animals to make it a viable location to collage).
  • A collage of “cut-outs” of significant or cool-looking landforms, buidlings or other repeating places and patterns using Google Earth or maps, such as this collage of pools:
  • Or some idea stemmed from those above

All images are from the book Photoviz.

fatik-PlaceProposal

Yet again, like any other project I’ve ever done I have too many things that I want to try and do. I’m still not sure what place exactly I want to do yet but I think I’m going to just keep doing things until I find out. I loved the examples from the book Golan showed us in class that one time, so I want to try those out. I’m also from Pittsburgh so I could possibly do something more personal that’s related to my home or family. I was also thinking I’d go to Millvale because I love the graffitti there and I’m sure I could find a lot of random artifacts on the rail road. There’s also a river that flows with Millvale and thought that it’d be interesting to see what’s in the river while I’m there.

Another thing I could possibly do is related to Carnegie Mellon itself. I’ve been really upset for the last couple of months about my major and the school culture itself. Me and a group of some people ended up talking about this and the idea of scraping Linkedn was brought up to see what people actually do after they graduate from this “world’s most renowned educational institution”. We thought it’d be cool to gather this data and somehow put it back into this place for reflection.

So yea, that’s what I’ve been thinking about and I’m kind of leaning towards learning how to “scrape” a website or something. But I also want to use the motion capture in the basement of Hunt. I think I’ll have to continue to scope down what my actual project is going to be.

Bierro-PlaceProposal

For this assignment, I would like to focus on a place in Tokyo that I find fascinating: Shibuya crossing.

I would like to extract and show in real-time the hustle and bustle happening over there. This would be done through optical flow or another Computer Vision method applied to the live webcam feed that can be found here: http://wwitv.com/tv_channels/b6809-Shibuya-crossing-Tokyo.htm

I am not sure about the output yet. It could be in VR, it could be a data visualization… But I would like it to be updated in real-time.

Gloeilamp-PlaceProposal

I have a couple ideas bouncing around for my place project-

  1. Trick Drone Photogrammetry. There is a growing “sport” of first-person-view drone trick flying, and an enormous amount of motion sickness inducing videos of pilots flipping around doing crazy maneuvers in a number of environments. My brother Johnny FPV is one of these pilots- I have been grabbing clips from his videos and processing them through PhotoScanPro to make really terrible 3D renderings of the spaces he flies in. These could manifest as an explorable virtual environment, or I could prepare them for digital fabrication.
  2. CNC+USB Microscope. I’d attach the USB Microscope to a custom tool holder on the CNC router, and set a toolpath for the microscope to travel along. I’d capture images at intervals along this path, and stitch them into an ultra high resolution image of any surface that could be placed on the router bed. Possible interesting subjects for exploration: an ant farm? soil samples? tin tiles? the palm of a hand?
  3. Photogrammetry in color infrared with Kodak aerochrome. I am leaning away from this idea as there isn’t a lot of foliage on the trees yet, and I’d like to take advantage of the way the film stock renders chlorophyll as magenta.

Ngdon-PlaceProposal

I currently have two ideas.

One is to install a camera on the face of each of the persons on the Walking to the Sky sculpture. The cameras will take a photo every minute or so, and these photos will represent what the statues will actually see if they have vision. For most of them I guess it will be the person before them frozen in the middle of a “walking” pose against the constantly changing sky. Some of them can probably see buildings and students and visitors walking pass them with the corner of their eyes.

The second idea is about using the barcode reader and its peculiar way to sense the world. I’m thinking of making a camera that takes photos encoded in a barcode format, and then prints it out, which is inscrutable to humans but can be decoded by a barcode reader. Then I can probably gather all the barcode photos about one place, build a little world in a box where everything is barcode, and put the barcode reader in there, who thinks itself is inside a VR experience.

For the first idea I probably need to figure out a way to have all the cameras take HDR photos, or the sky will be super white and the walking persons will before the camera will be really dark. For the second idea I need to invent a smarter way to compress image data then simply recording each pixel RGBs, or huge amounts of barcodes will be necessary to describe a single image.

cdslls-PlaceProposal

A place that has been on my mind semi-constantly for as long as I can remember is Dr. Seuss’ “Waiting Place” from Oh, the Places You’ll Go. I find it incredibly intriguing and terrifying, having seen so many people stuck in a much more real-life version of it.

the-waiting-place.jpg

I came up with a list of places where we are left waiting: bus stops, churches, hospitals, immigration centers, the DMV… Only one of them really stuck: Laundromats.

  1. Because of their eerie lighting and background noise
  2. Because it represents the epitome of “waiting” (boring, mundane activity, unable to leave and pursue something else, waste of time)
  3. Because of the population it is used by (waiting for a change? –> nobody prefers laundromats over owning their own washing machine)

As for the method, I was hoping to create a 3D model of the space using a Lidar Scanner, because I love the image quality it generates. Although I am still on the fence about it, because I would obviously lose the odd quality of light… I am also unsure of how the scanner responds to movement (which would be hard to prevent).

kyin-PlaceProposal

I was inspired by Philipp Schmitt’s Camera Restricta who used geotagging to make a camera that only allows the user to take pictures of locations that has not been taken by other people. I liked the idea of crowd sourcing images from the internet, while using geotags to create a machine or process that can track your location.

My project will use geotagging and perhaps a GPS to track your location, and compile images of what other people has taken in the specific location you choose to take a picture at. So instead of taking a picture through your own lenses, you will take a picture through the lenses of all the people around the world who visited the place you are at. I am still unsure how exactly I want to display the final image, maybe put them through autopano or some other image processor. I am also debating on what the machine will look like physically, either using a Raspberry pi or making it mobile.